Friday, May 22, 2020
Broader Market Review
Just as there are many moves in sports designed to fake out your opponent there are similar moves in stock prices to get you to part with your hard earned money by doing stupid stuff like selling when you shouldn’t, not buying when you should and a whole lot of other flat footed blunders.
Take the March 23rd bottom for example. Everyone was caught off guard by the bottom and tripped up with the immediate surge higher. No one was prepared for that.
Who wasn’t was calling for a continued collapse down to Dow 10,000 or even lower. Who wasn’t calling for a 1929 style depression? Who wasn’t calling for the sky to fall? It was pretty panicky out there and no one was talking about the possibility of a bottom being made. Well, maybe I was. I wrote on March 18th, two trading days before the bottom:
“Bottoms occur at times of peak fear. Peak fear will be followed by less bad news which will be followed by higher prices which will be followed by better news which will be followed by even higher prices. I don’t know how to measure peak fear but it sure feels like we are in the middle of it.”
That’s pretty much what has happened.
Then I wrote the following a few days later, the day after the bottom on March 24th, in “Get Ahead of the Recovery“:
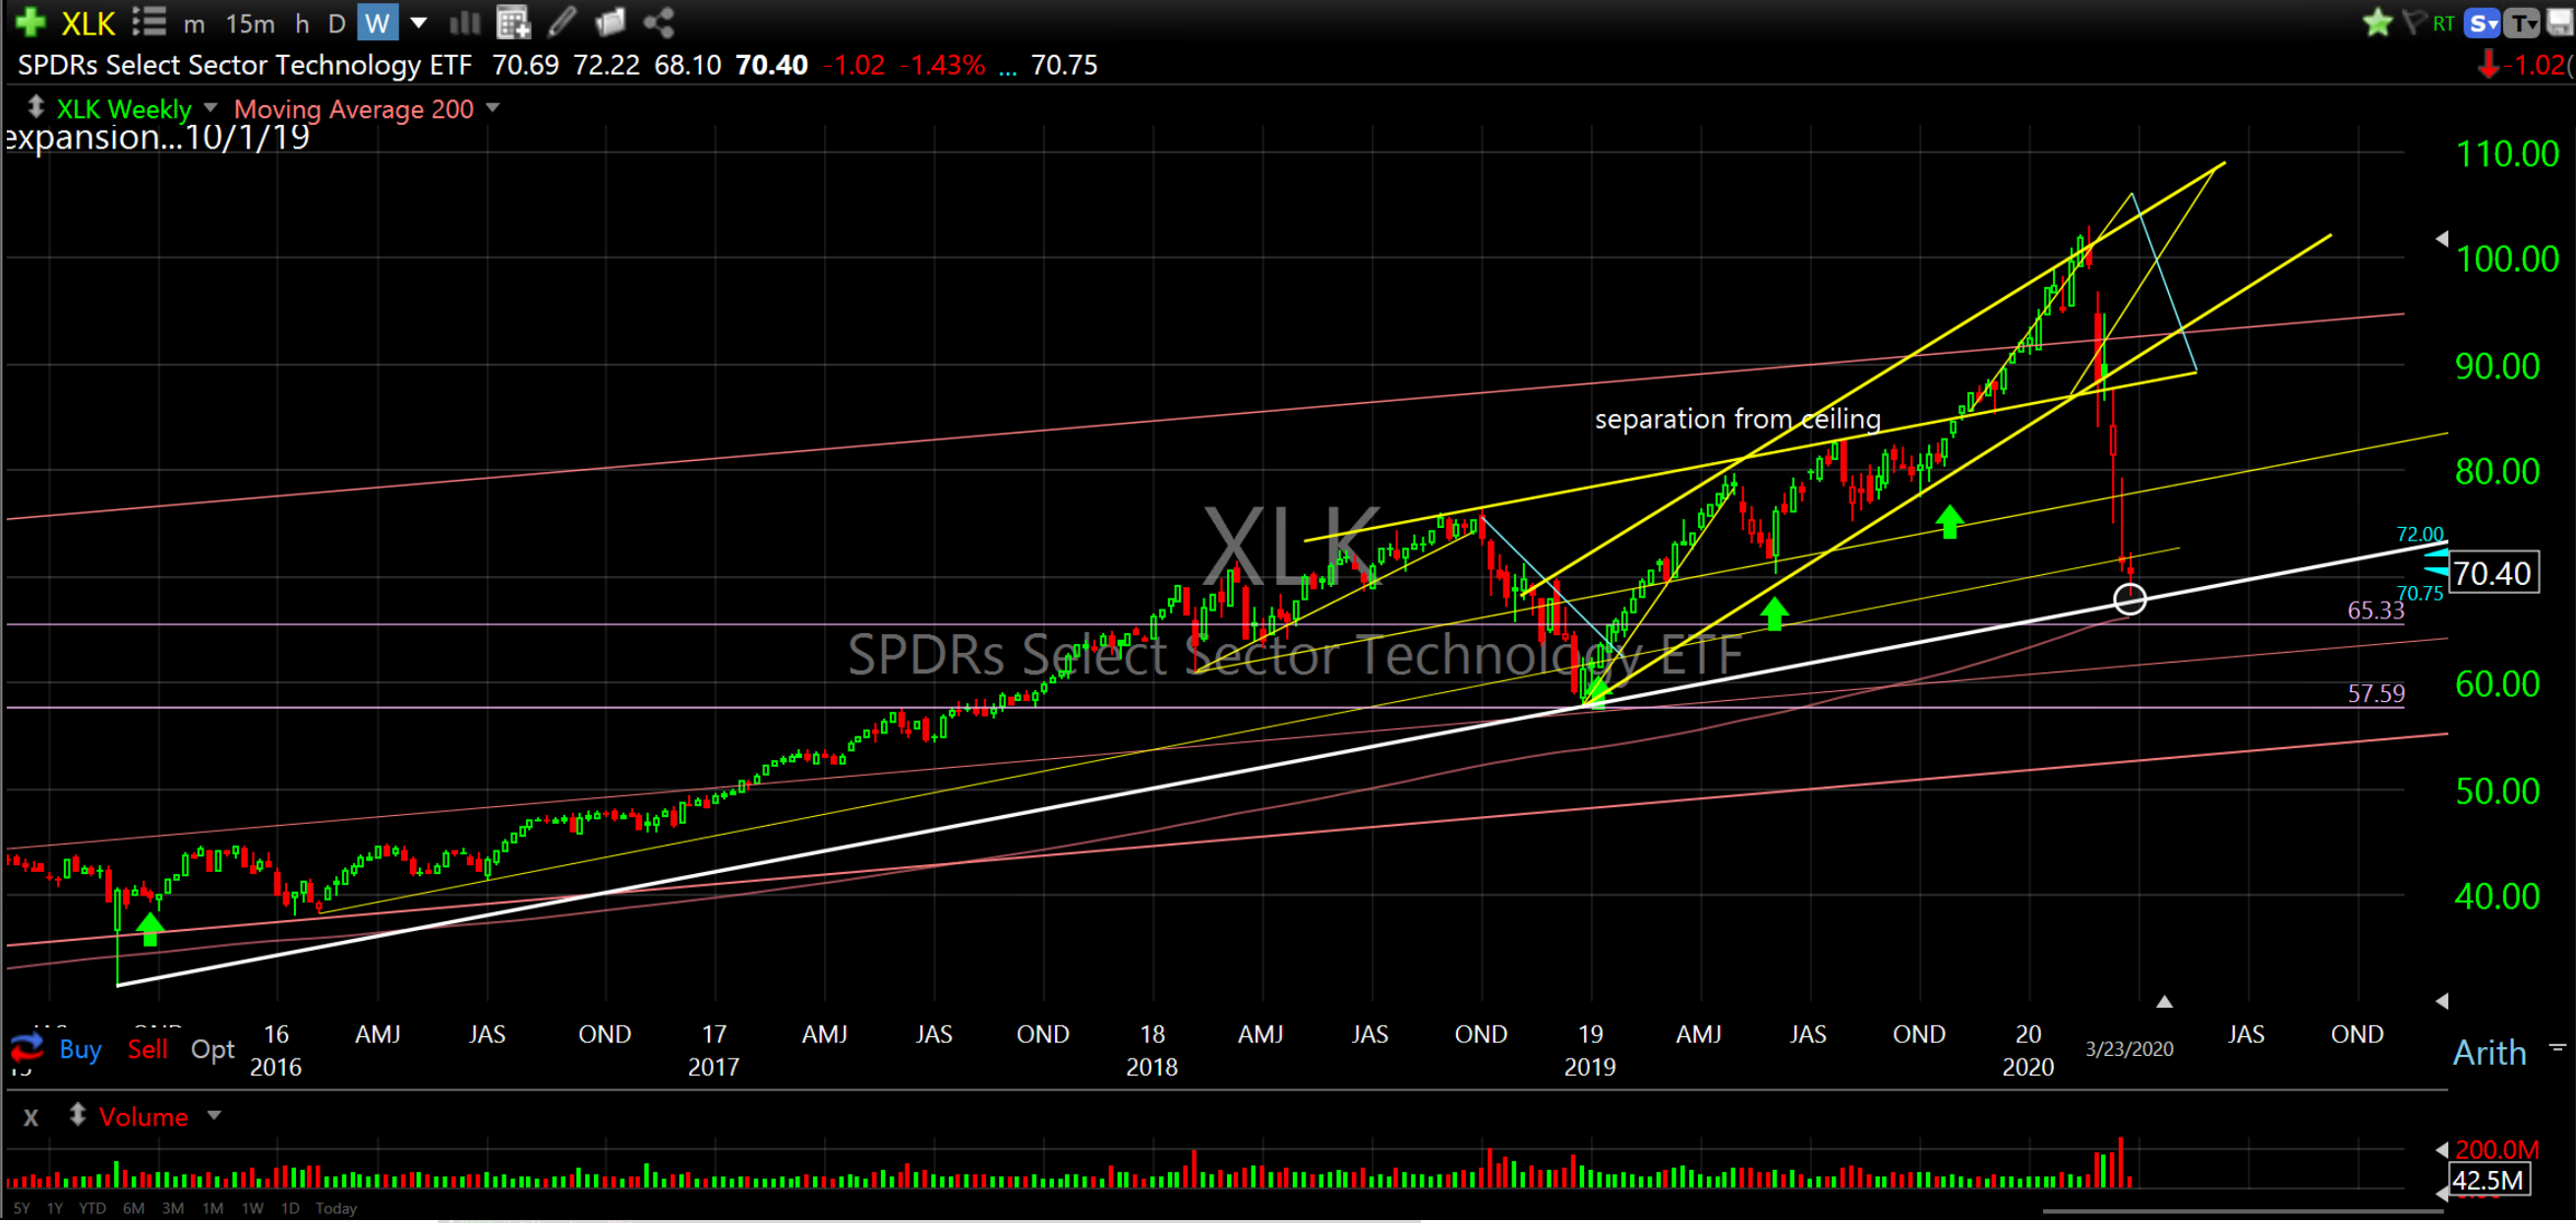
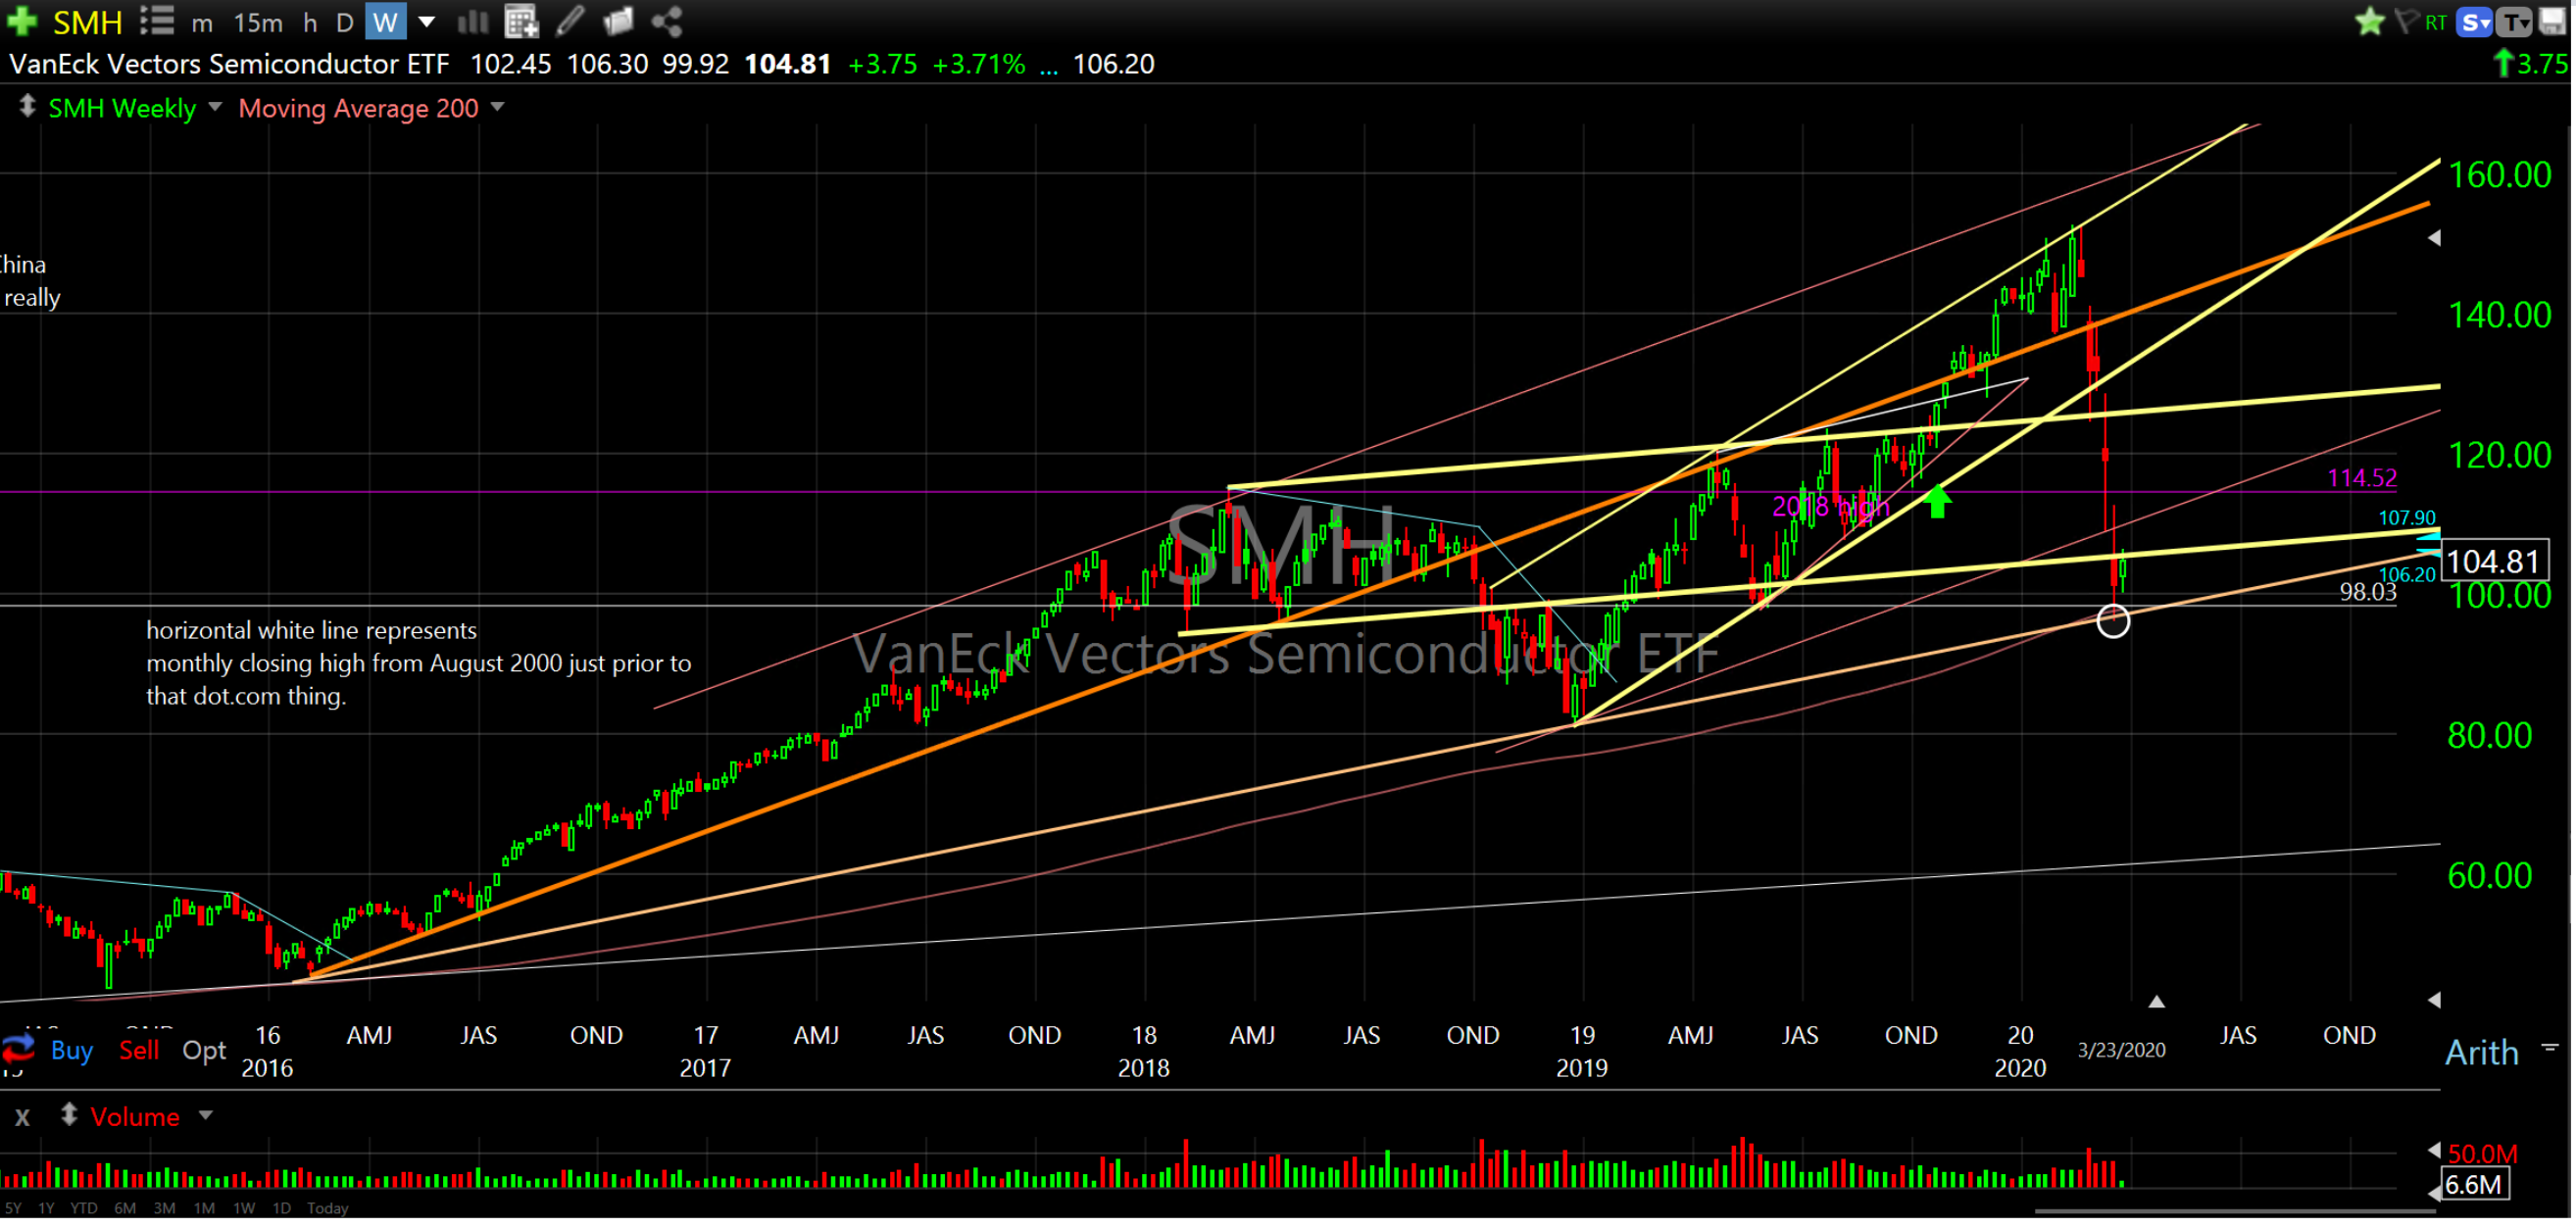
“Nasdaq has not broken this important ascending level. Neither has the technology sector ETF (XLK) or semiconductor ETF (SMH). In fact, they are a long way above these important rising price levels. Each of these technology heavy proxies are trading just above their respective ascending support levels from the lows in 2016. They are literally hanging on a ledge this support is still providing. It is critically important these levels hold.”
“If they do hold we can make a case for the end of the decline and the beginning of the bottoming process. The Dow, S&P 500, Nasdaq, technology sector and semiconductor index are each positioned at these critical levels that are logical places to bottom and any failure here would signal further declines.”
“This presents us with long term asymmetrical risk/reward opportunities. When price defaults to these long term levels you can bet big buyers are paying attention and beginning to incrementally step in. There is a clear defined risk under such critical support and unlimited reward above. Low risk/high reward entries are always associated with price trading down into these important inflective price levels.”
“While the broader market will lead the breadth of individual stocks higher it is supportive to see individual quality stocks also trying to bottom at their own long term support channels. We want to see individual stocks bought and bottom here to begin the process of establishing a floor. There are a significant number of individual stocks positioned at these critical levels and these values are very compelling.”
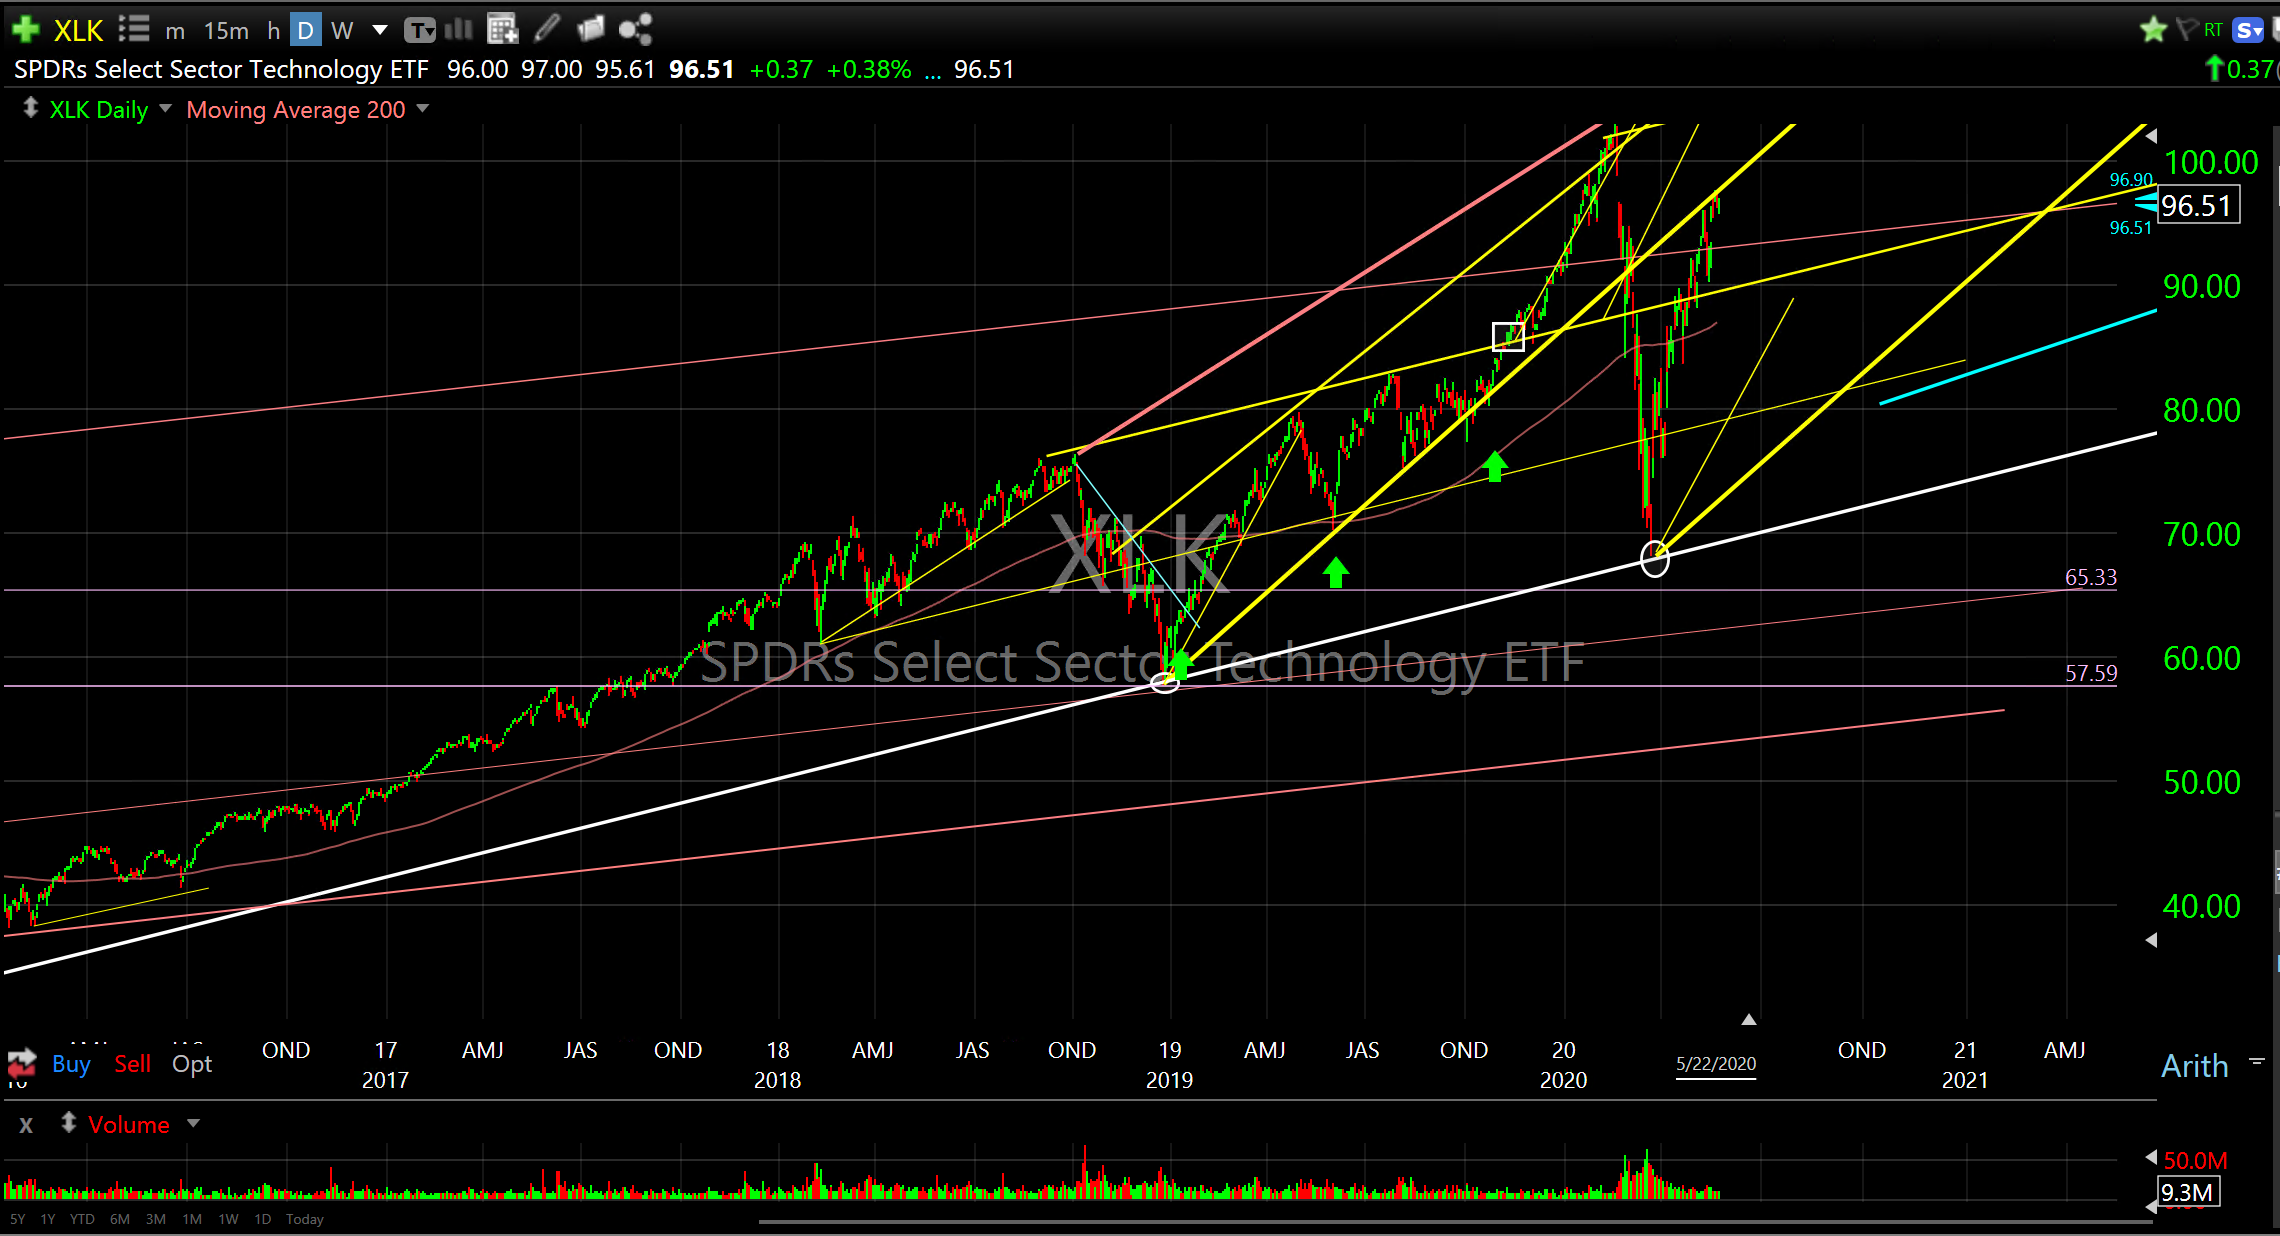
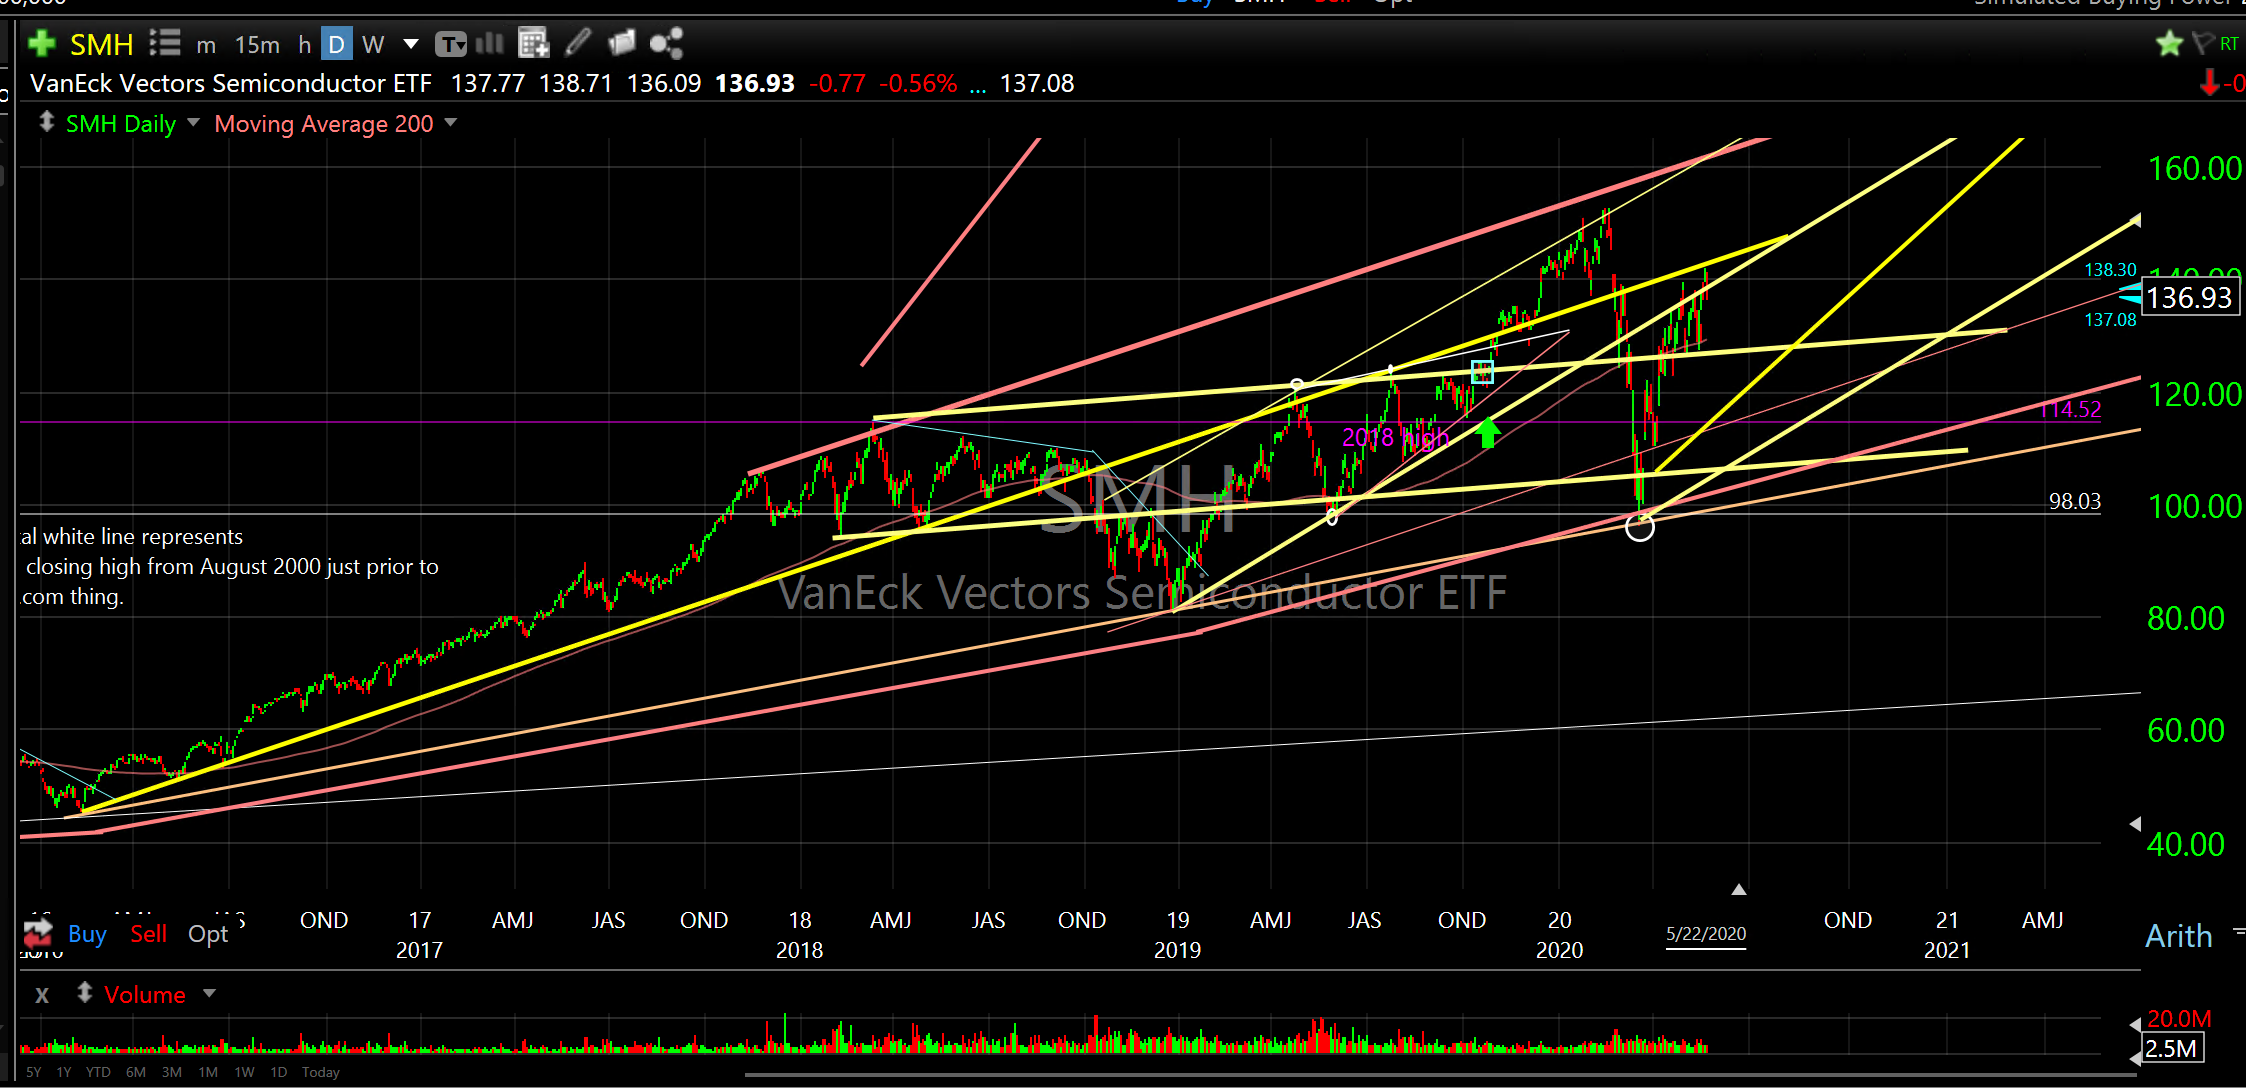
Just look at a couple of charts I shared in “Get Ahead of the Recovery” on March 24th and compare them with the present day charts. Look where I drew in the forecast reversal circles for XLK (tech sector ETF) and SMH (semiconductor ETF) ..exactly where they ended up bottoming and reversing higher. Boom! I think I dropped the mic.
SPDR’s Select Sector Technology ETF (XLK)..3/24..before
SPDR’s Select Sector Technology ETF (XLK)..5/24/20..after
VanEck Vectors Semiconductor ETF (SMH)..3/24/20..before
VanEck Vectors Semiconductor ETF (SMH)..5/24/20..after
Back to present day. Well, that was the bottom and it certainly was low risk/high reward and it did provide historic compelling levels that have produced massive returns upwards of 100% in less than 60 days. It is highly unlikely, in my humble opinion, we will be revisiting that March 23rd low any time soon.
It’s now two months later and it’s deja vu time; time for another fake out. A secondary collapse is still expected by most participants. After a surge off the bottom and stalling for the past few weeks at such strong resistance levels everyone is expecting another big dip soon. Note: I’ve been expecting it too but now I’m not so sure.
Maybe we should look at what would be the least obvious move to most and the one that would catch most investors off guard again; another surge higher.
That is probably the least expected next move that would inflict the most damage on the most people. Short sellers would get hammered and those on the sidelines waiting for the dip to get in or back in would miss out entirely.
Remember, the market is highly reflective, fractal and repetitious. It’s quite common to see a surge higher off a reversal bottom followed by a consolidation period followed by a similar surge higher finishing the entire process just as it began. This happens all the time on all time frames.
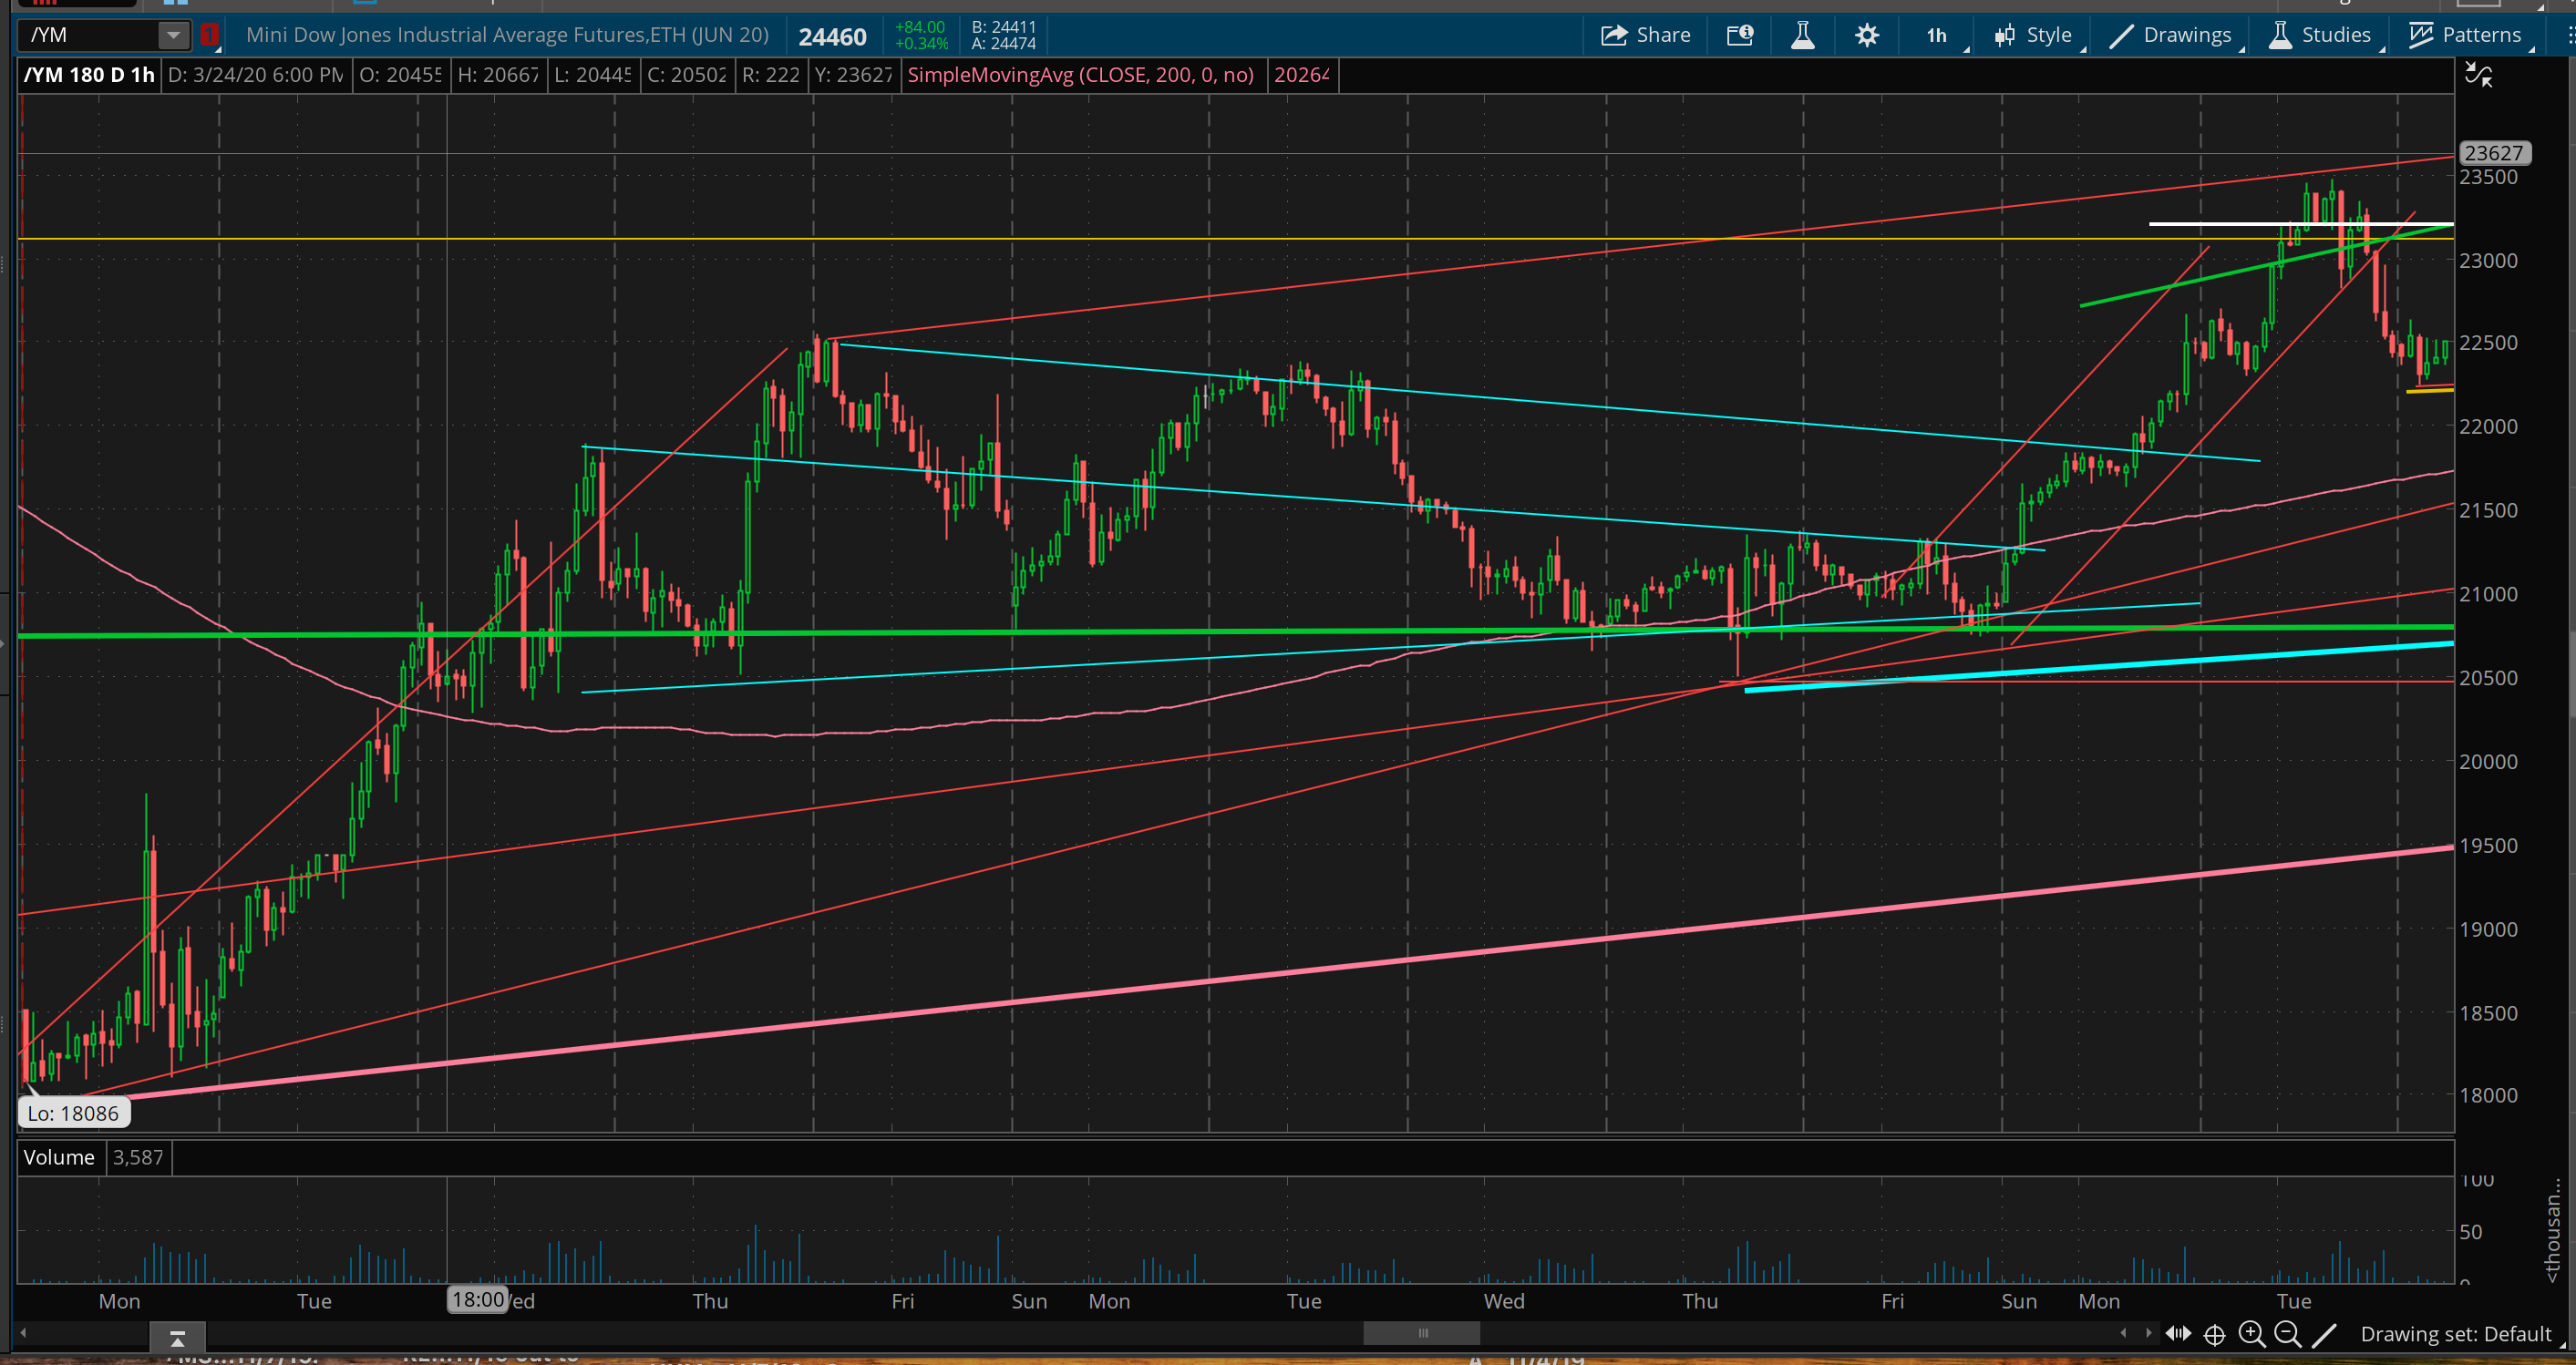
The first chart of the Dow futures (3/23/20 to 4/7/20) shows the initial surge off the March 23rd bottom followed by a consolidation followed by a similar surge higher.
Dow futures (YM) (3/23/20 to 4/7/20)..surge/consolidation/surge
The second chart highlights (shaded box) the fractal surge/consolidation/surge shown in the first chart and how the reflective longer time period surge/consolidation/surge might play out over the next few weeks. See the similarities?
Dow futures (YM).. (3/23/20 to present)
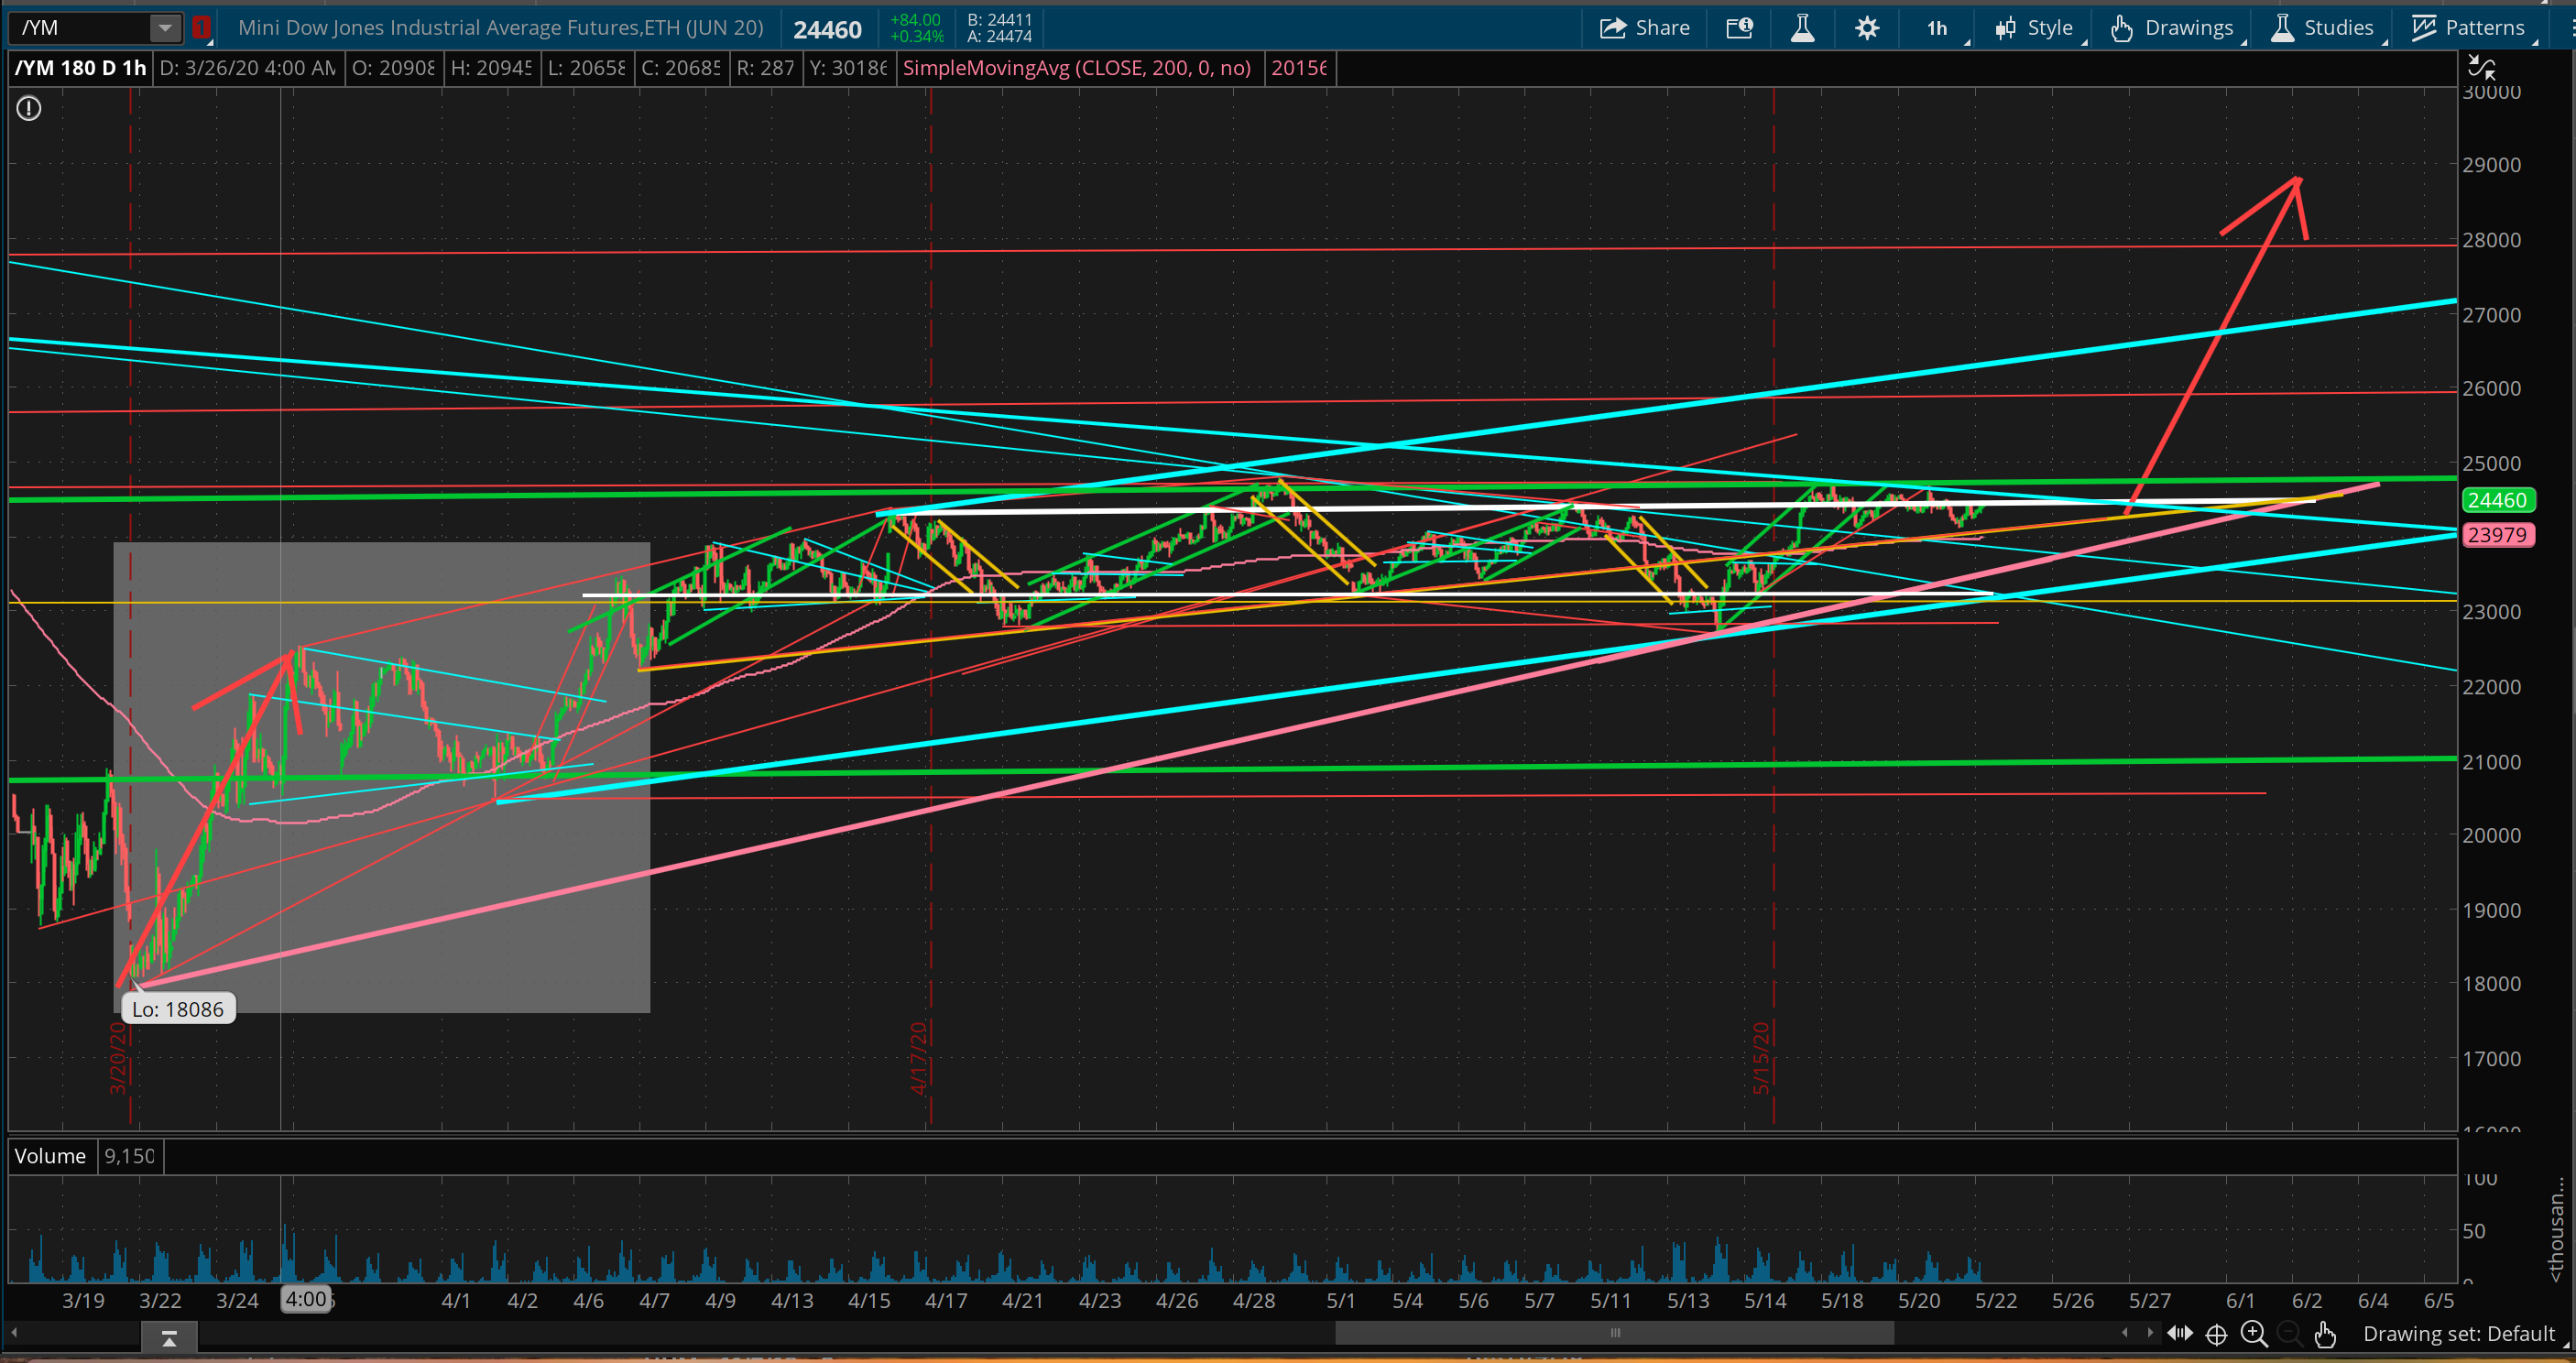
This does not mean this will happen but it must be considered. The broader market is still in neutral territory supported by the ascending pink line and if it can push up through the descending blue line resistance it will likely finish with a repeating surge just like it started. We want to see both the ascending pink and blue lines hold otherwise we will get that secondary collapse.
This would be a good time to hedge with a broader market inverse instrument (SH, SDOW, SQQQ) that is designed for short term trading/hedging. If the Dow pushes up through resistance you can take the hedge off and ride the next surge higher.
The Chart Room
Let’s look at some charts. The first one has just been a ripper. NVIDIA Corporation (NVDA), which I put on the Entry list again on 4/19/19 and is up about 100% since, is truly a rockstar. Look at the repetition in the price pattern. I drew this chart in April of 2019, over a year ago, and I haven’t touched it since. Look how price action has followed my projection on up to the third peak.
NVIDIA Corporation (NVDA)..comp
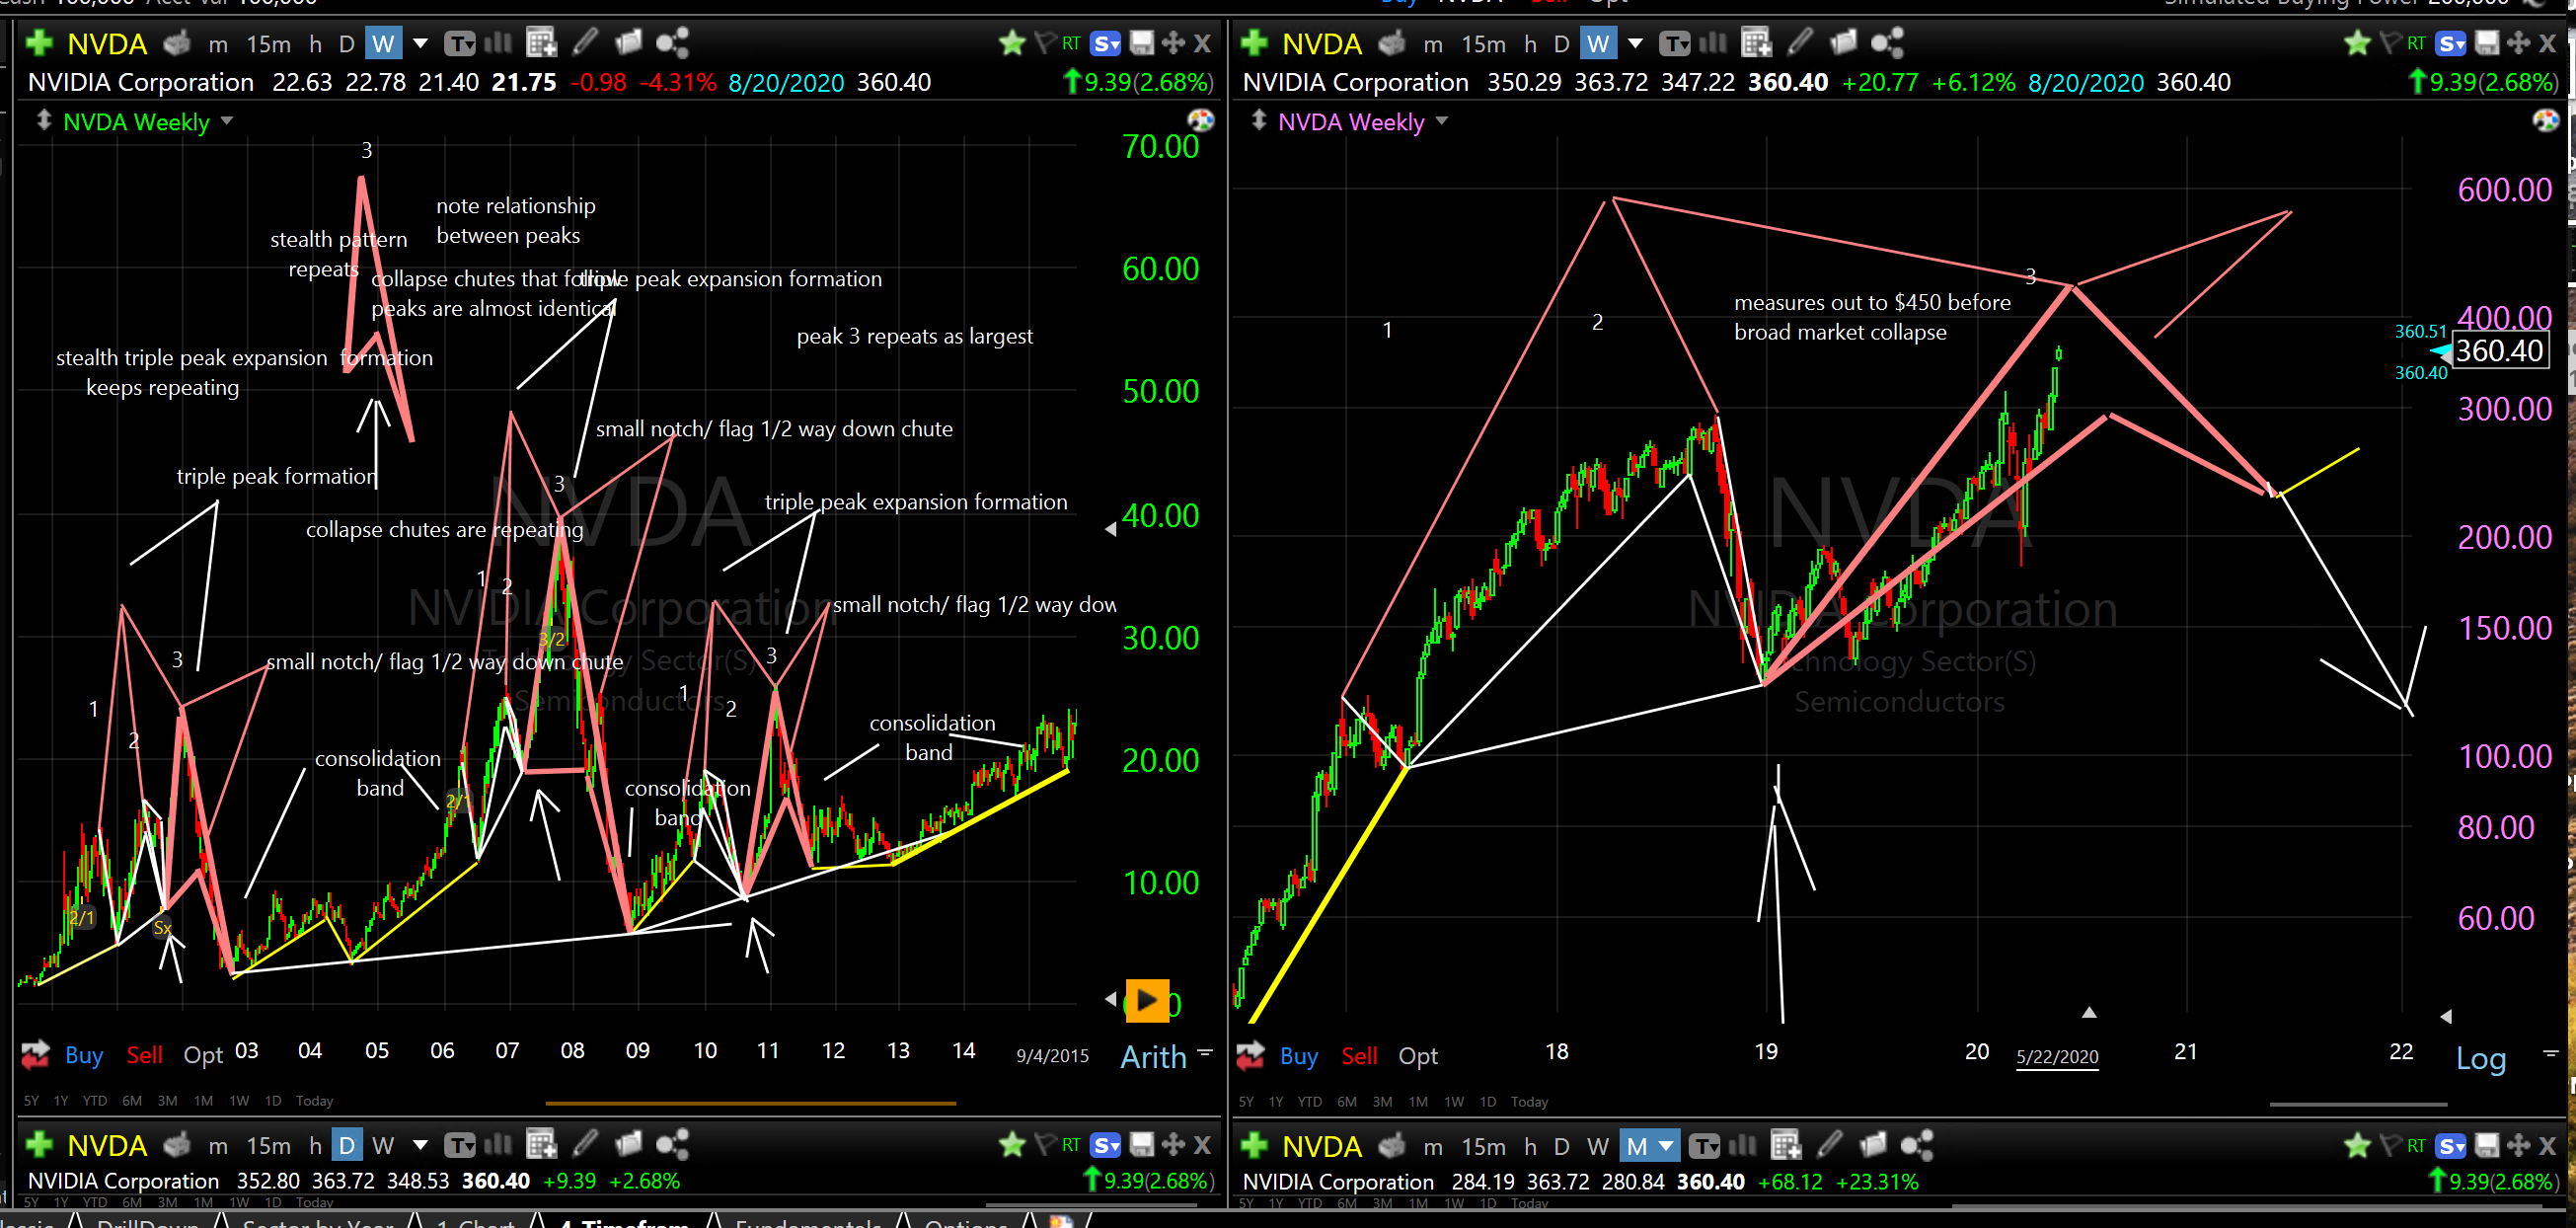
Now look at the chart that shows the larger scale of the pattern. Look close and you can see the 3 peak pattern repeating not only on the smaller time frames but also on the larger time frame that covers over 10 years of price action.
NVIDIA Corporation (NVDA)..fractal repetition
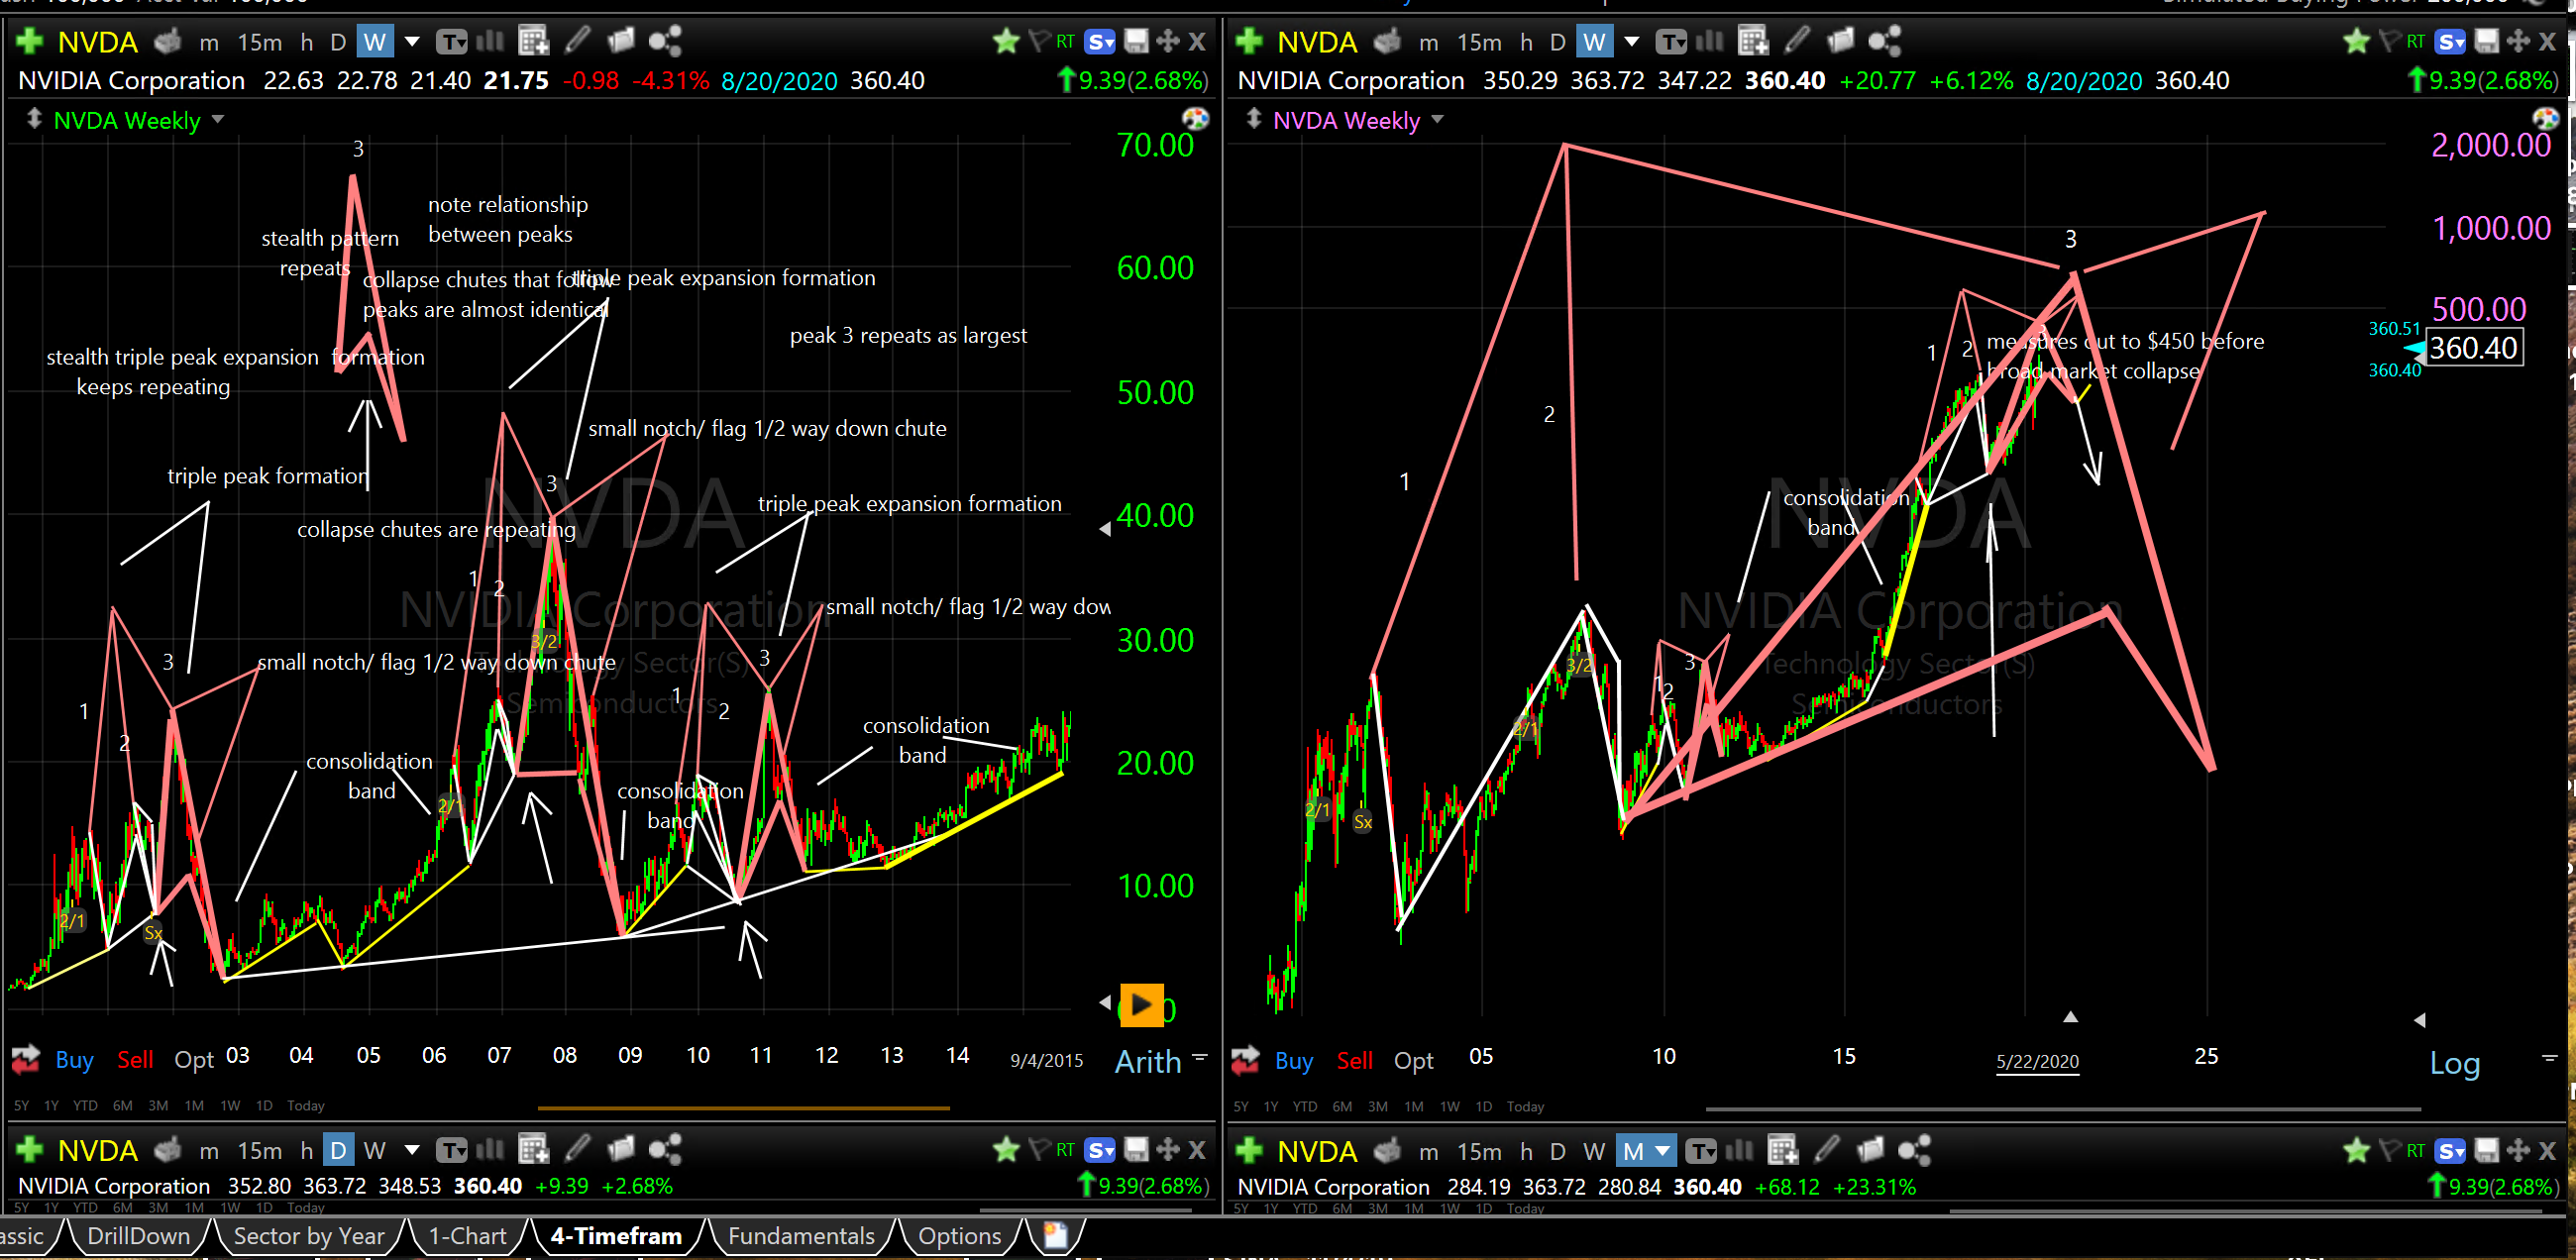
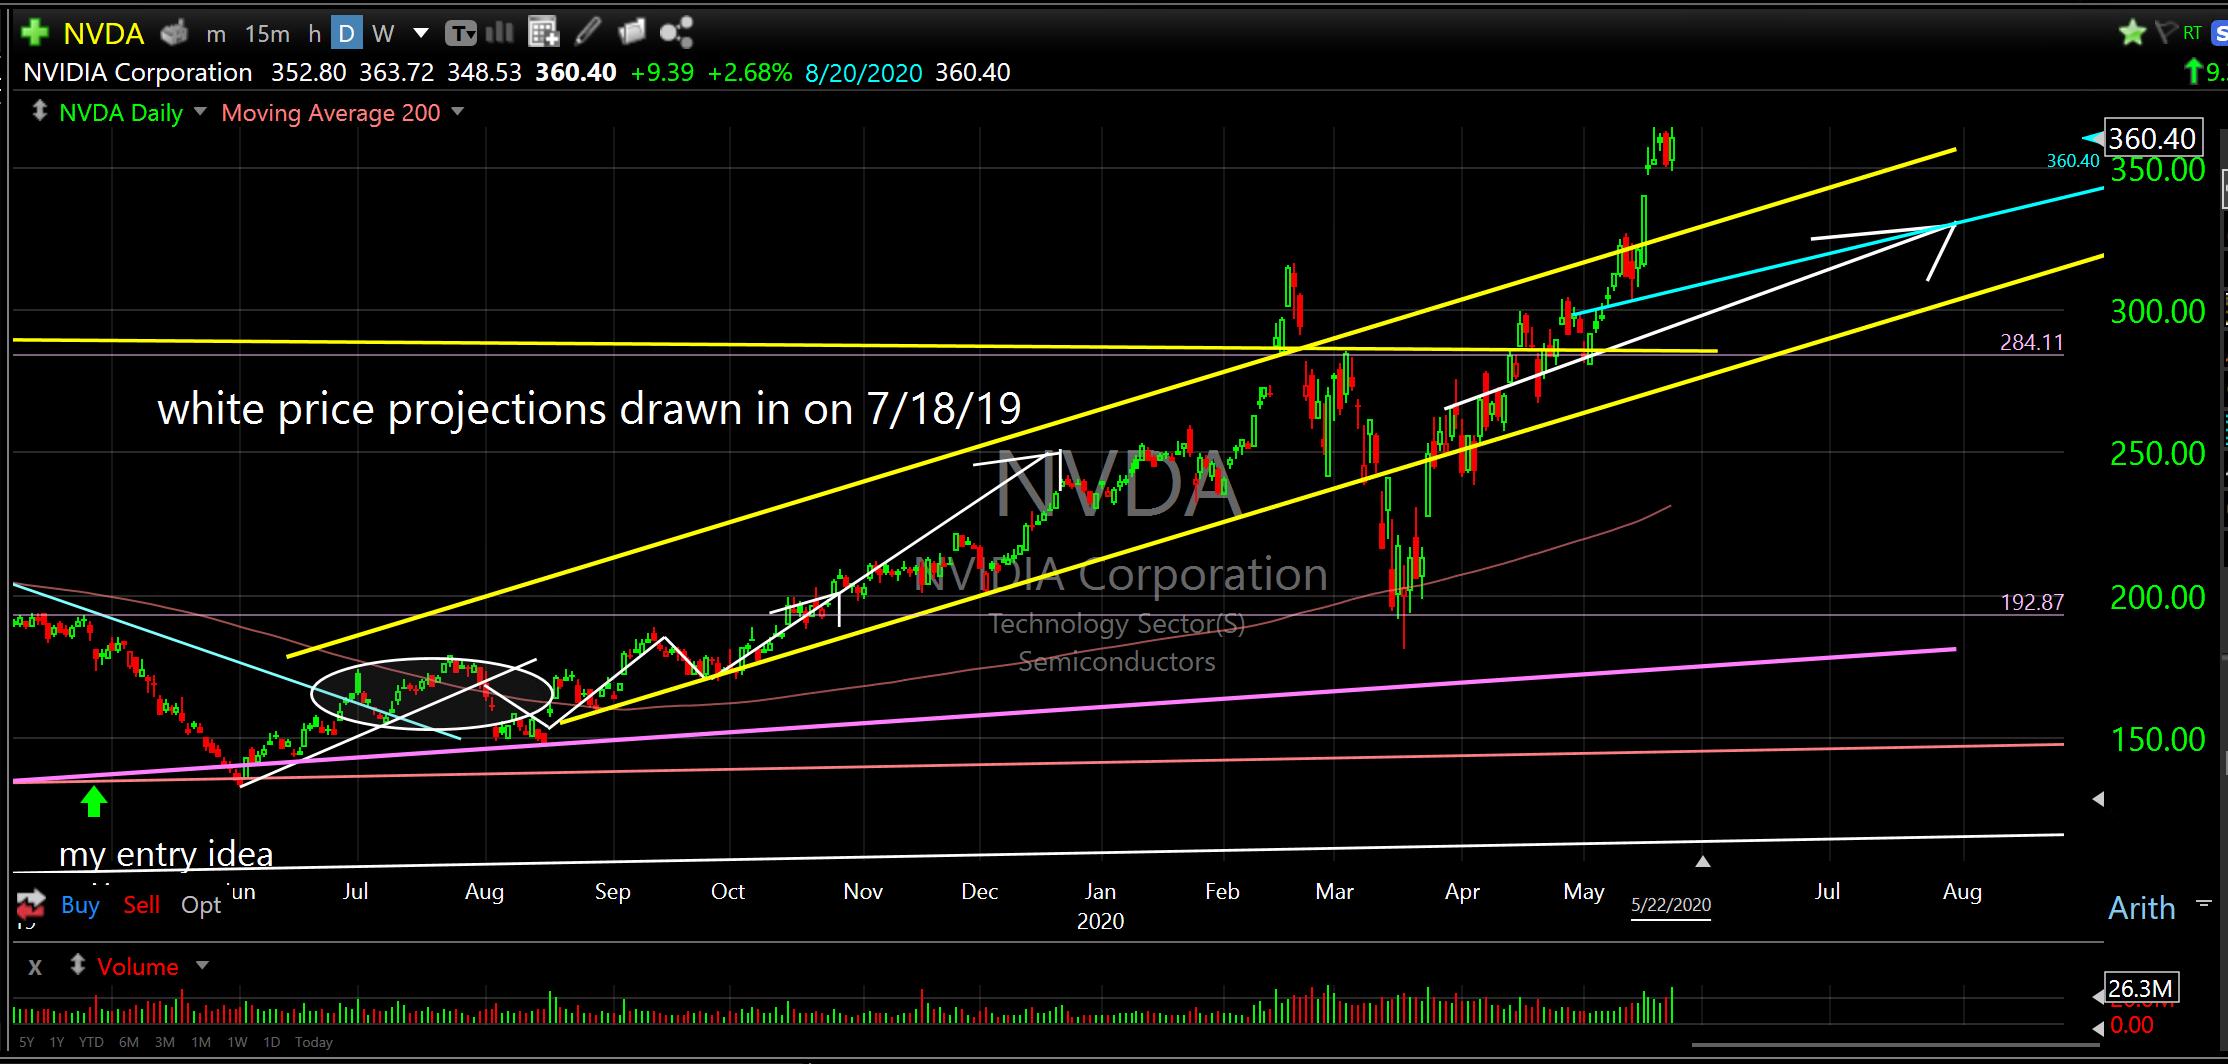
Now look at a more recent forecast. I drew in the white line projections months before the price action actually occurred. Look at how accurate it was with the exact reversals and trajectories. If this doesn’t blow your mind it should. The takeaway should be, despite what the “so-called” experts tell you, the market is not random. In fact, it’s so far removed from random that it is possible to forecast exactly what will happen in the future.
NVIDIA Corporation (NVDA)..price projection 7/18/19
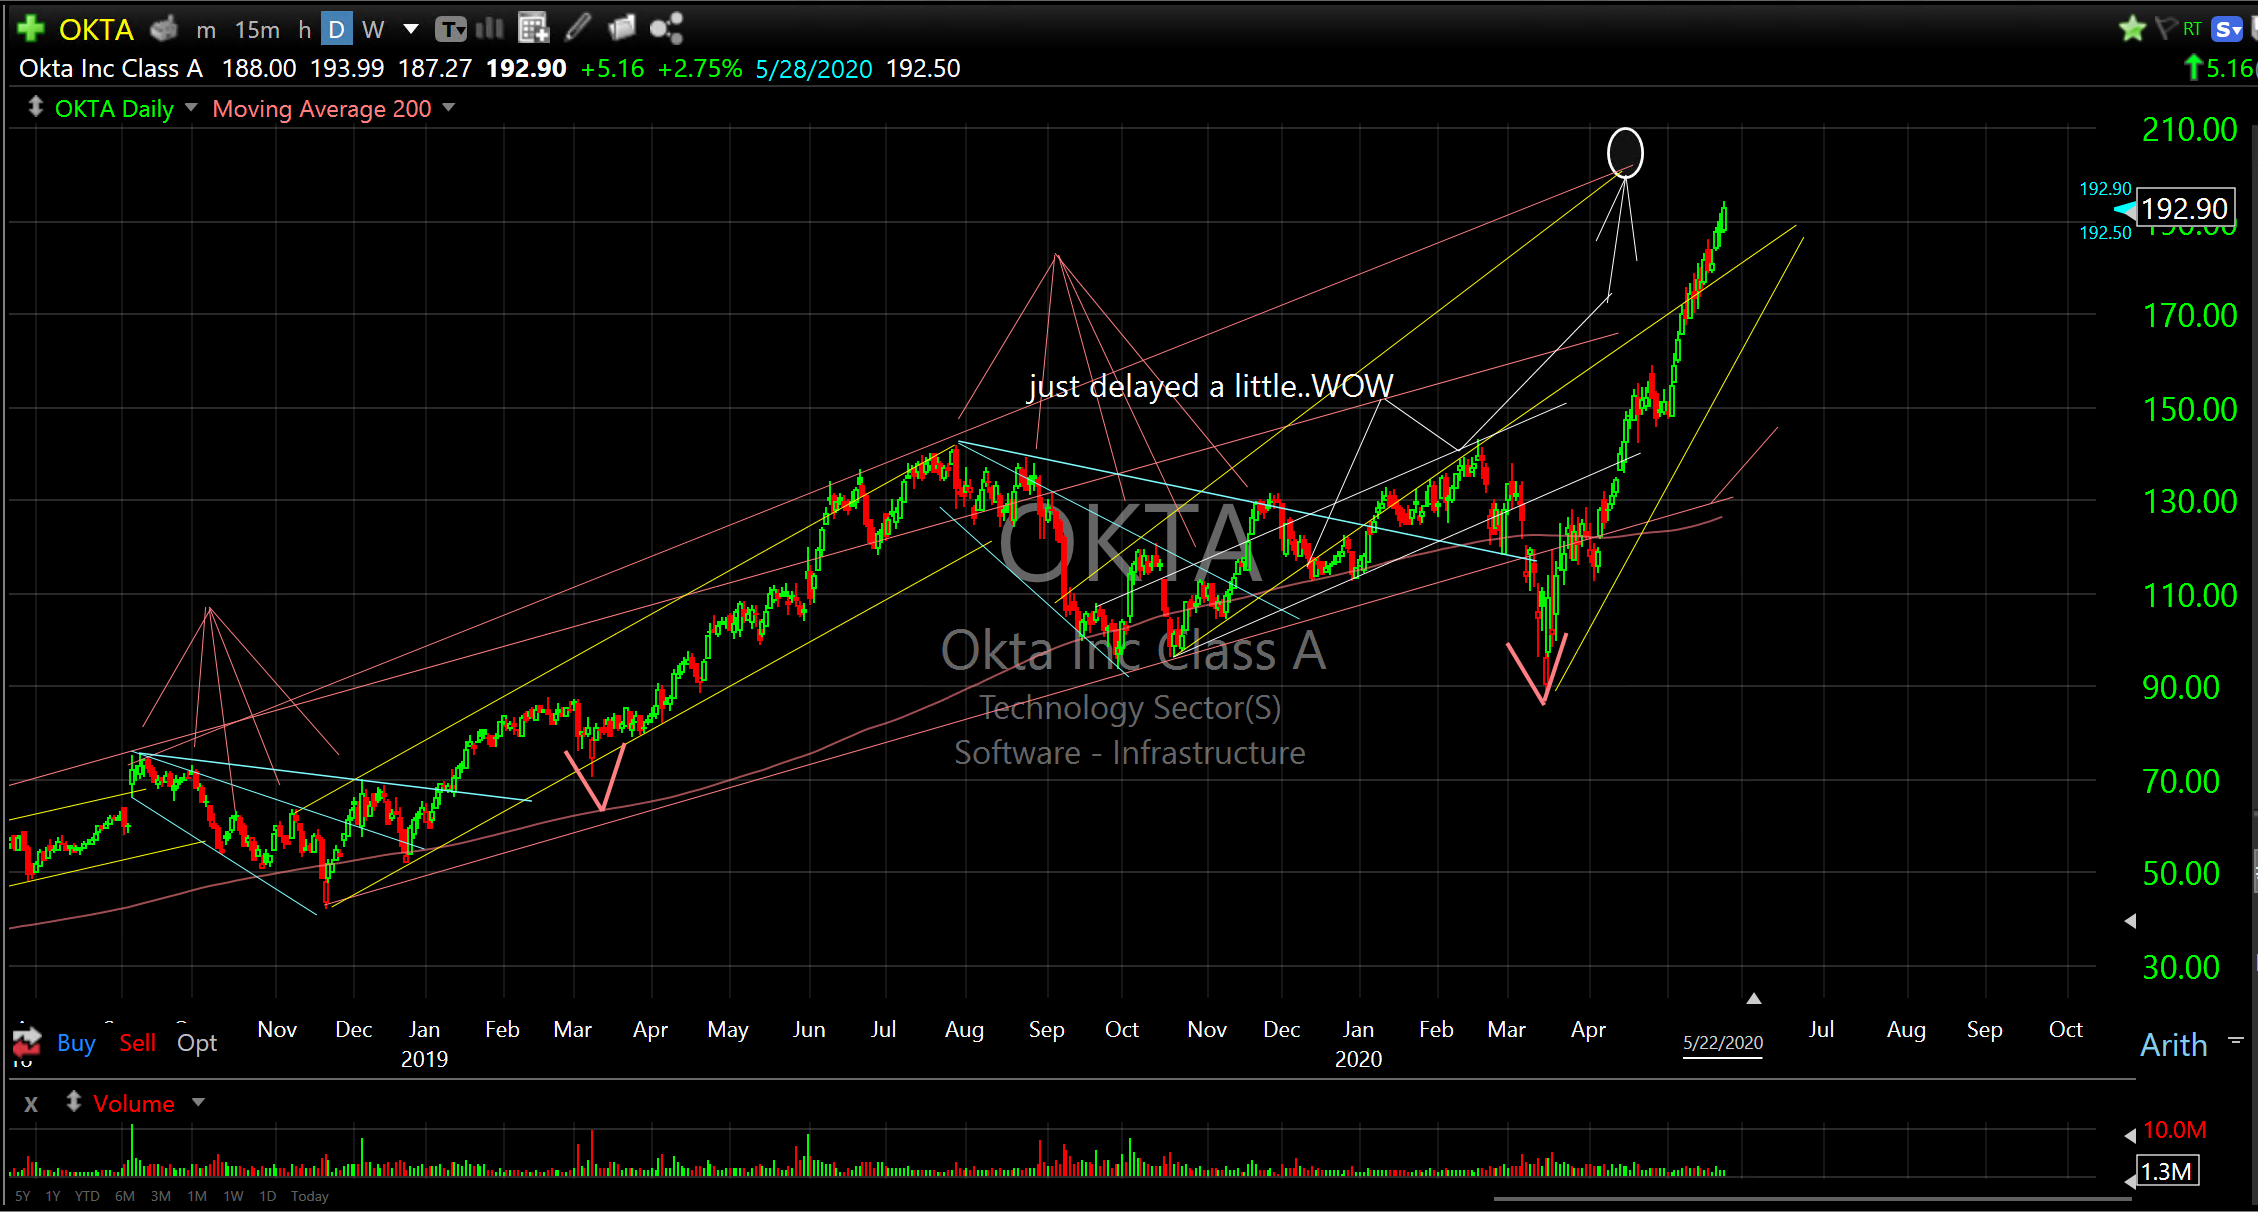
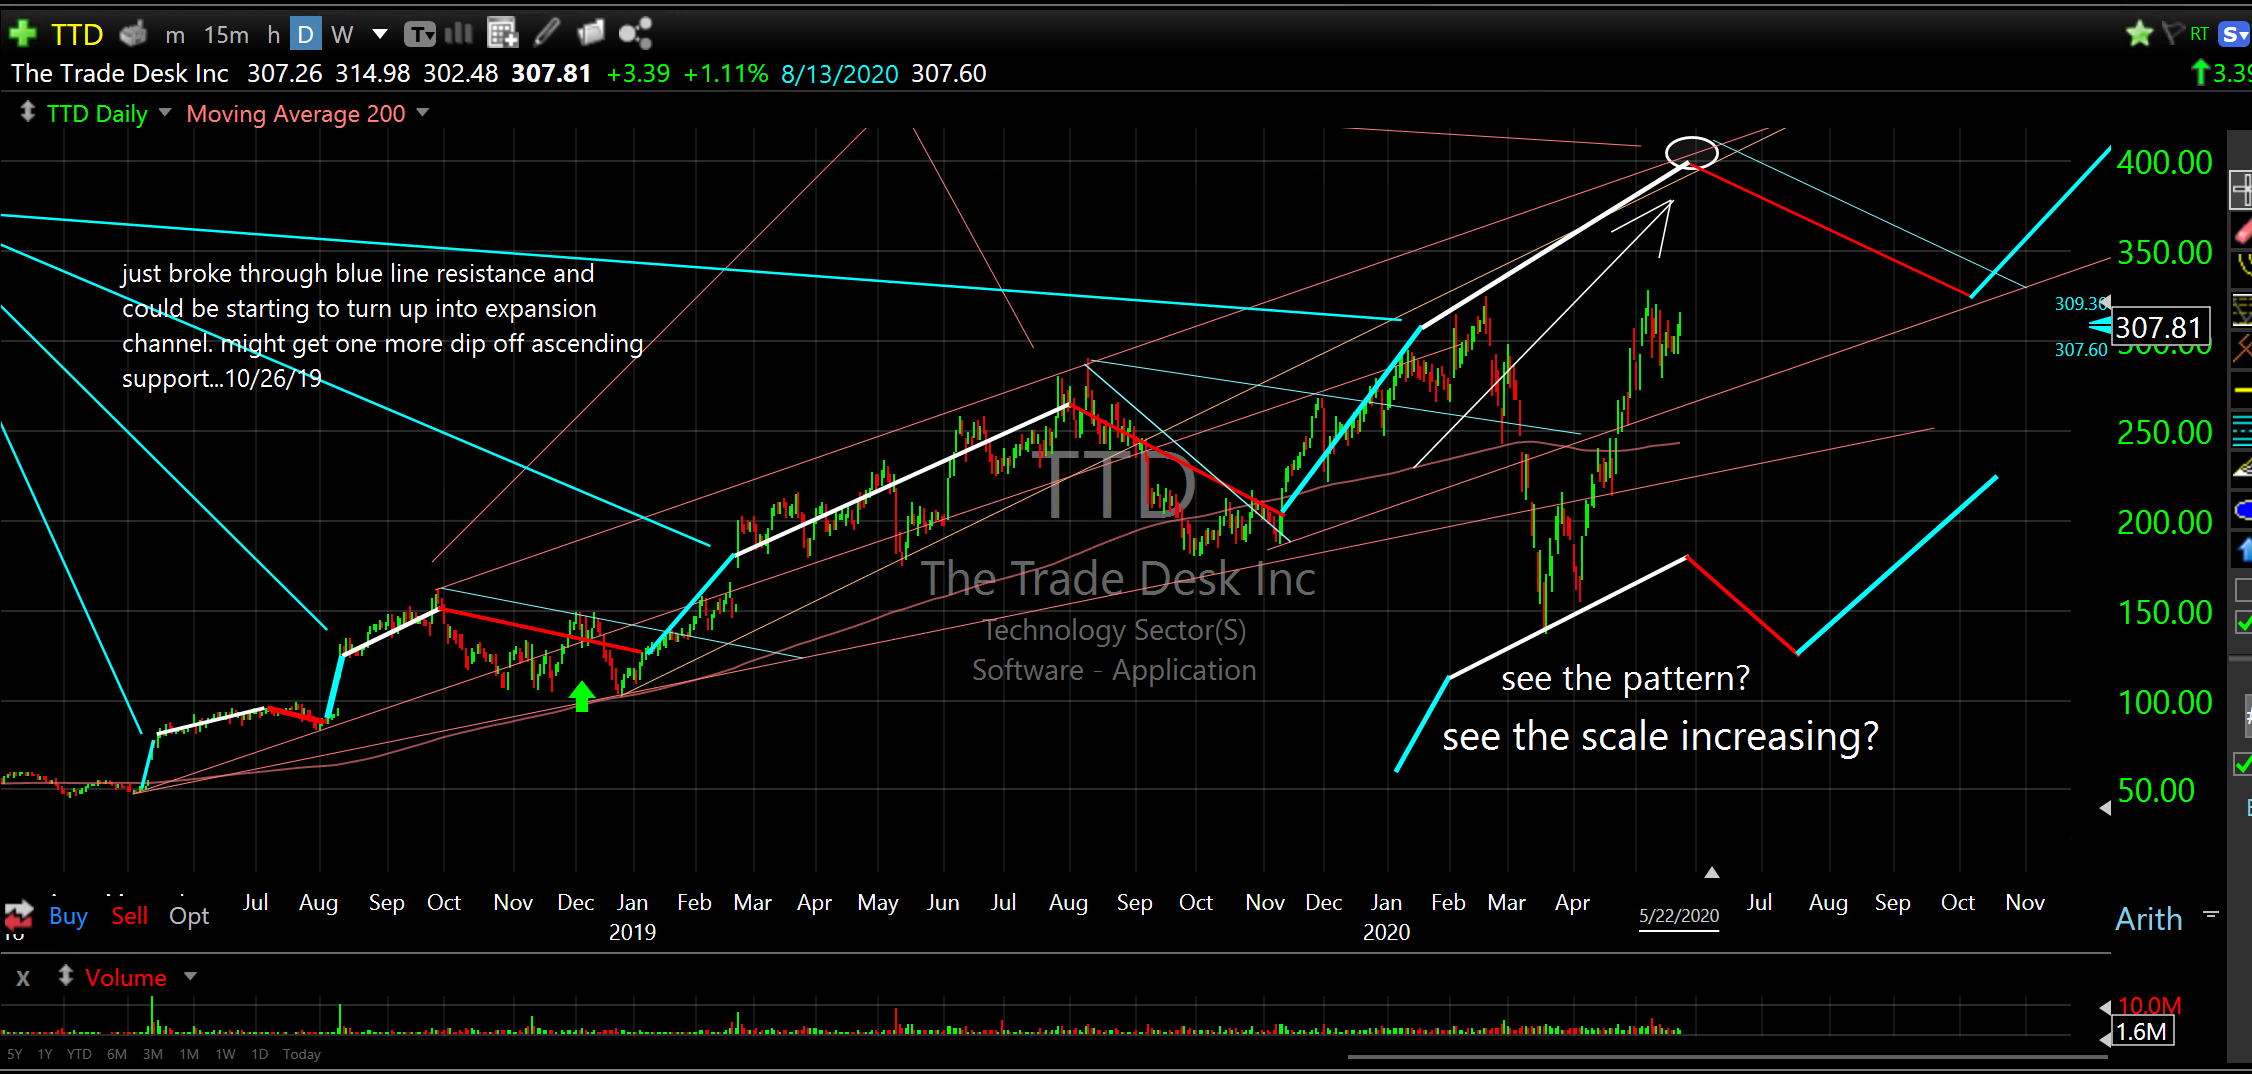
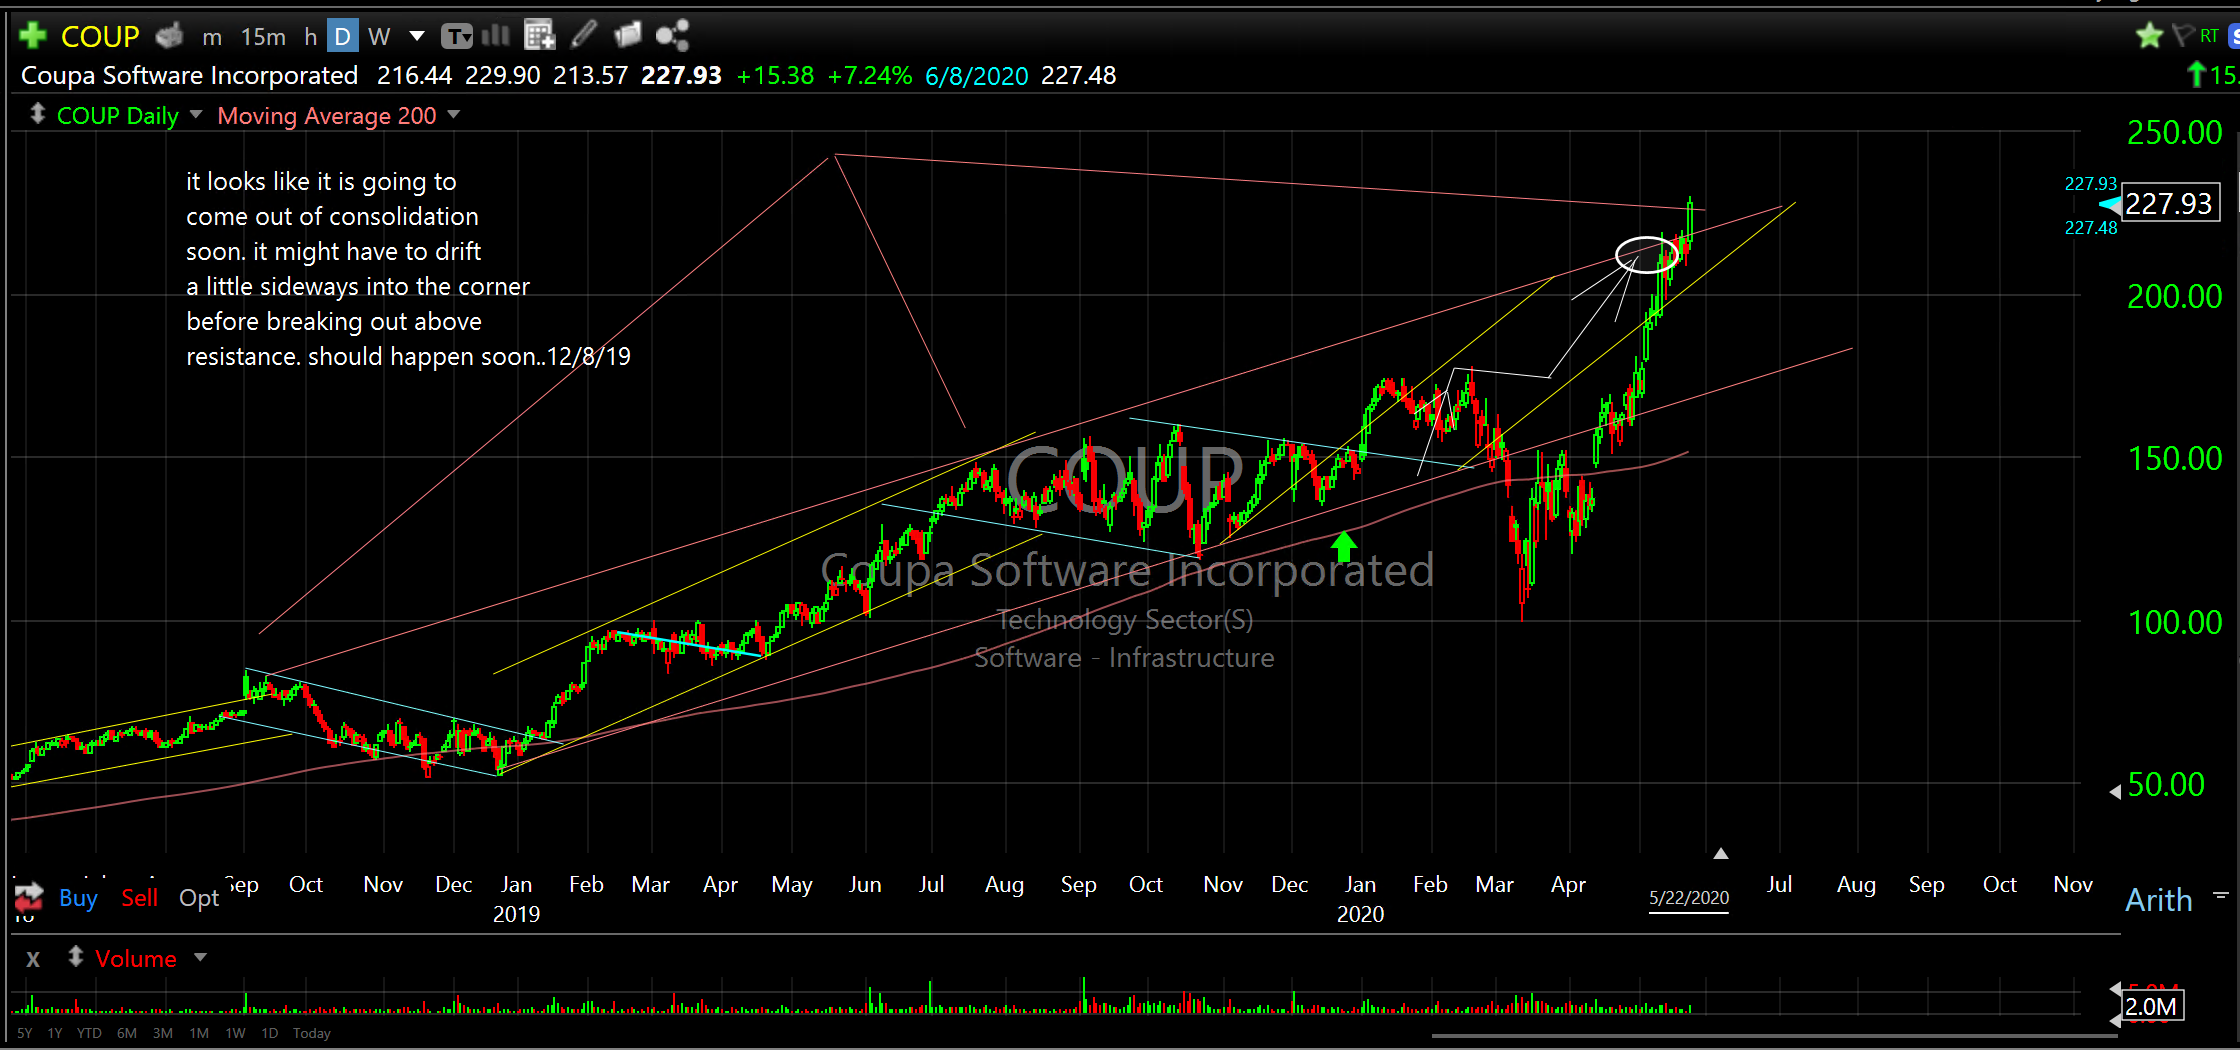
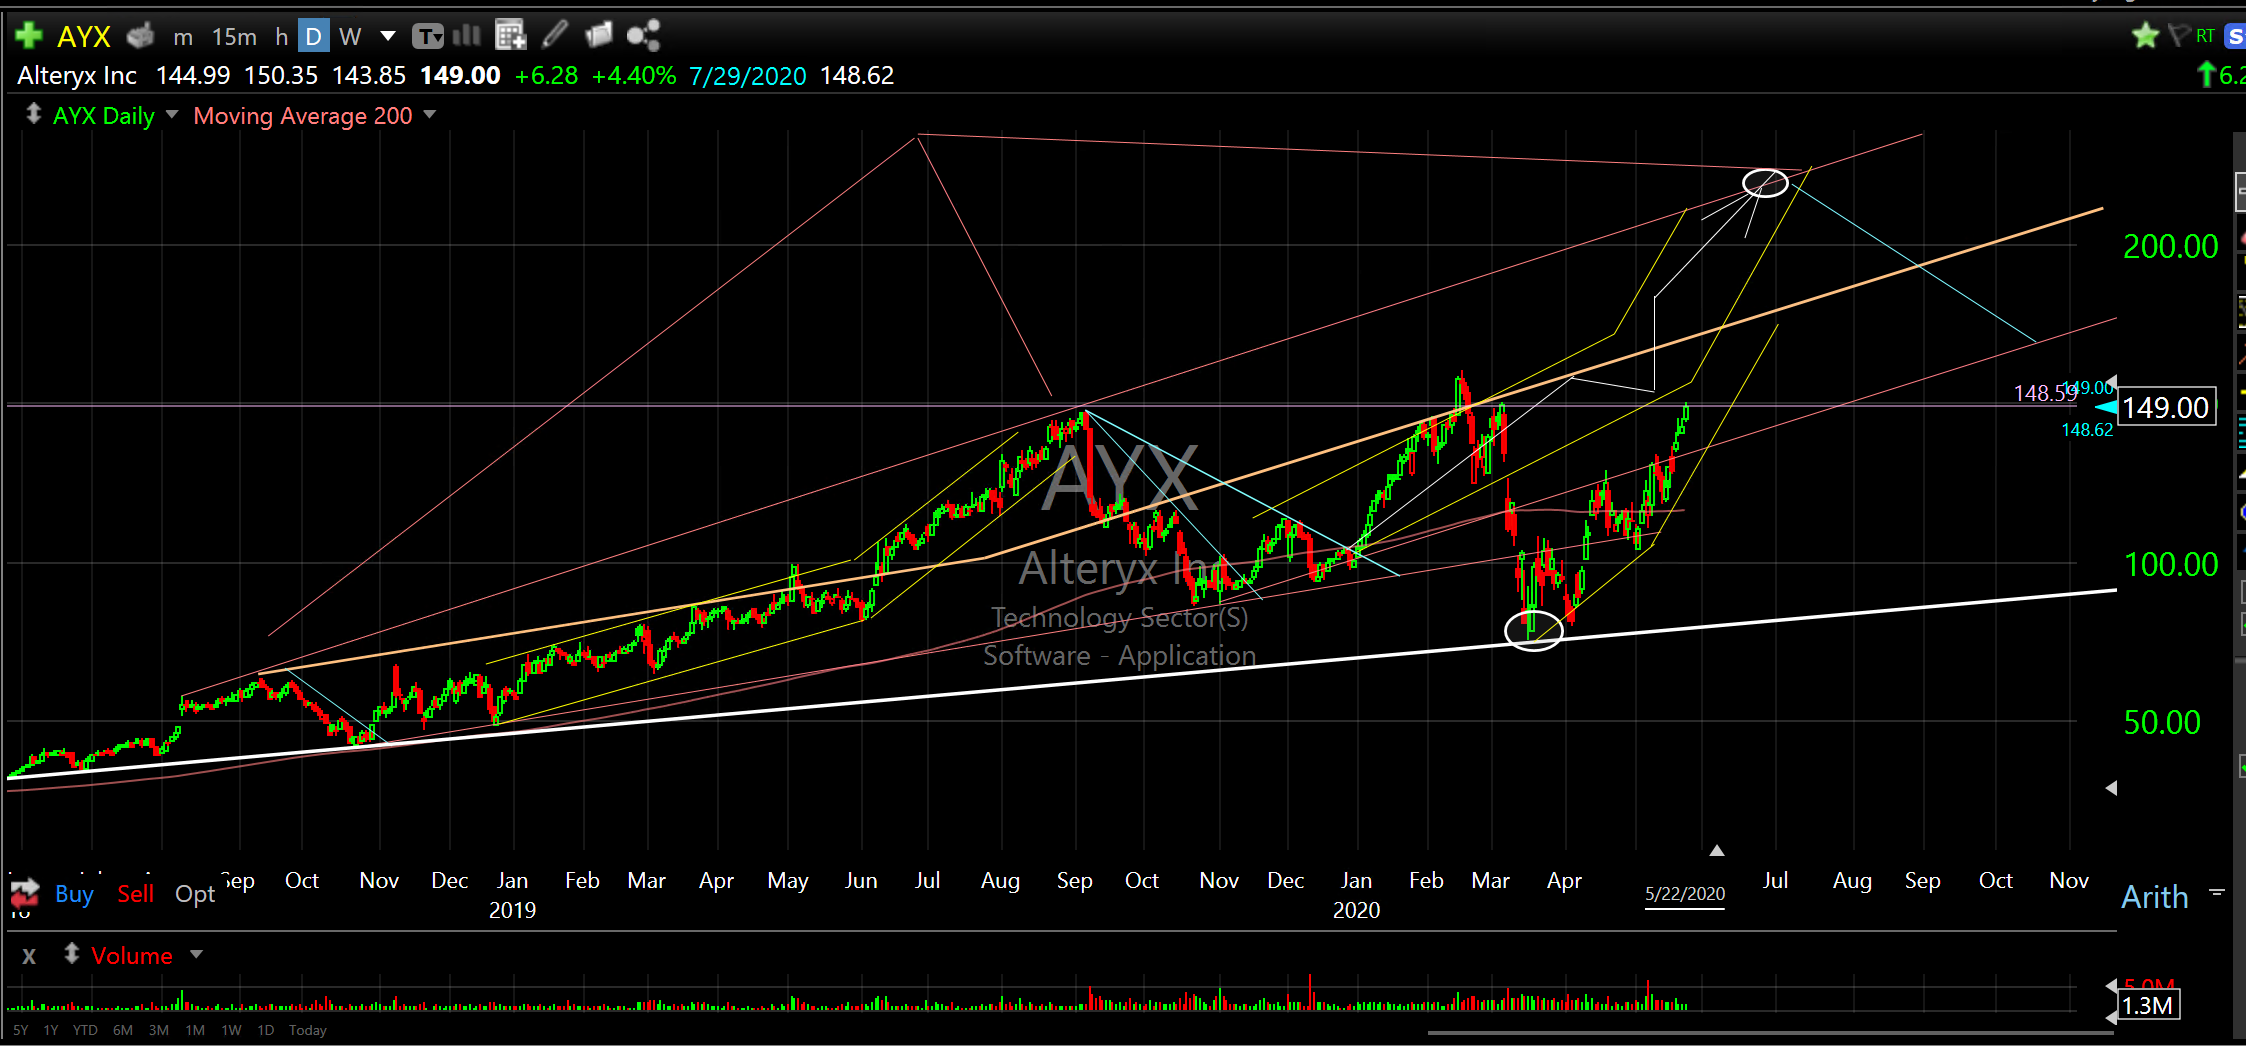
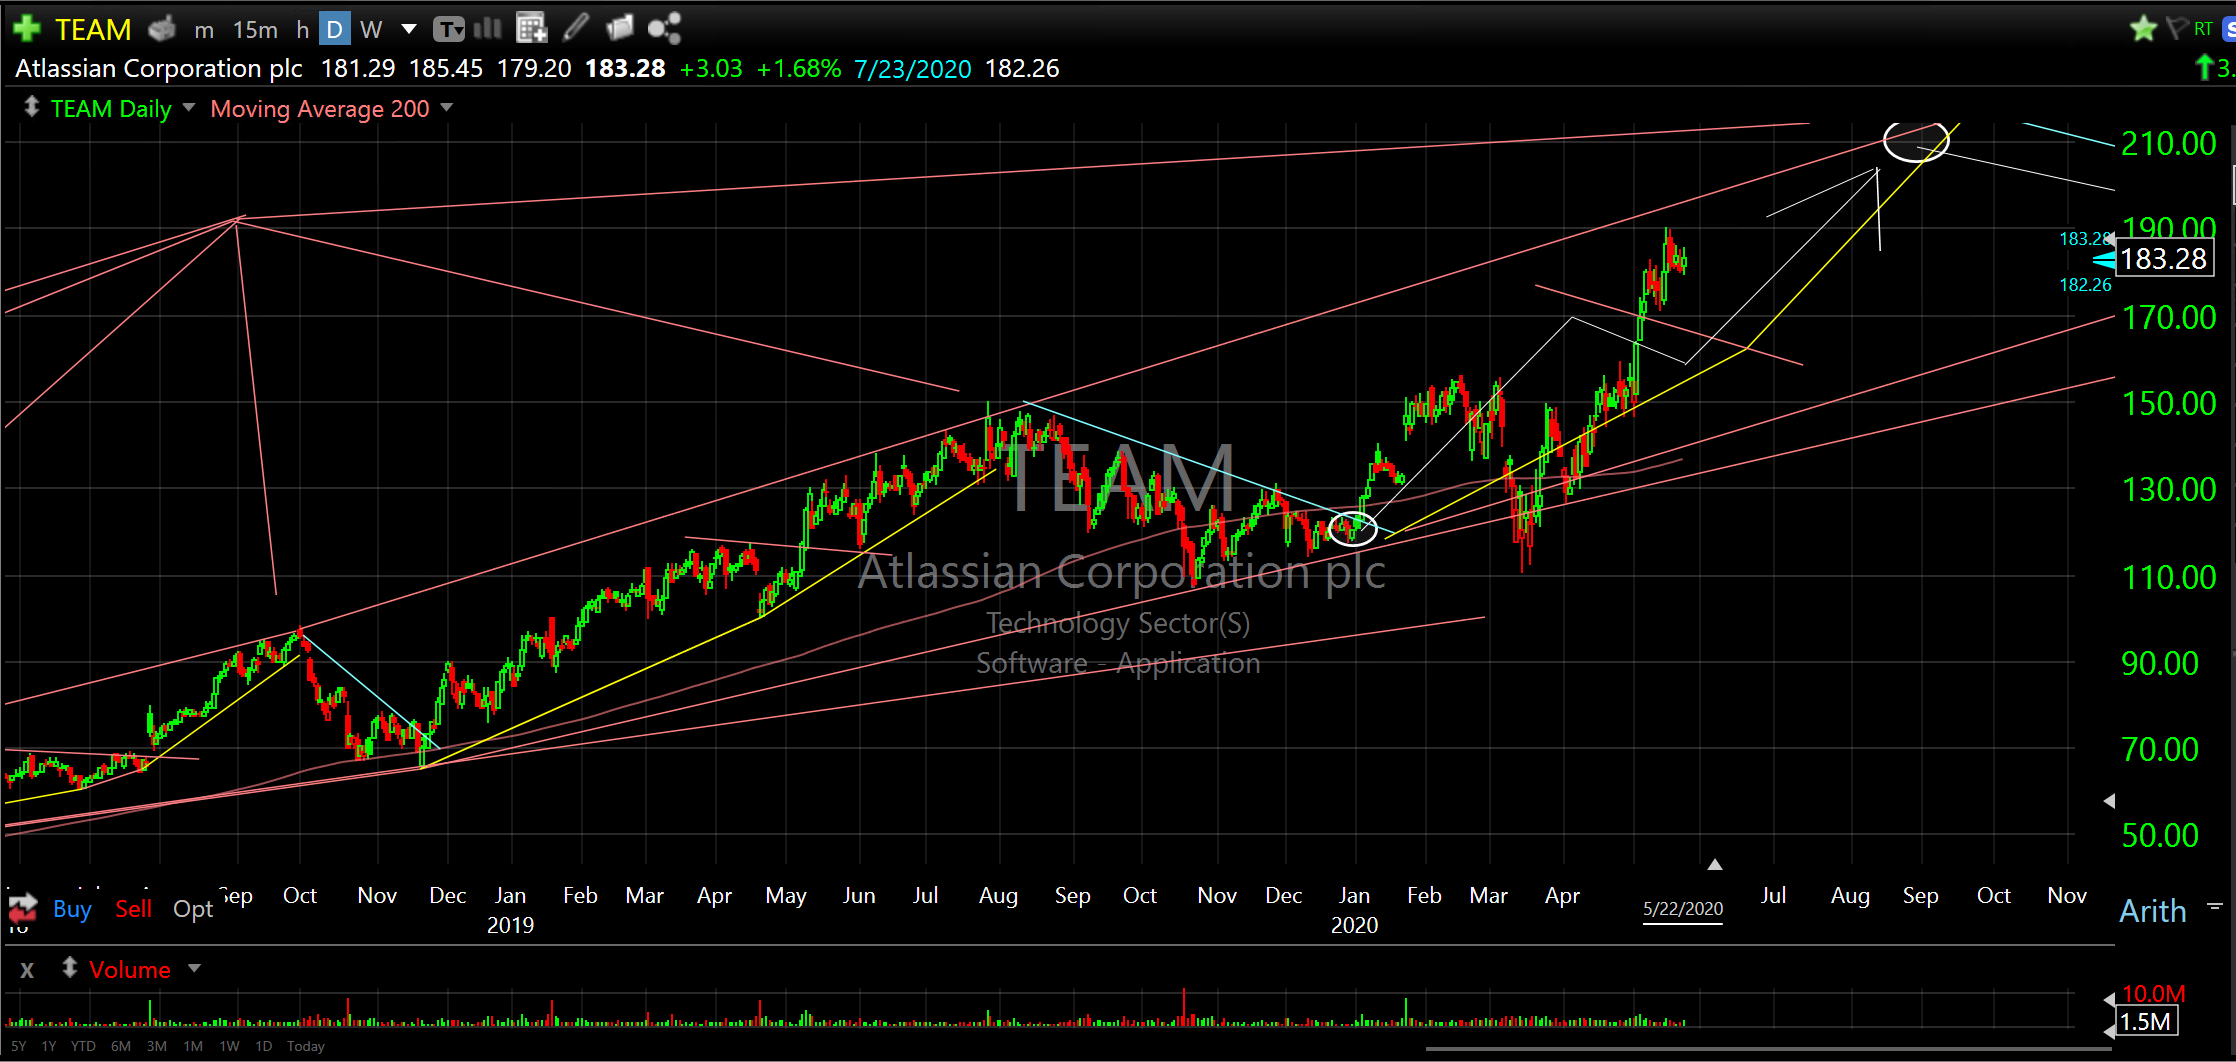
You know, if you’ve been reading my commentary for a while, that my favorite technology subsector has been software infrastructure/application. Look at how well the following companies I wrote about a few months ago have performed and recovered from the Corona Crash. Rockstars! And these are just a handful of examples. Consider some of these on broader market dips over the next few months.
Okta Inc Cl A (OKTA)
The Trade Desk Inc (TTD)
Coupa Software Incorporated (COUP)
Alteryx Inc (AYX)
Atlassian Corporation plc (TEAM)
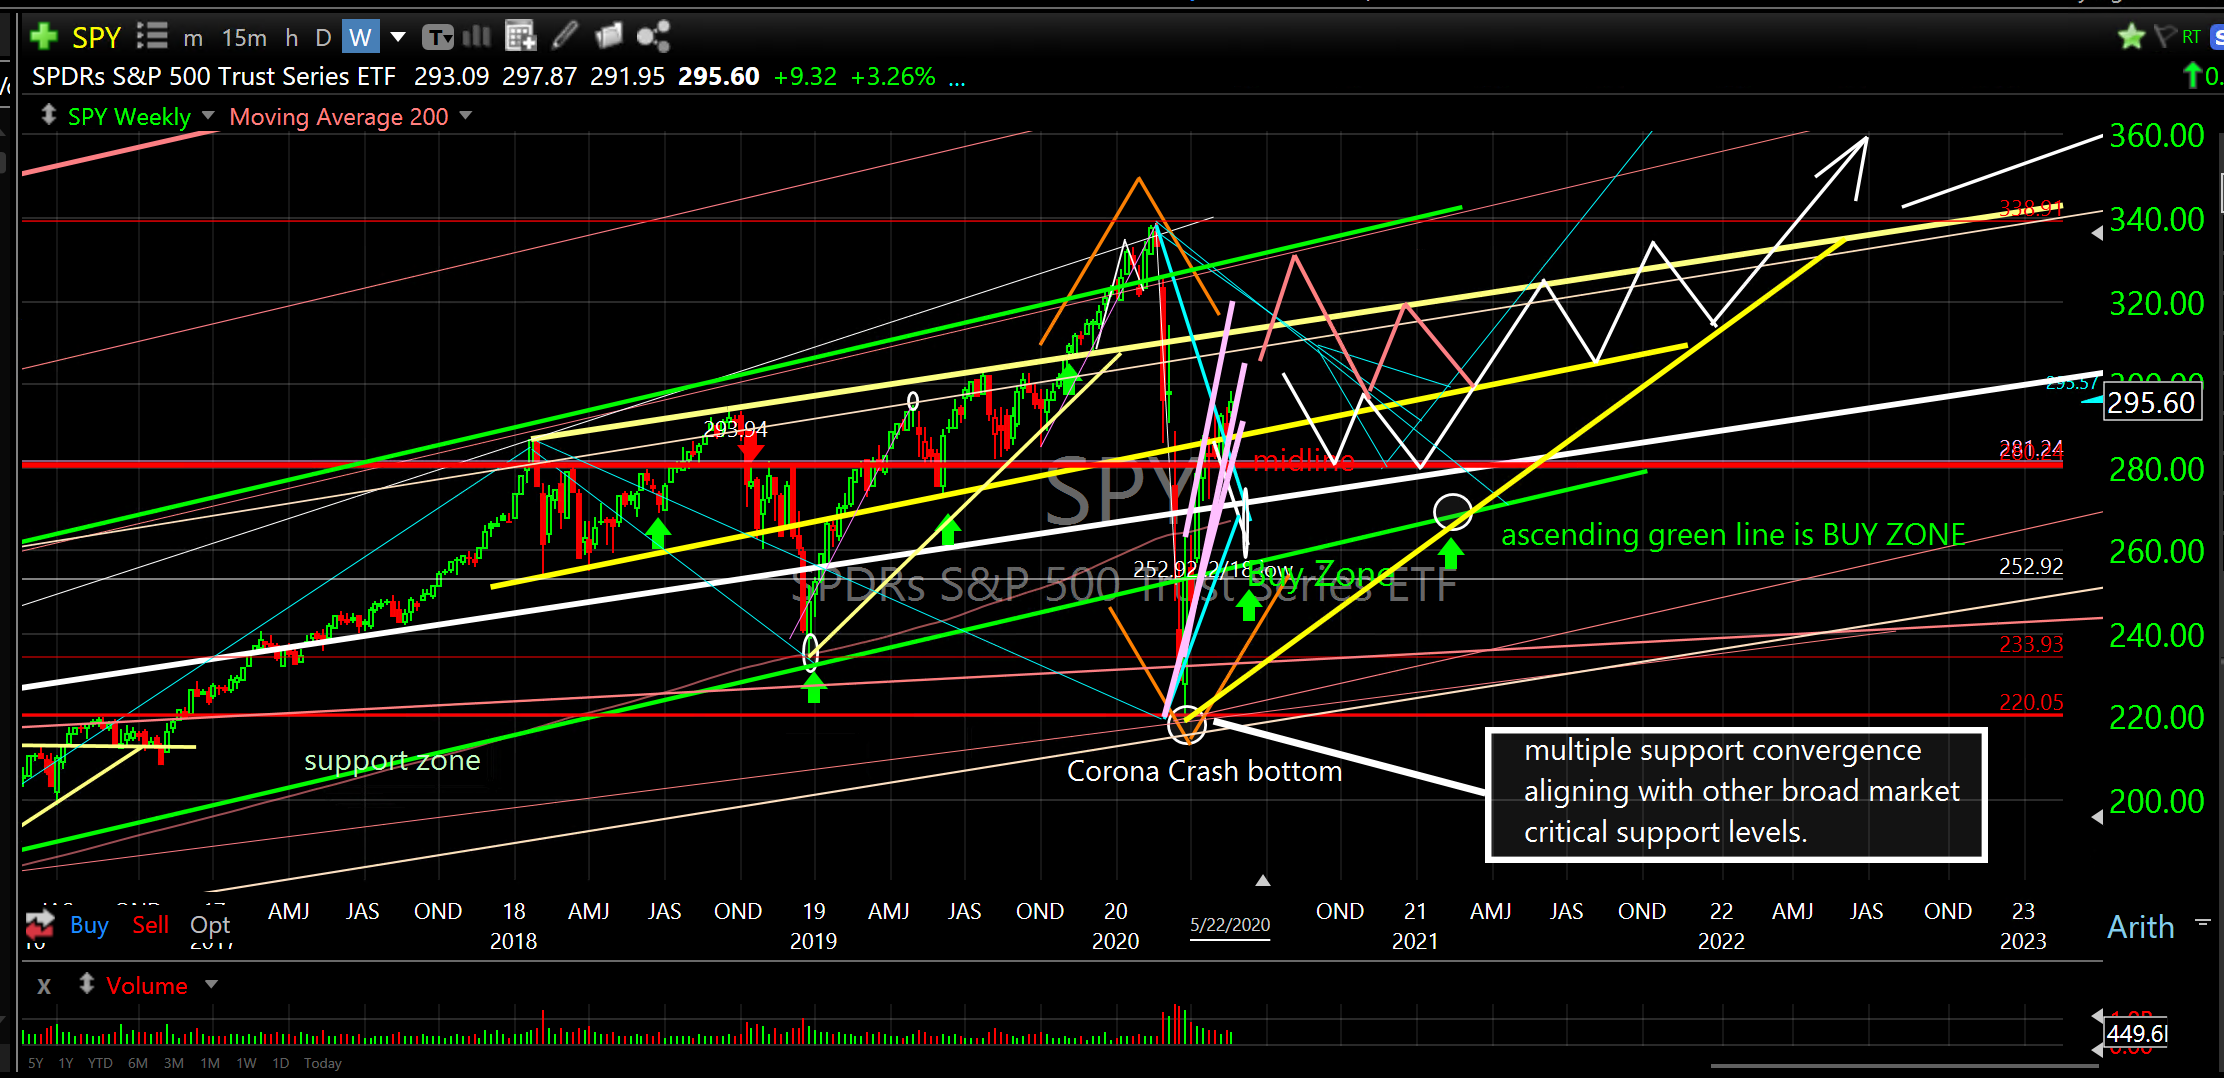
The broader market is still trading sideways in neutral territory and should signal the next short term directional move soon with either a violation of support or a push up and through resistance. This could happen as soon as this coming week. Longer term into the end of the year or beginning of 2021 I expect an overbought surge higher to reflect the extreme oversold condition we experienced with the Corona Crash. So, look for multiple opportunities over the summer to buy dips that should result in much higher prices looking out into next year.
SPDR’s S&P 500 Trust Series ETF (SPY) PROJECTION
Stay safe and watch out for those head fakes, elasticos and diagonal cruyffs.
Don