Hello again,
Broader Market Review
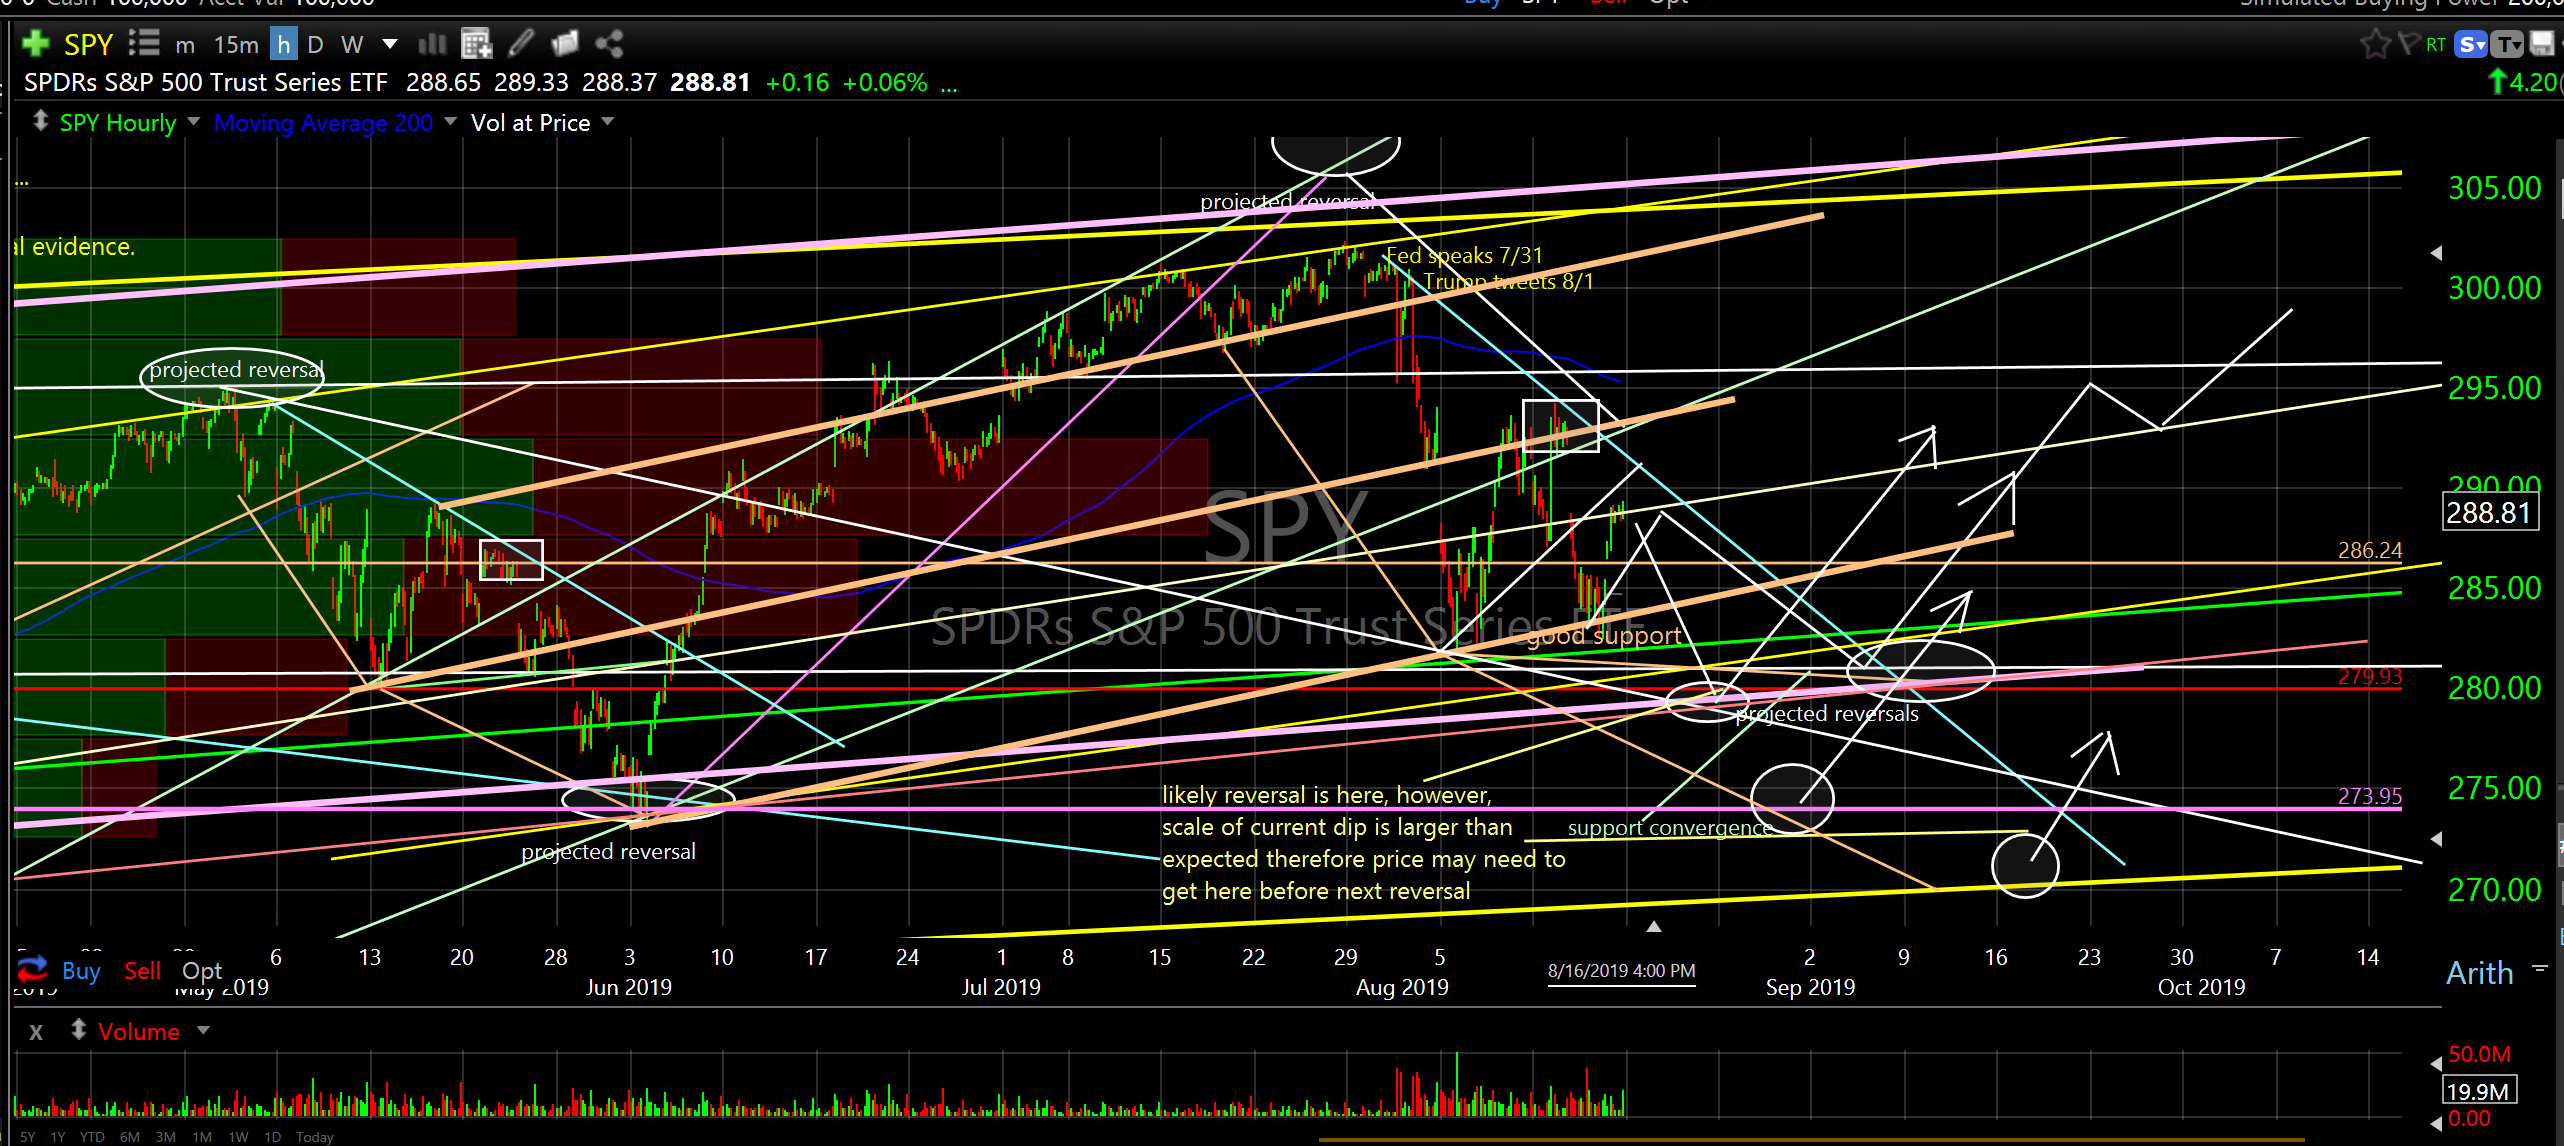
We are right smack dab in the middle of the summer dip I projected many weeks ago (before it began), however, it’s playing out a little quicker and deeper than I first measured. Due to the increased speed, higher volatility and larger scale of the move there is a greater chance the next major reversal (higher) will occur from a lower price level than I originally measured.
While I still think the broader market will continue to expand into 2020 I don’t think this summer dip is over. We should get one more “super dip” with possibly a couple of big gap down mornings and then be done with it. It’s difficult to say how deep it will go but I think the next major reversal higher is still on schedule for early September. Please refer to the hourly chart of SPY to see my reversal projections and notes. BTW, the hourly chart shows more detailed price action.
SPDR’s S&P 500 Trust Series ETF (SPY) hourly
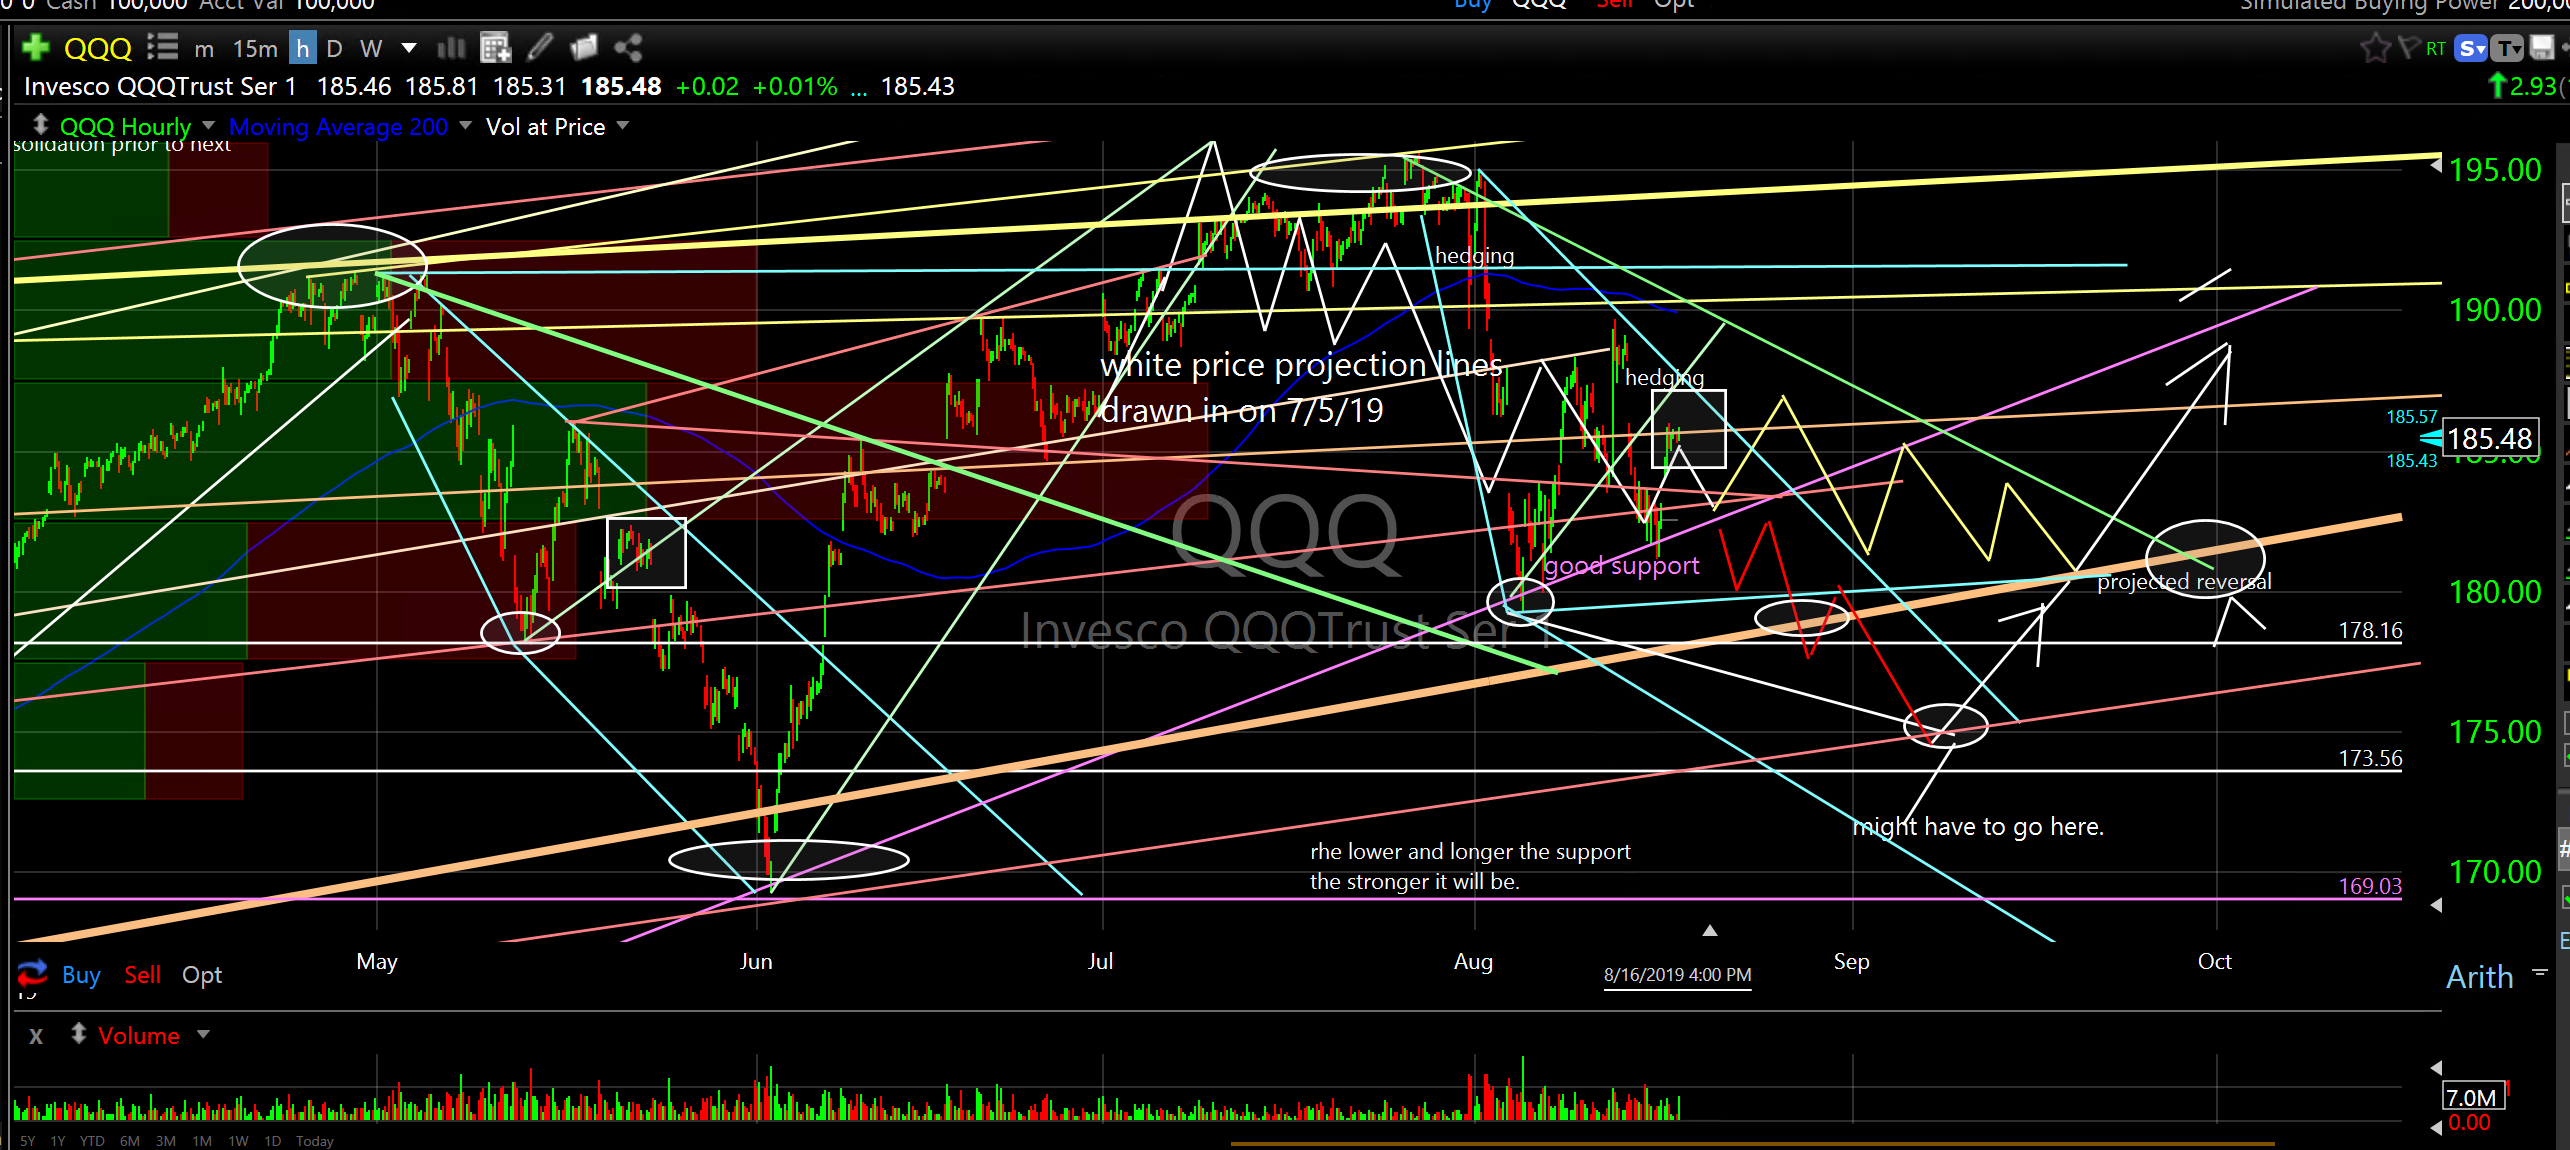
The QQQ’s might need to get lower as well due to the scale of the current dip. Please study the white price projection lines I drew in on July 5th. Yes, they are extremely accurate…but…note the scale of the move relative to my projection track. The collapse on Monday, August 5th was deeper than I projected so price may still need to go deeper if there is another leg down, which I expect.
Invesco QQQTrust Ser 1 (QQQ) hourly
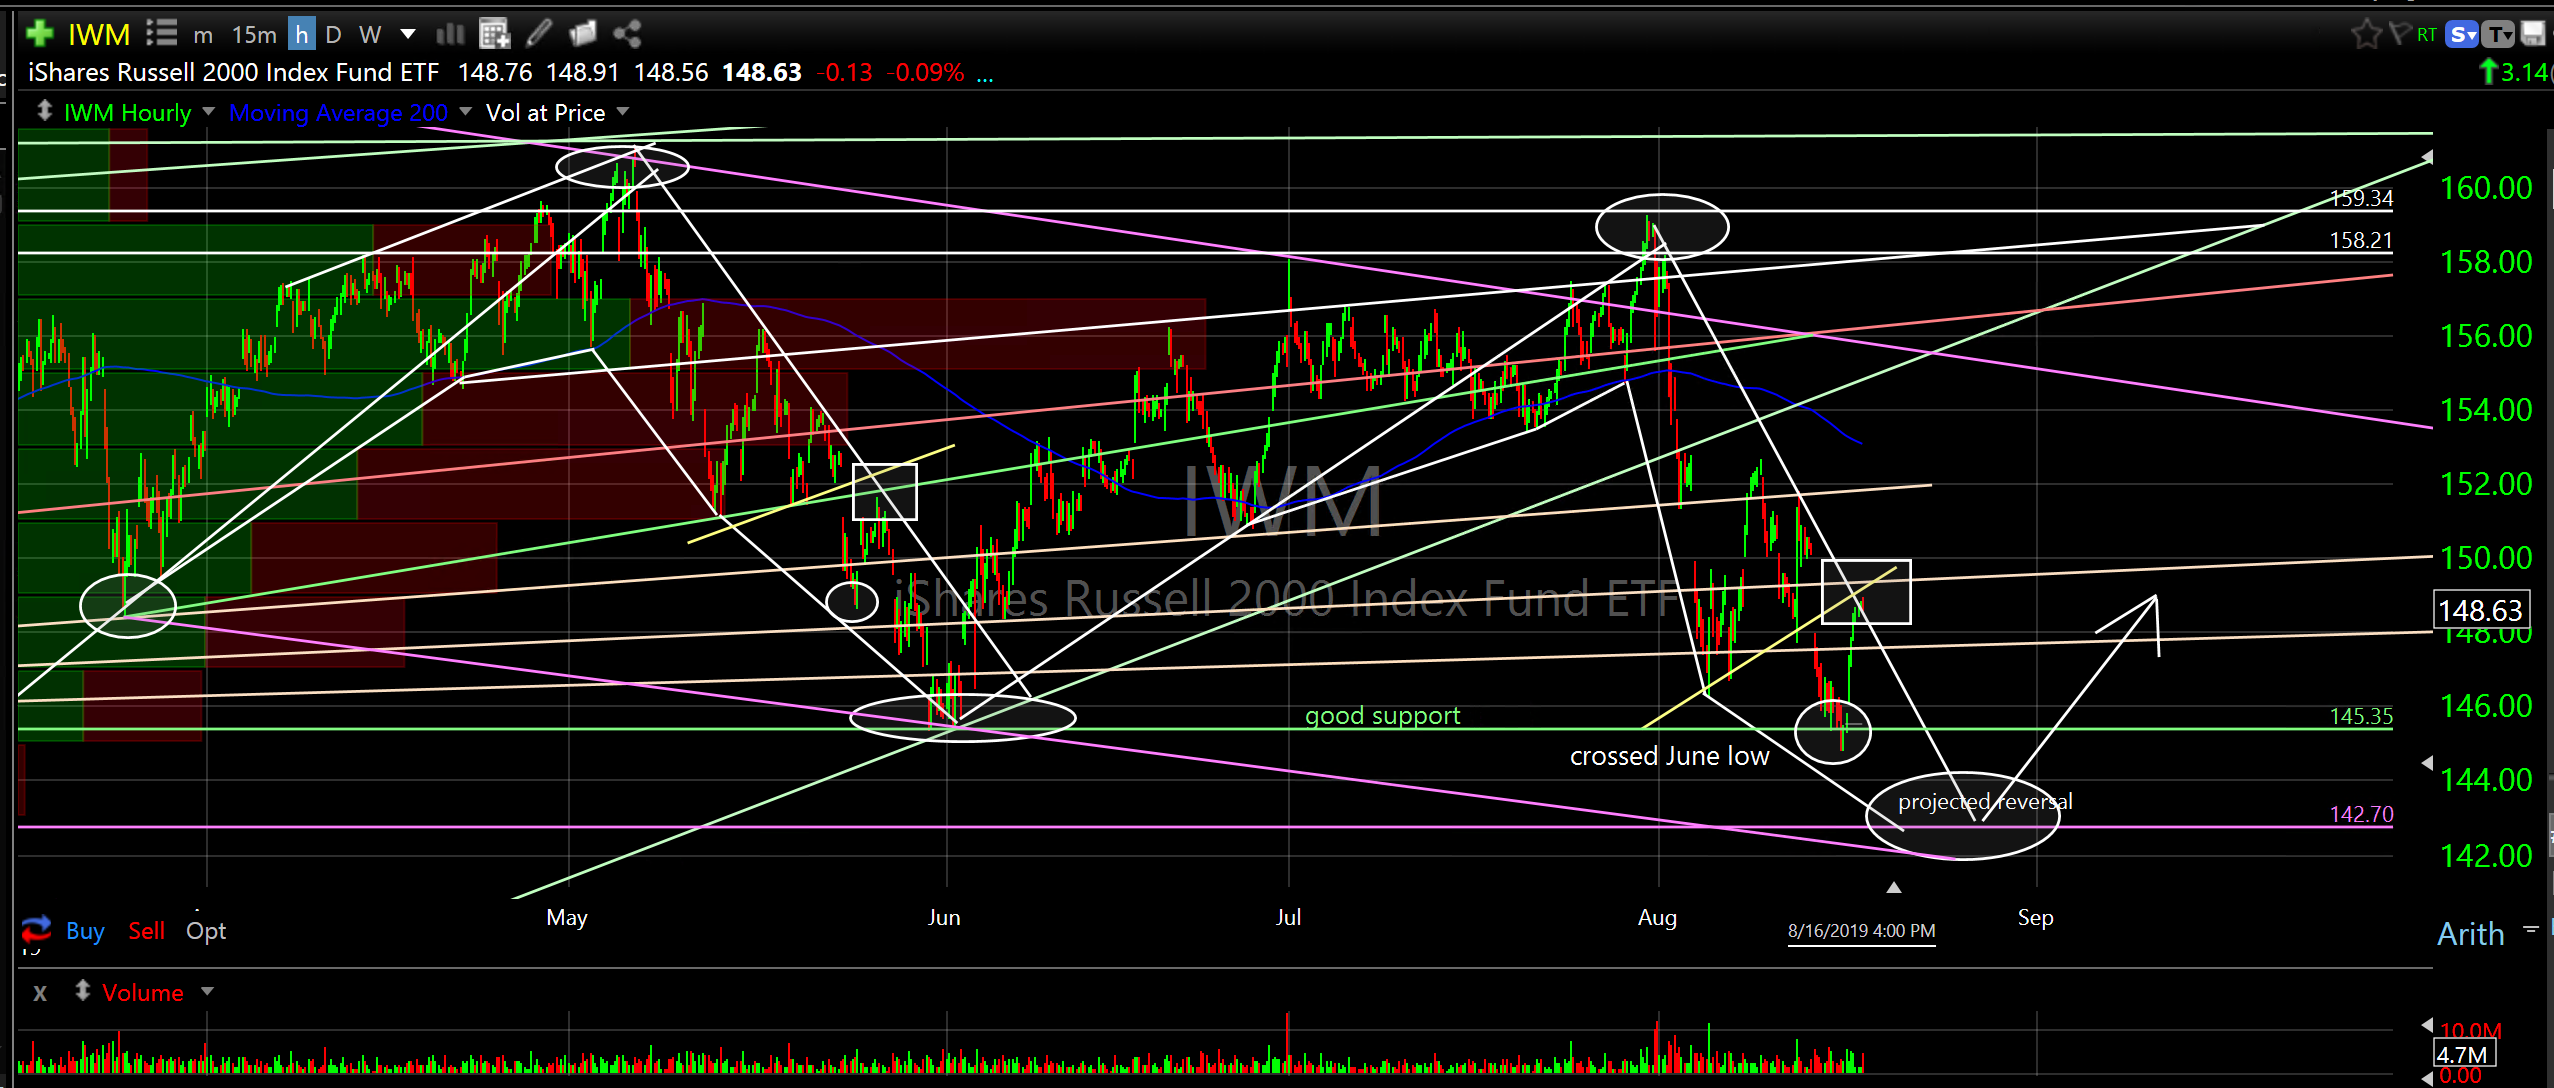
If you look at the small cap ETF (IWM) you can see it traded below the June lows which QQQ, SPY and DIA have not done. This is not significant as small caps have been weaker all year and each instrument has it’s own unique “footprint”. One of the things I look for at key reversal zones is for all of the major indexes to “line up”. They will tend to align at their own strong support/resistance convergence zones at the same time during key reversals.
iShares Russell 2000 Index Fund ETF (IWM) hourly
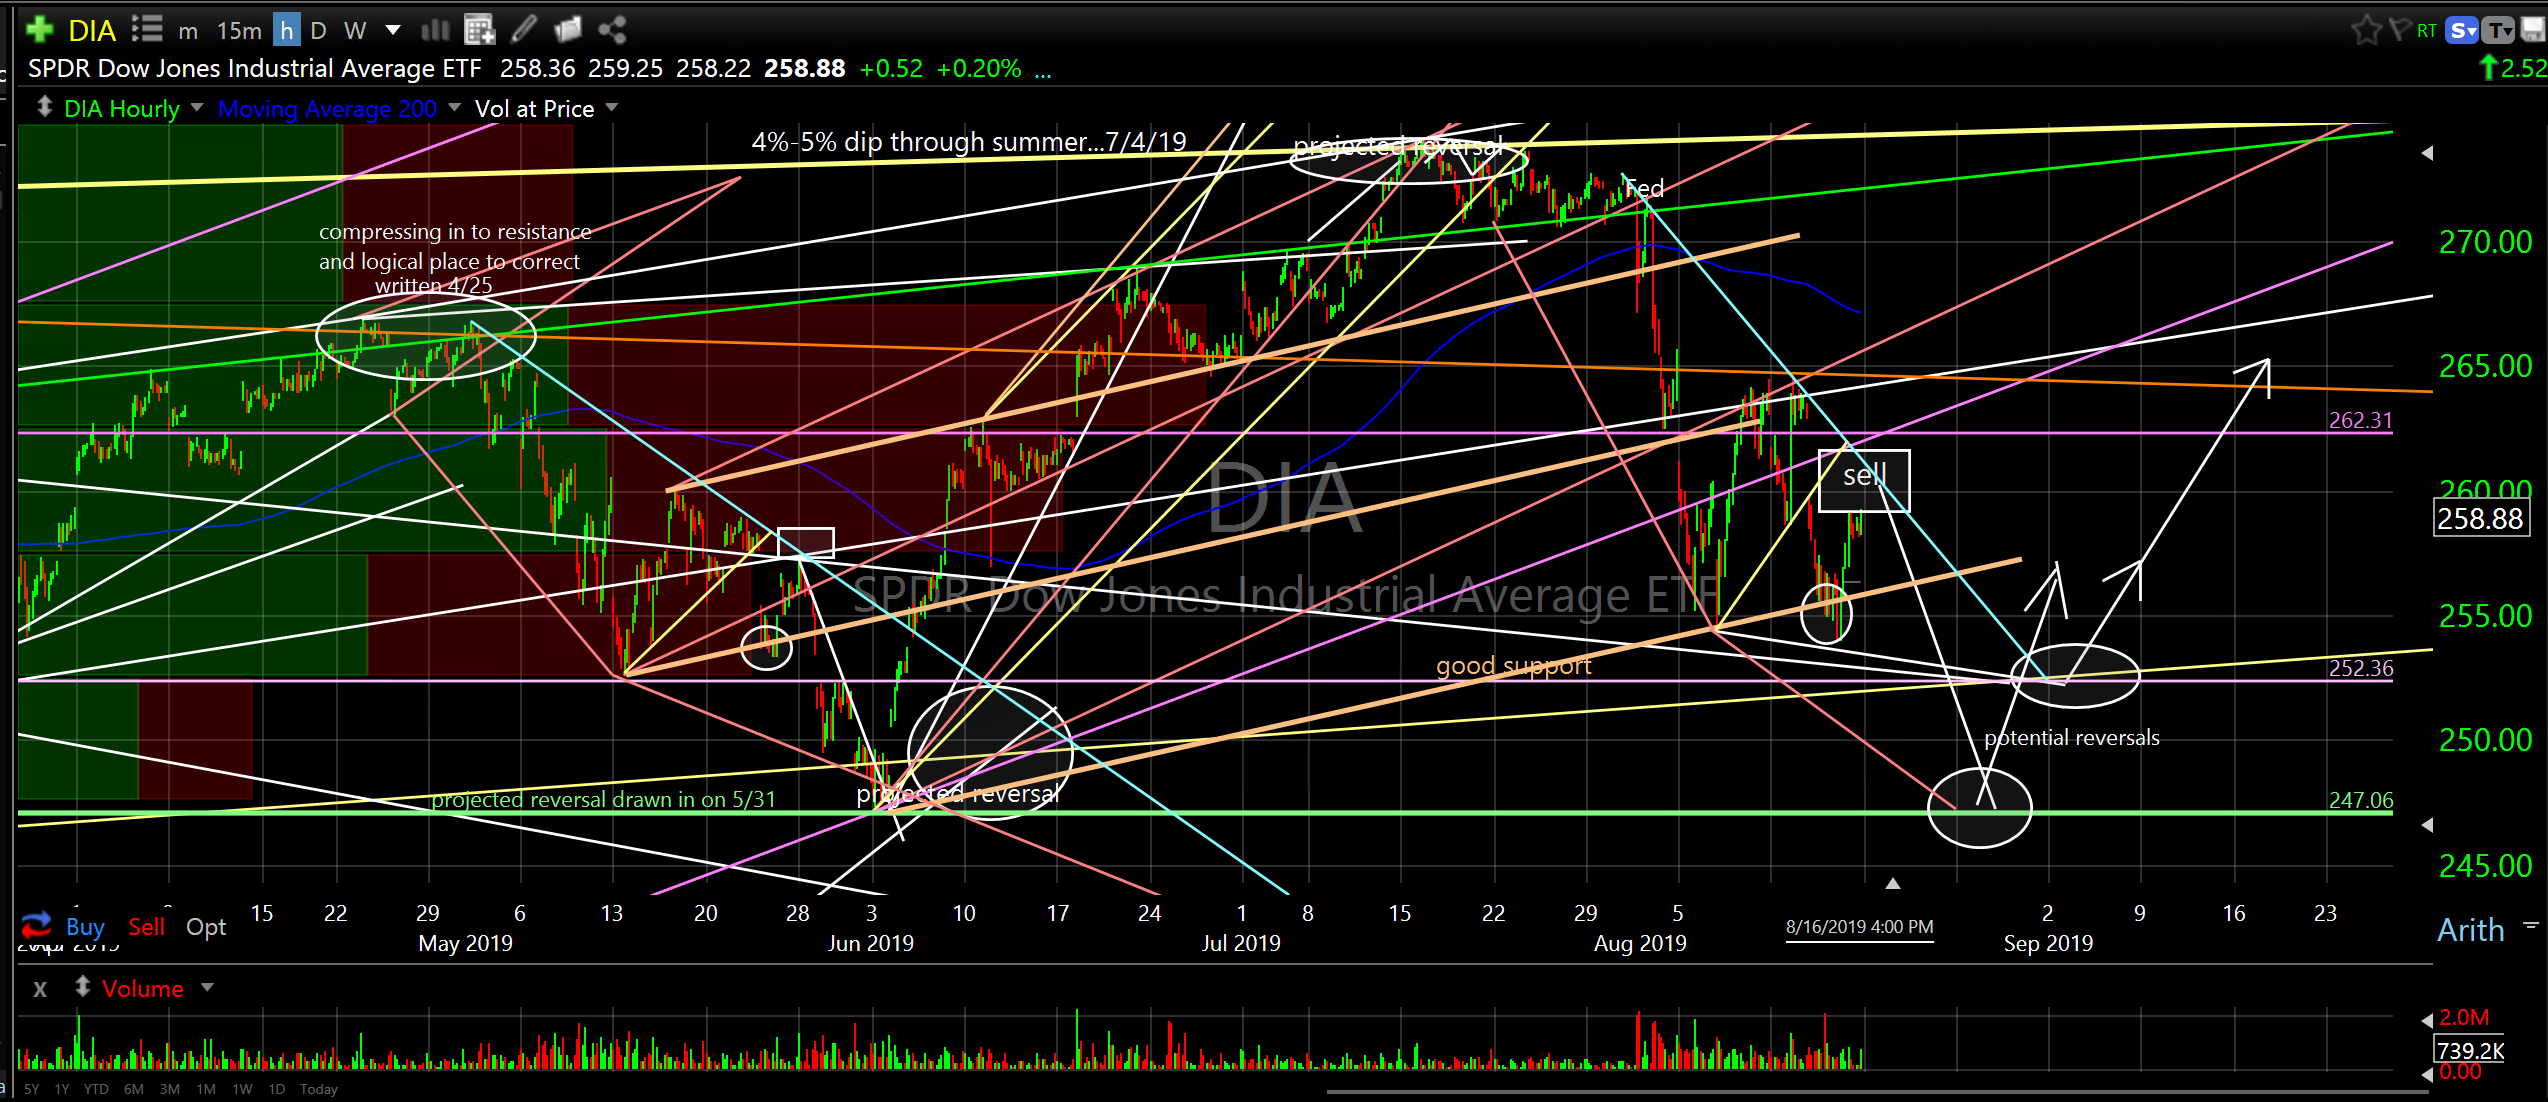
If you look at the charts of DIA, SPY, QQQ and IWM they all got bid up at their own “good support” on Thursday and Friday. They could certainly expand from here and go higher but I believe they need to go to a lower support level before reversing higher for another leg up. Remember, the market will try and fool most of the people most of the time. I have drawn in the reversal projections on each of these major indexes and will need more price data over the next week or so to refine the next reversal level/time.
SPDR Dow Jones Industrial Average ETF (DIA) hourly
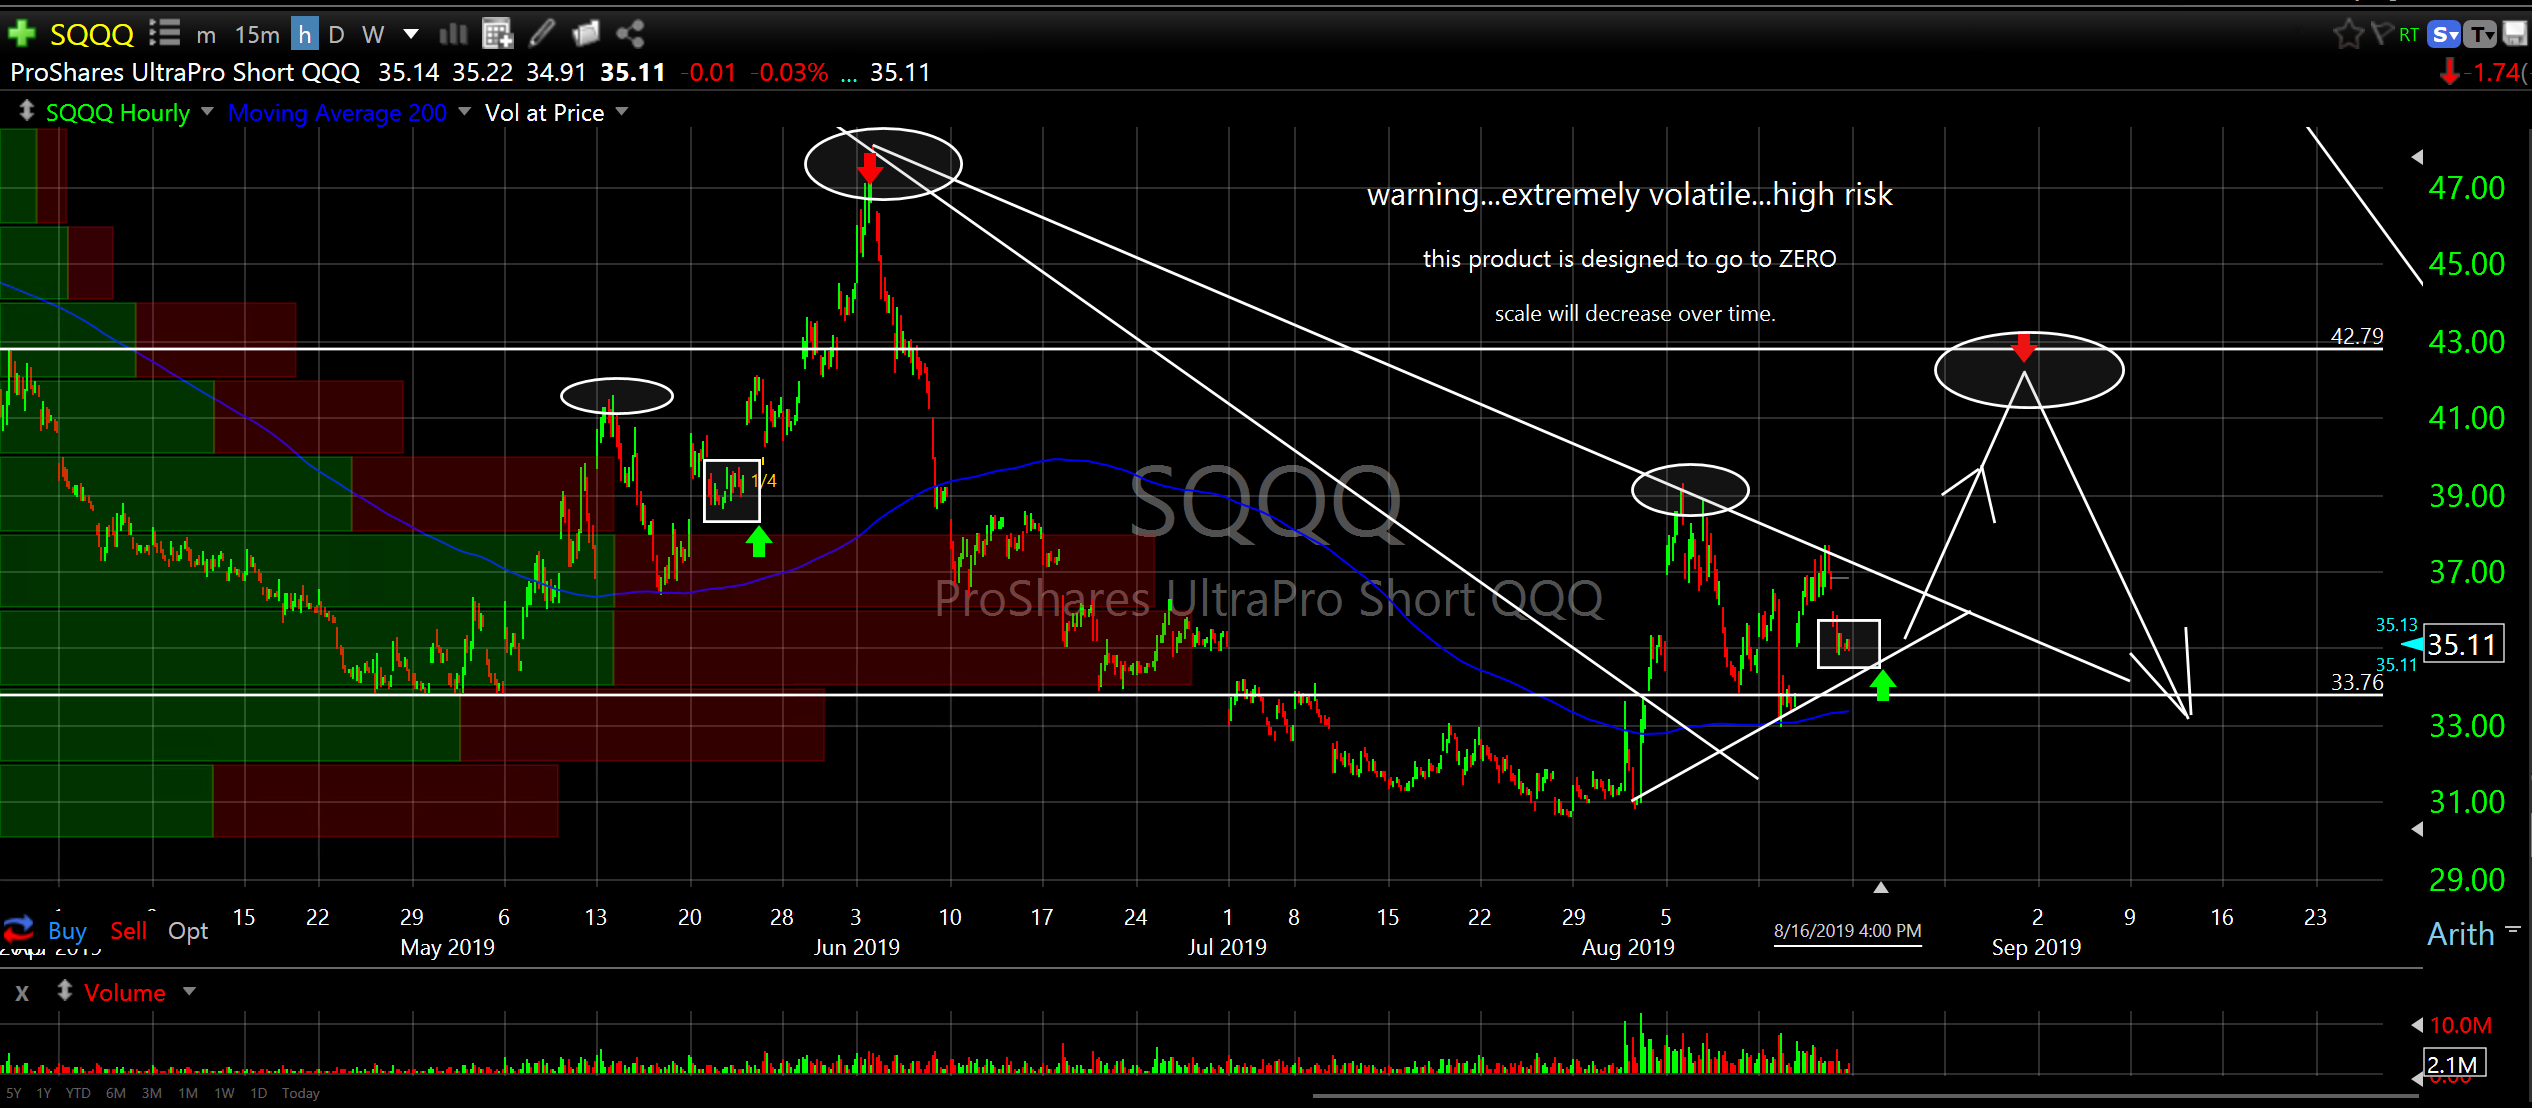
With today, Friday, being a Dow up 300 day I added to some hedging instruments. I generally don’t buy levered products but I did buy a little SQQQ today just to partially de-risk for a couple of weeks. I will not be putting it on the entry idea list as it is 3X levered and you probably shouldn’t be messing with it unless you really understand this instrument. Many instruments like this are designed to go to ZERO. Beware! Please see my price projection on hourly chart.
ProShares UltraPro Short QQQ (SQQQ) hourly
On the funny mental (fundamental) side there is concern over trade, growth and yields. Trade issues will likely get worked out, growth should expand for a few more quarters and yields are likely bottoming.
Regarding yields…
There continues to be a lot of talk about the yield curve inverting and signaling a coming recession. While this inversion correlation is consistent it’s usually about 18 months of lag. But…please take note of the weekly chart of the 10 year Treasury Yield. The last two times the 10 year got to this support level the broader market went into expansion mode. I expect that to happen again.
Exits
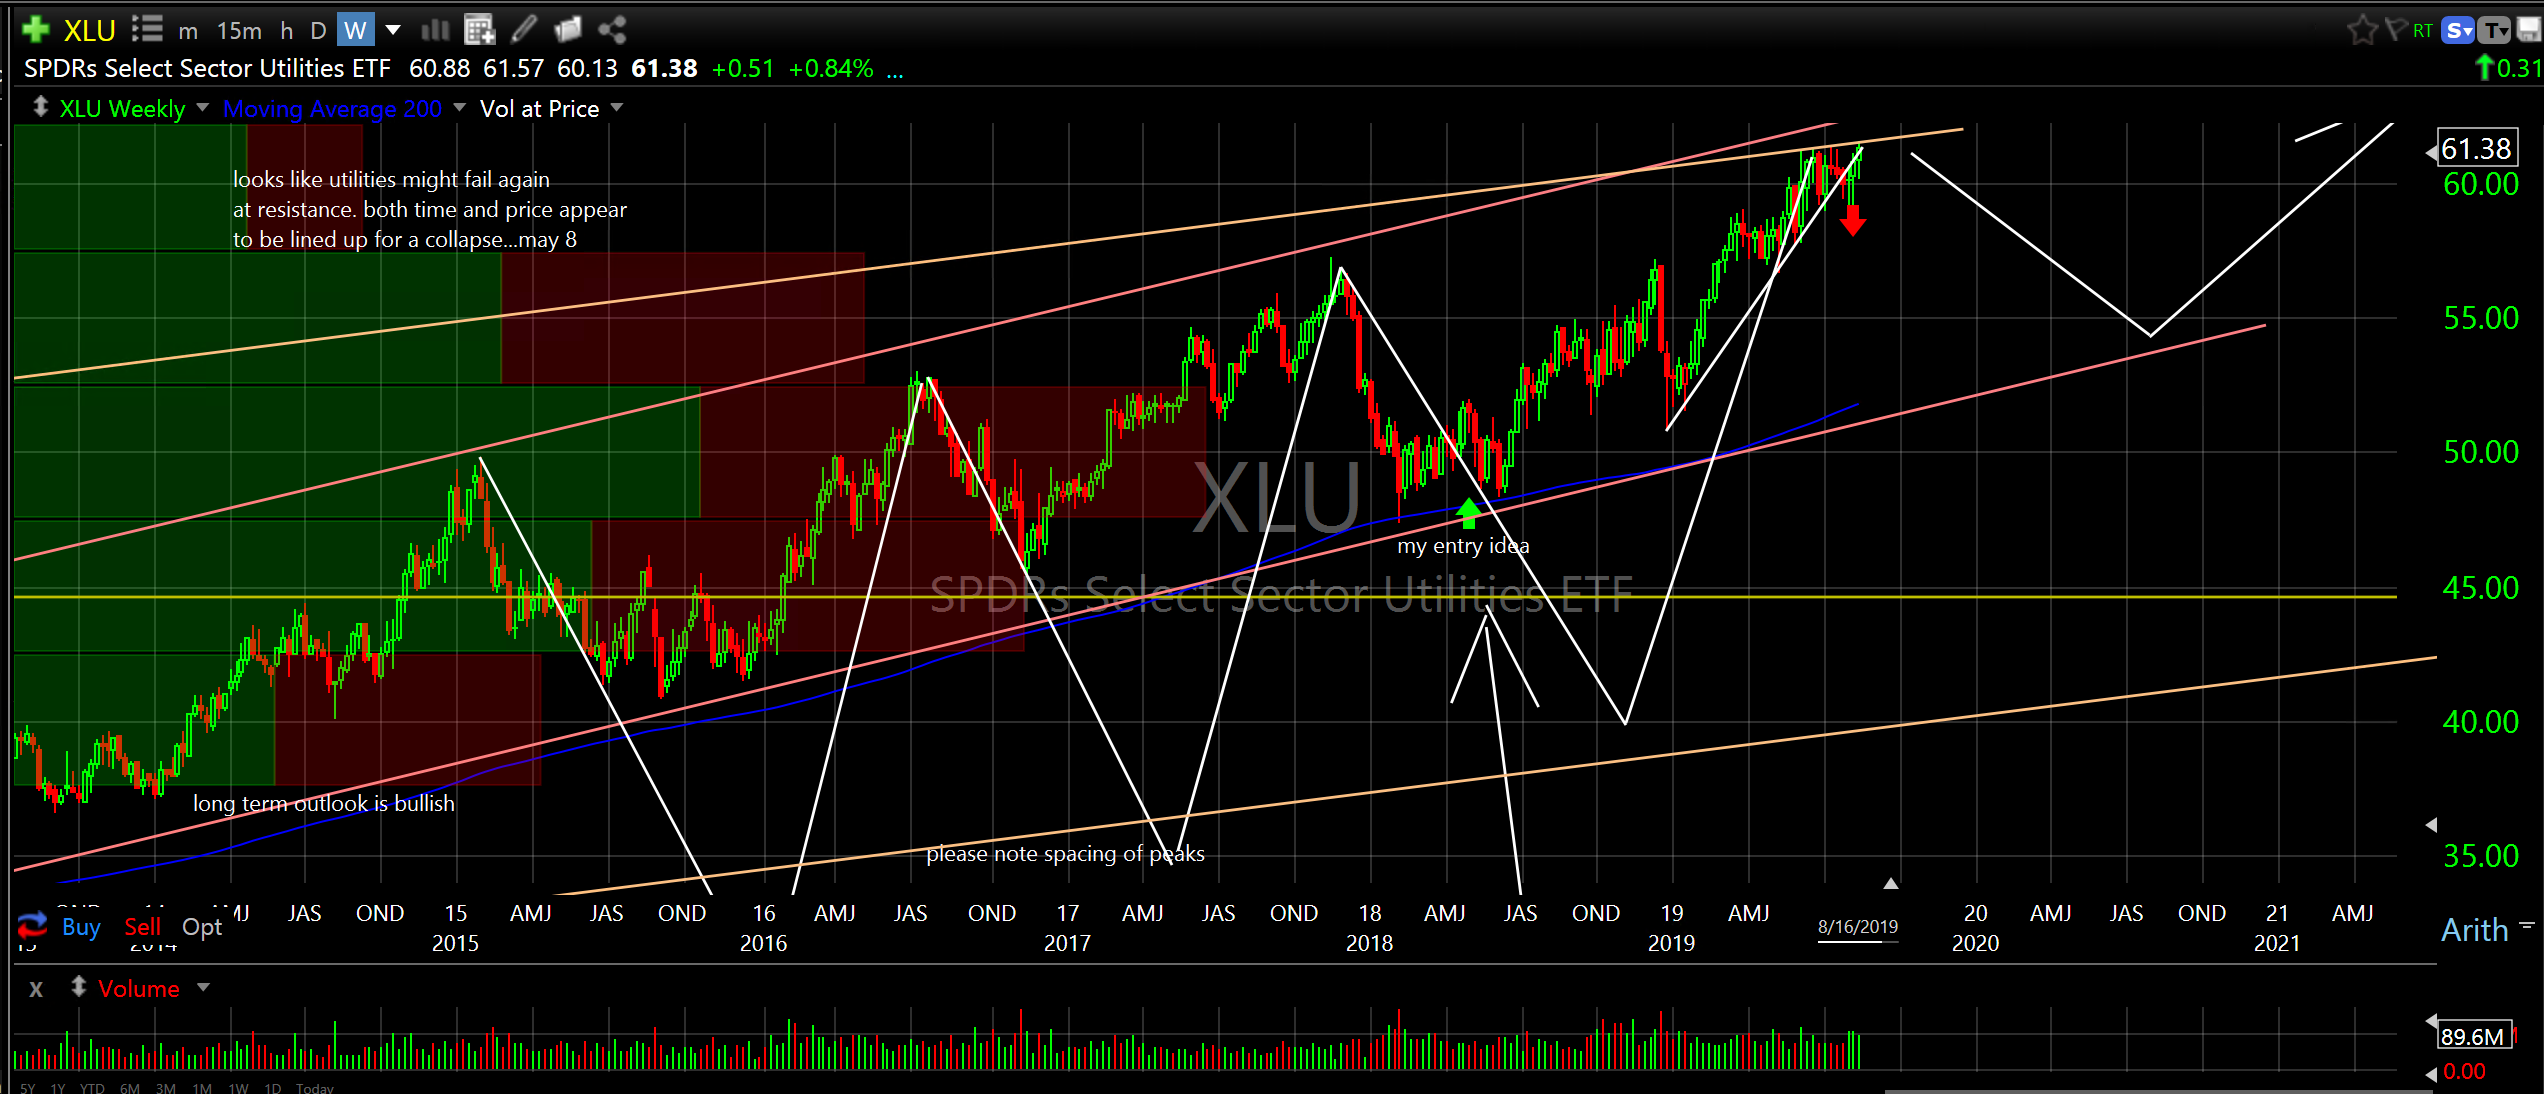
I exited the utilities sector ETF (XLU) today. I recommended it on May 7, 2018 and it has run up about 18% since. Price has run into resistance and I expect weakness over the next six months therefore time for profit taking. See weekly chart.
SPDR’s Select Sector Utilities ETF (XLU) weekly
Other Stuff and Dreamweavers
While my broader market price projections/reversals have been spot on this year please don’t expect that I will be quite this consistently accurate in the future. It is very difficult to know what the future holds for any investment instrument, thus risk. I do hope, however, that you see the power of charting and the benefits of technical analysis in general. Most people just don’t have a clue. I don’t mean this in a bad way…maybe a sad way. They just don’t know what they don’t know. Even the professionals! There is a reason I can be so accurate at times…and it’s not due to fundamental analysis…it’s due to understanding how to interpret historical price data. It certainly isn’t an exact science, however, human behavior can certainly be measured and leveraged.
Remember, these are just my thoughts and opinions, not investment advice. Please do your own due diligence and research. Charting is just one aspect of analysis…I happen to think it’s the most important but again that’s just my opinion.
If you would like me to cover any individual stocks or ETF’s just let me know…I would be happy to help in any way I can. I’m just an email away.
Hedge funds and portfolio managers please feel free to forward/use this information for your clients and everyone else go ahead and share with whomever you like. If you know someone that would benefit from my weekly info just have them email me and I would be happy to give them a premium subscription trial through the end of the year.
My secret dream: To have a team of enthusiastic minds to research more instruments, monitor more stocks and ETF’s and really give this work of entries and exits what it deserves. Just to cover the 500 stocks in the S&P 500 Index and 100 stocks in the Nasdaq 100 is just too much for one person.Then to add all of the ETF’s and the thousands of stocks in foreign exchanges…whew. There is so much more that can and should be done. Any dreamweavers out there? Anyone want to help start a hedge fund/research team?
Sweet dreams,
Don
PS. sorry, I got a little wordy today.