Broader Market Review
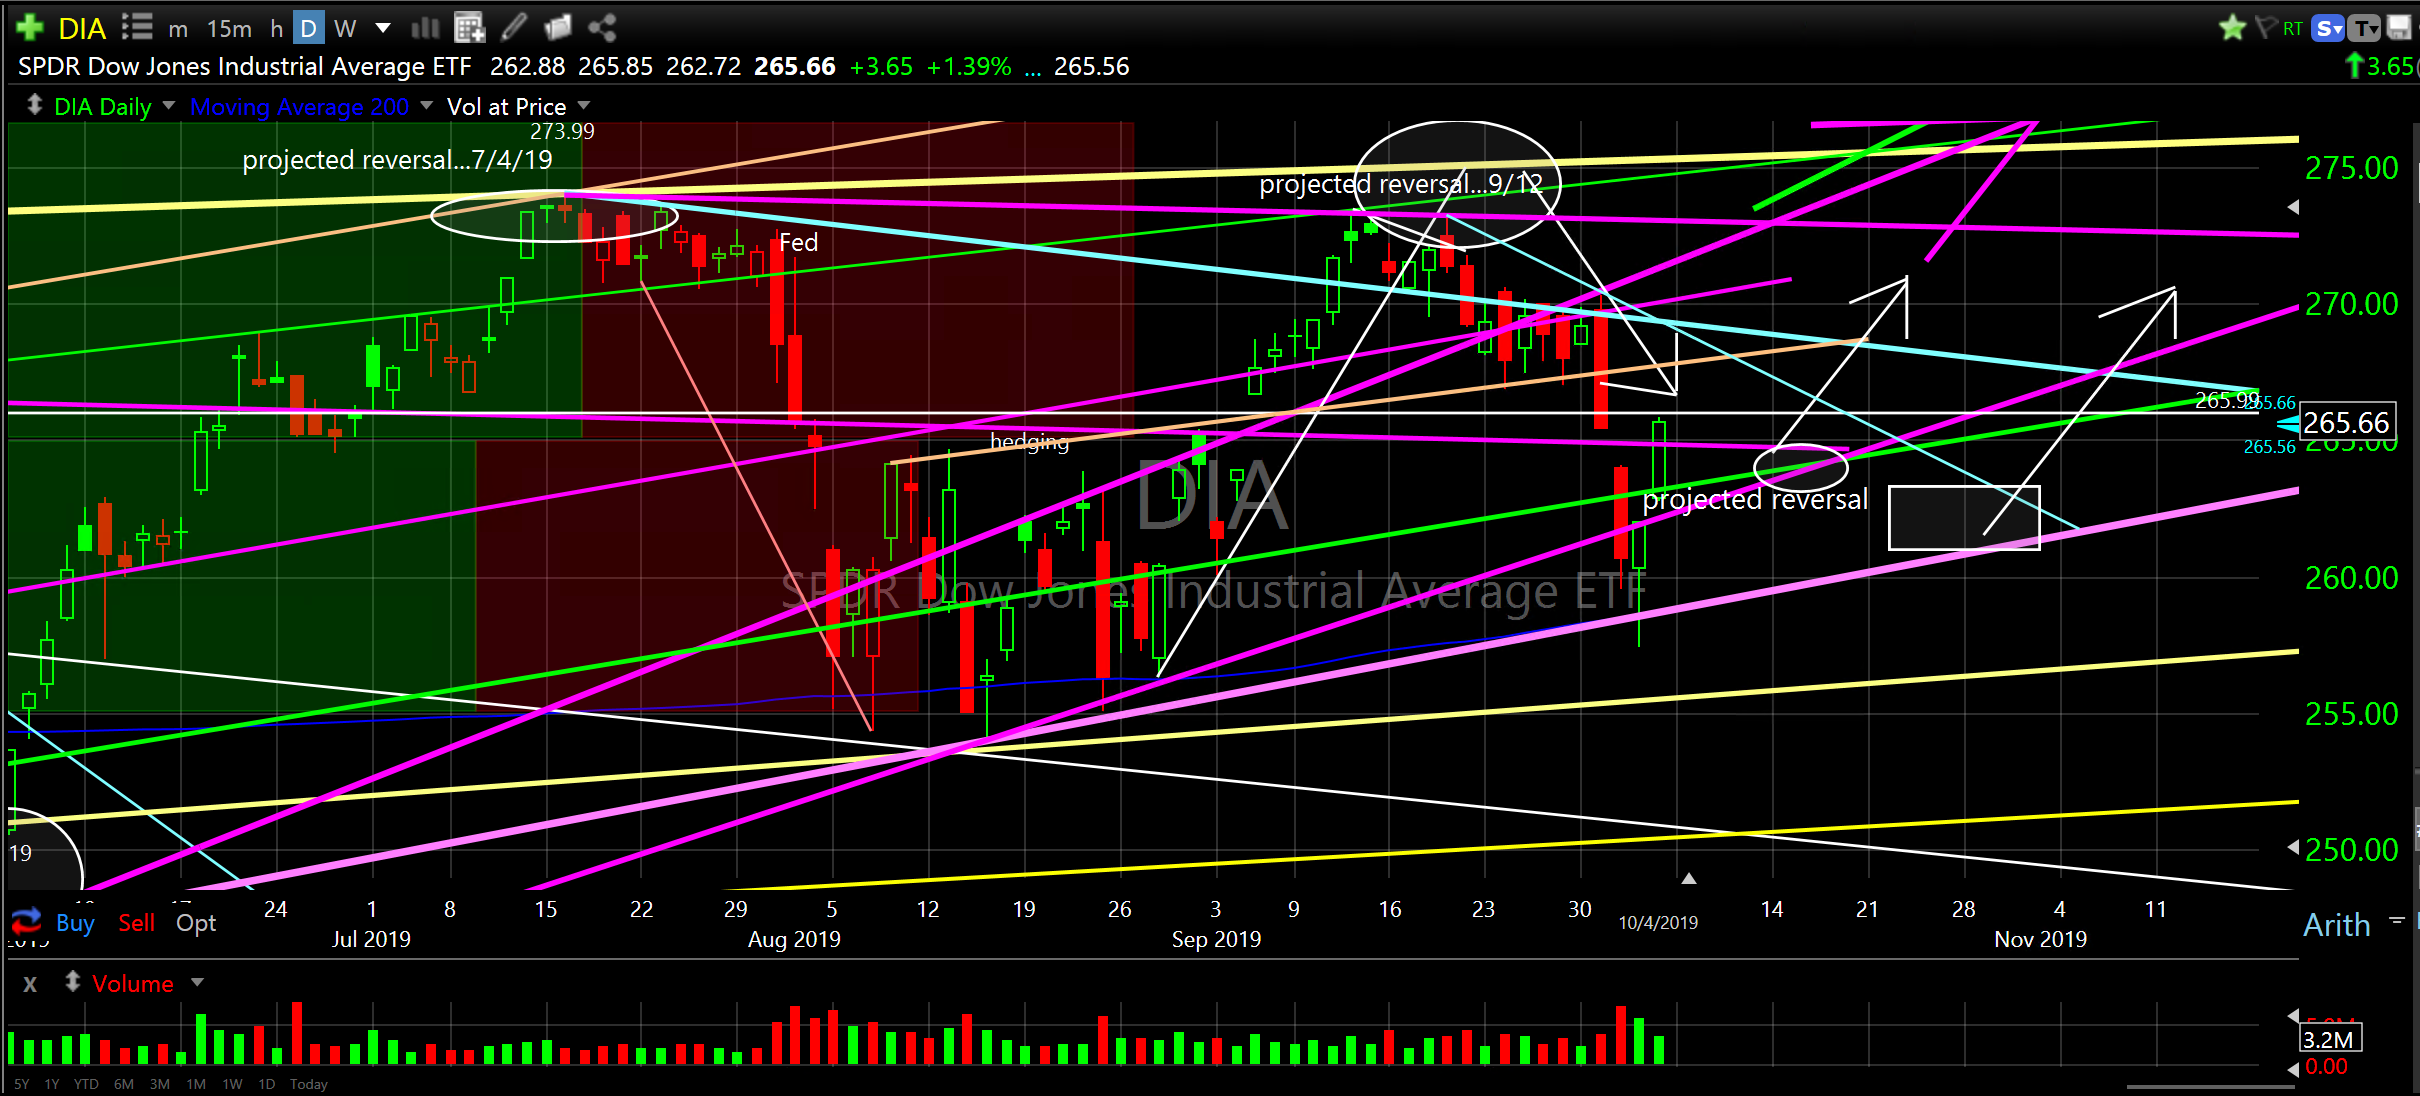
Whew! Another volatile week in the books. Tuesday and Wednesday were loaded full of sellers getting their way then after going deeper yet Thursday morning the broader markets reversed higher with the Dow climbing over 800 points off the week’s lows by the close on Friday. That was an impressive reversal. Short term there is room to go higher early next week up to the descending blue line at which point I would expect another leg down. Due to the depth of the move last week the structure of this current dip appears larger than I originally measured and the next reversal higher might need to be positioned from a slightly lower level (see square I drew in that is sitting on top of light pink ascending support shelf from the June and August lows). I would expect consolidation (inside the wedge formed by the descending blue line and the ascending light pink line) into mid/late October before breaking up and out of this compressing wedge. I still expect new, all time highs challenging the ascending yellow line resistance and an eventual slingshot to release the broader market higher. I remain bullish for 2020 but October is still a crapshoot.
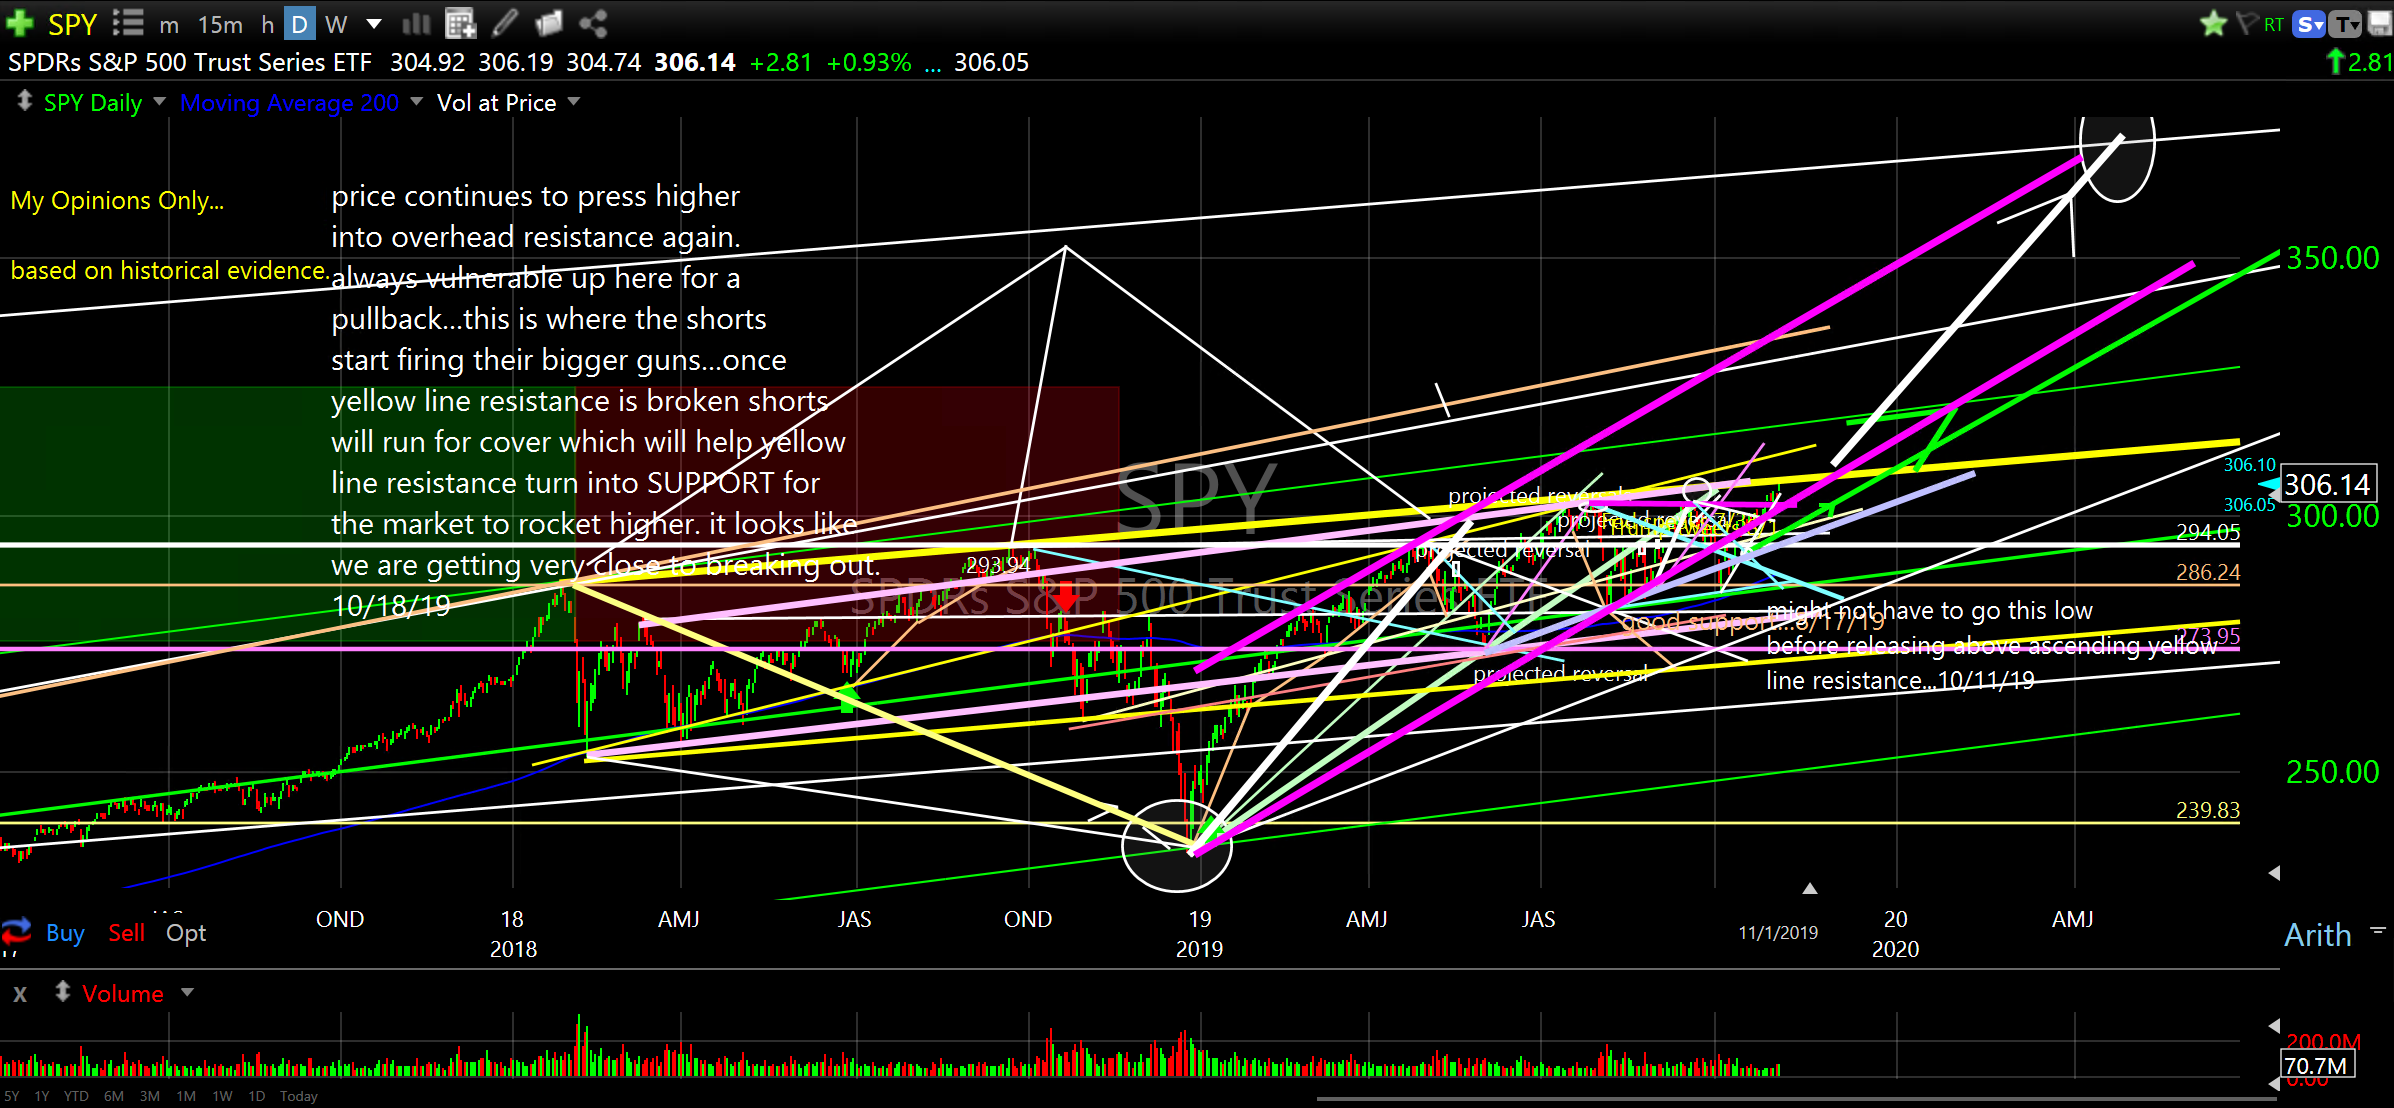
Volatility should remain high until the broader market releases above the ascending yellow line and then this line will turn into support and price should ramp higher leaving the masses in the dust scratching their heads and waiting for a pullback that might not appear for months. Remember, most people will get this wrong and will be on the wrong side of the market. I would not be surprised to see some chop and uncertainty while pushing up and through the ceiling into November but we should release higher before the end of the year. Considering all of the uncertainty surrounding market direction it would be a perfect time to start ripping higher. See DIA chart below…
SPDR Dow Jones Industrial Average (DIA) daily
Right now is a good time to sit back and watch the market play out. Remember, these are just my opinions based on historical evidence, however, anything is possible. Please see all published research archived on my website for further review and understanding. I will leave you with a few charts to ponder. By the way, we had a wonderful weekend celebrating our son’s wedding and our granddaughter’s 16th birthday. I am feeling very blessed…and…exhausted.
Some Charts to Ponder
Tesla Inc (TSLA) daily
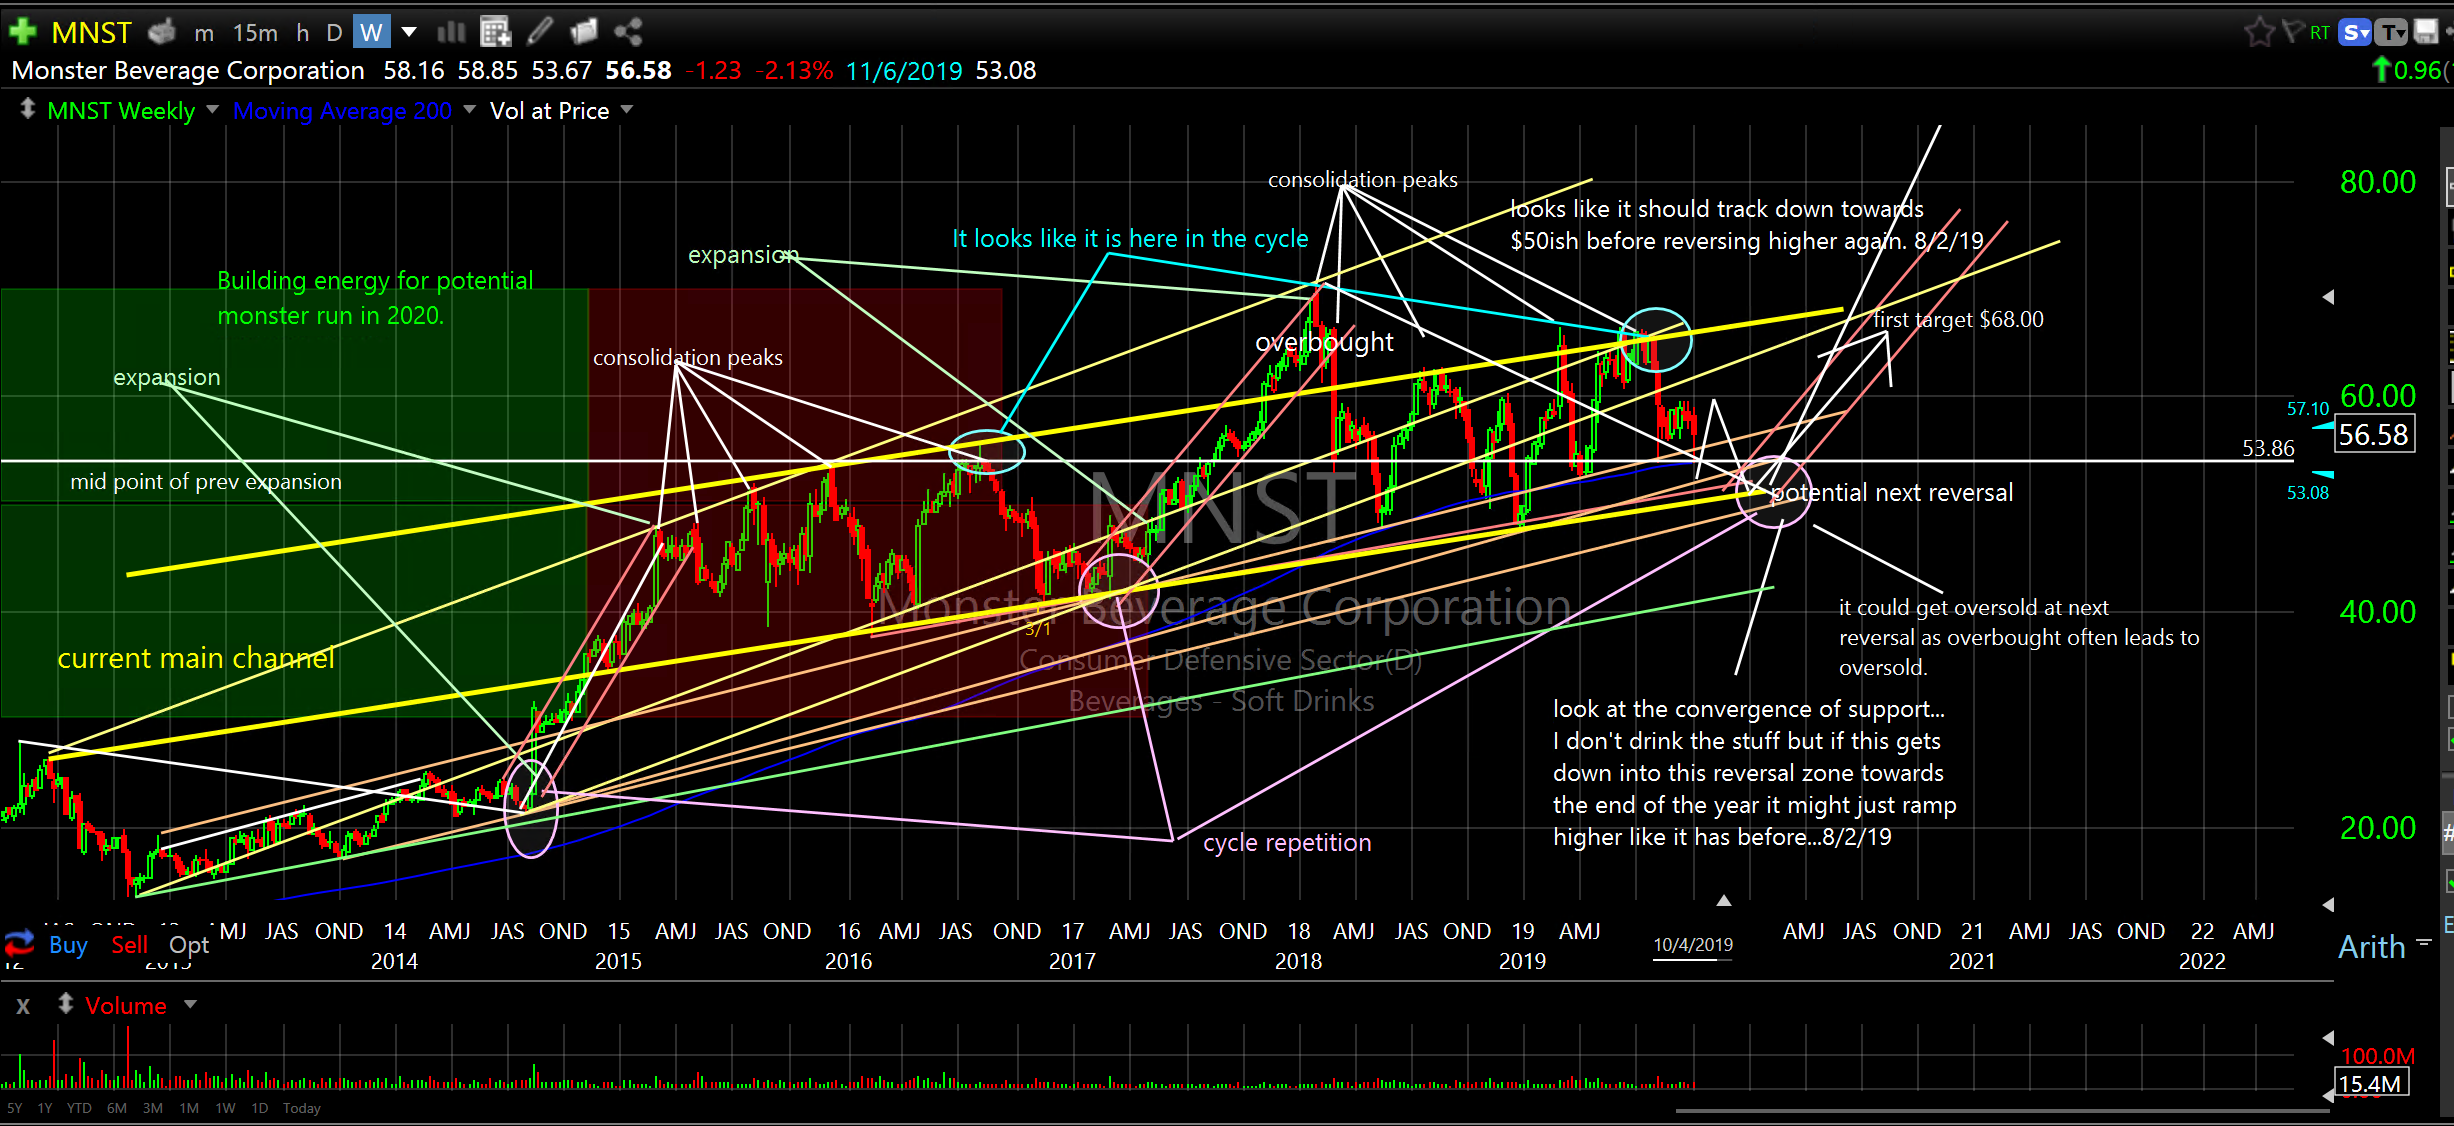
Monster Beverage Corporation (MNST) weekly
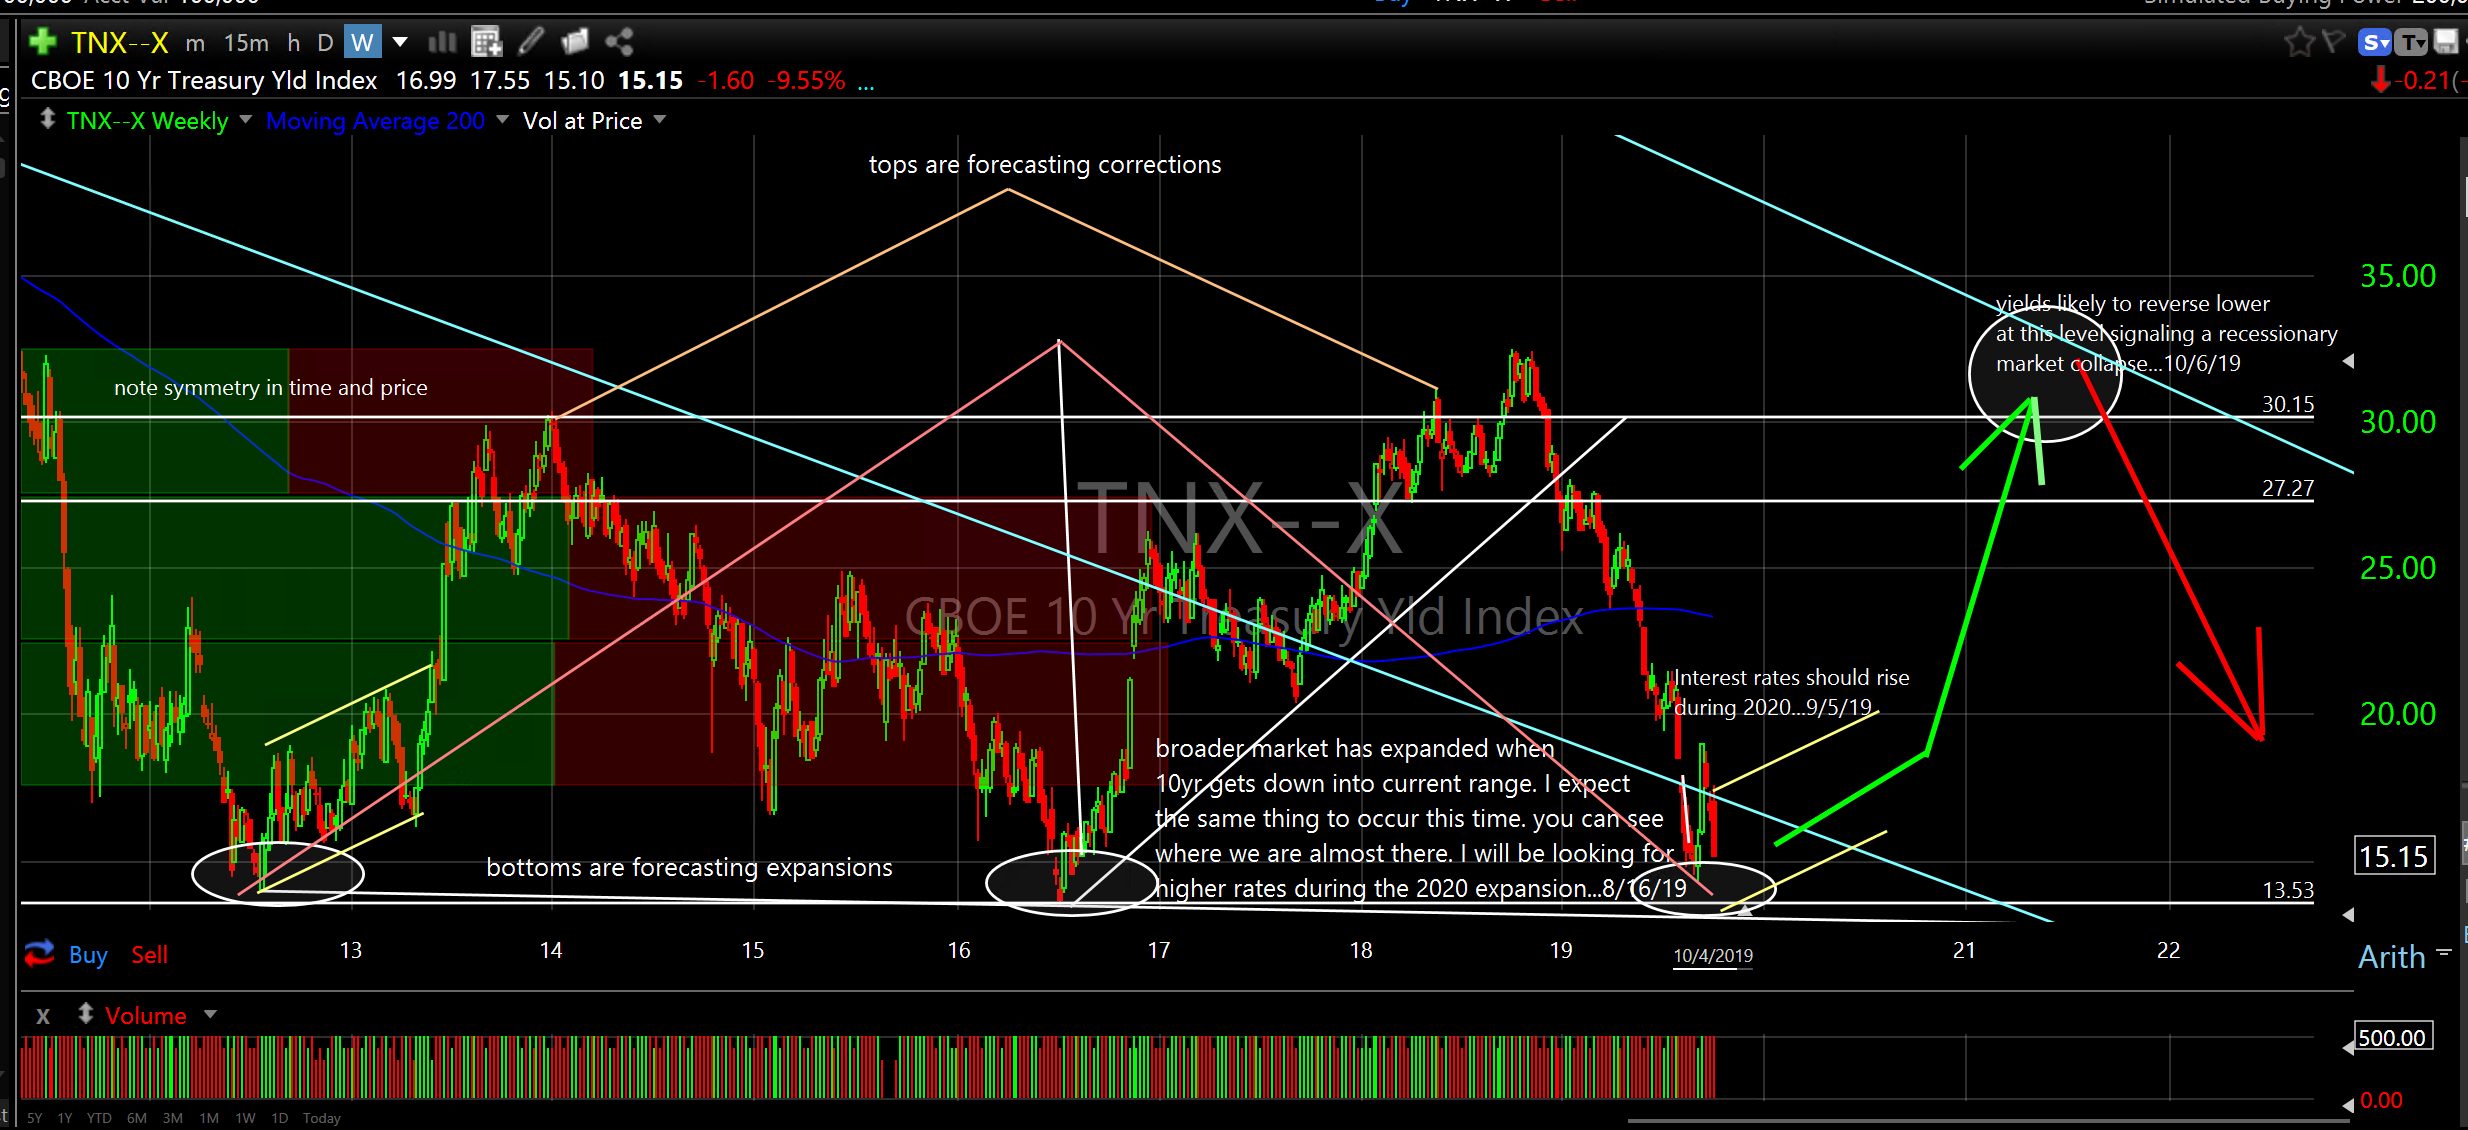
CBOE 10 yr Treasury Yld Index (TNX-X) weekly
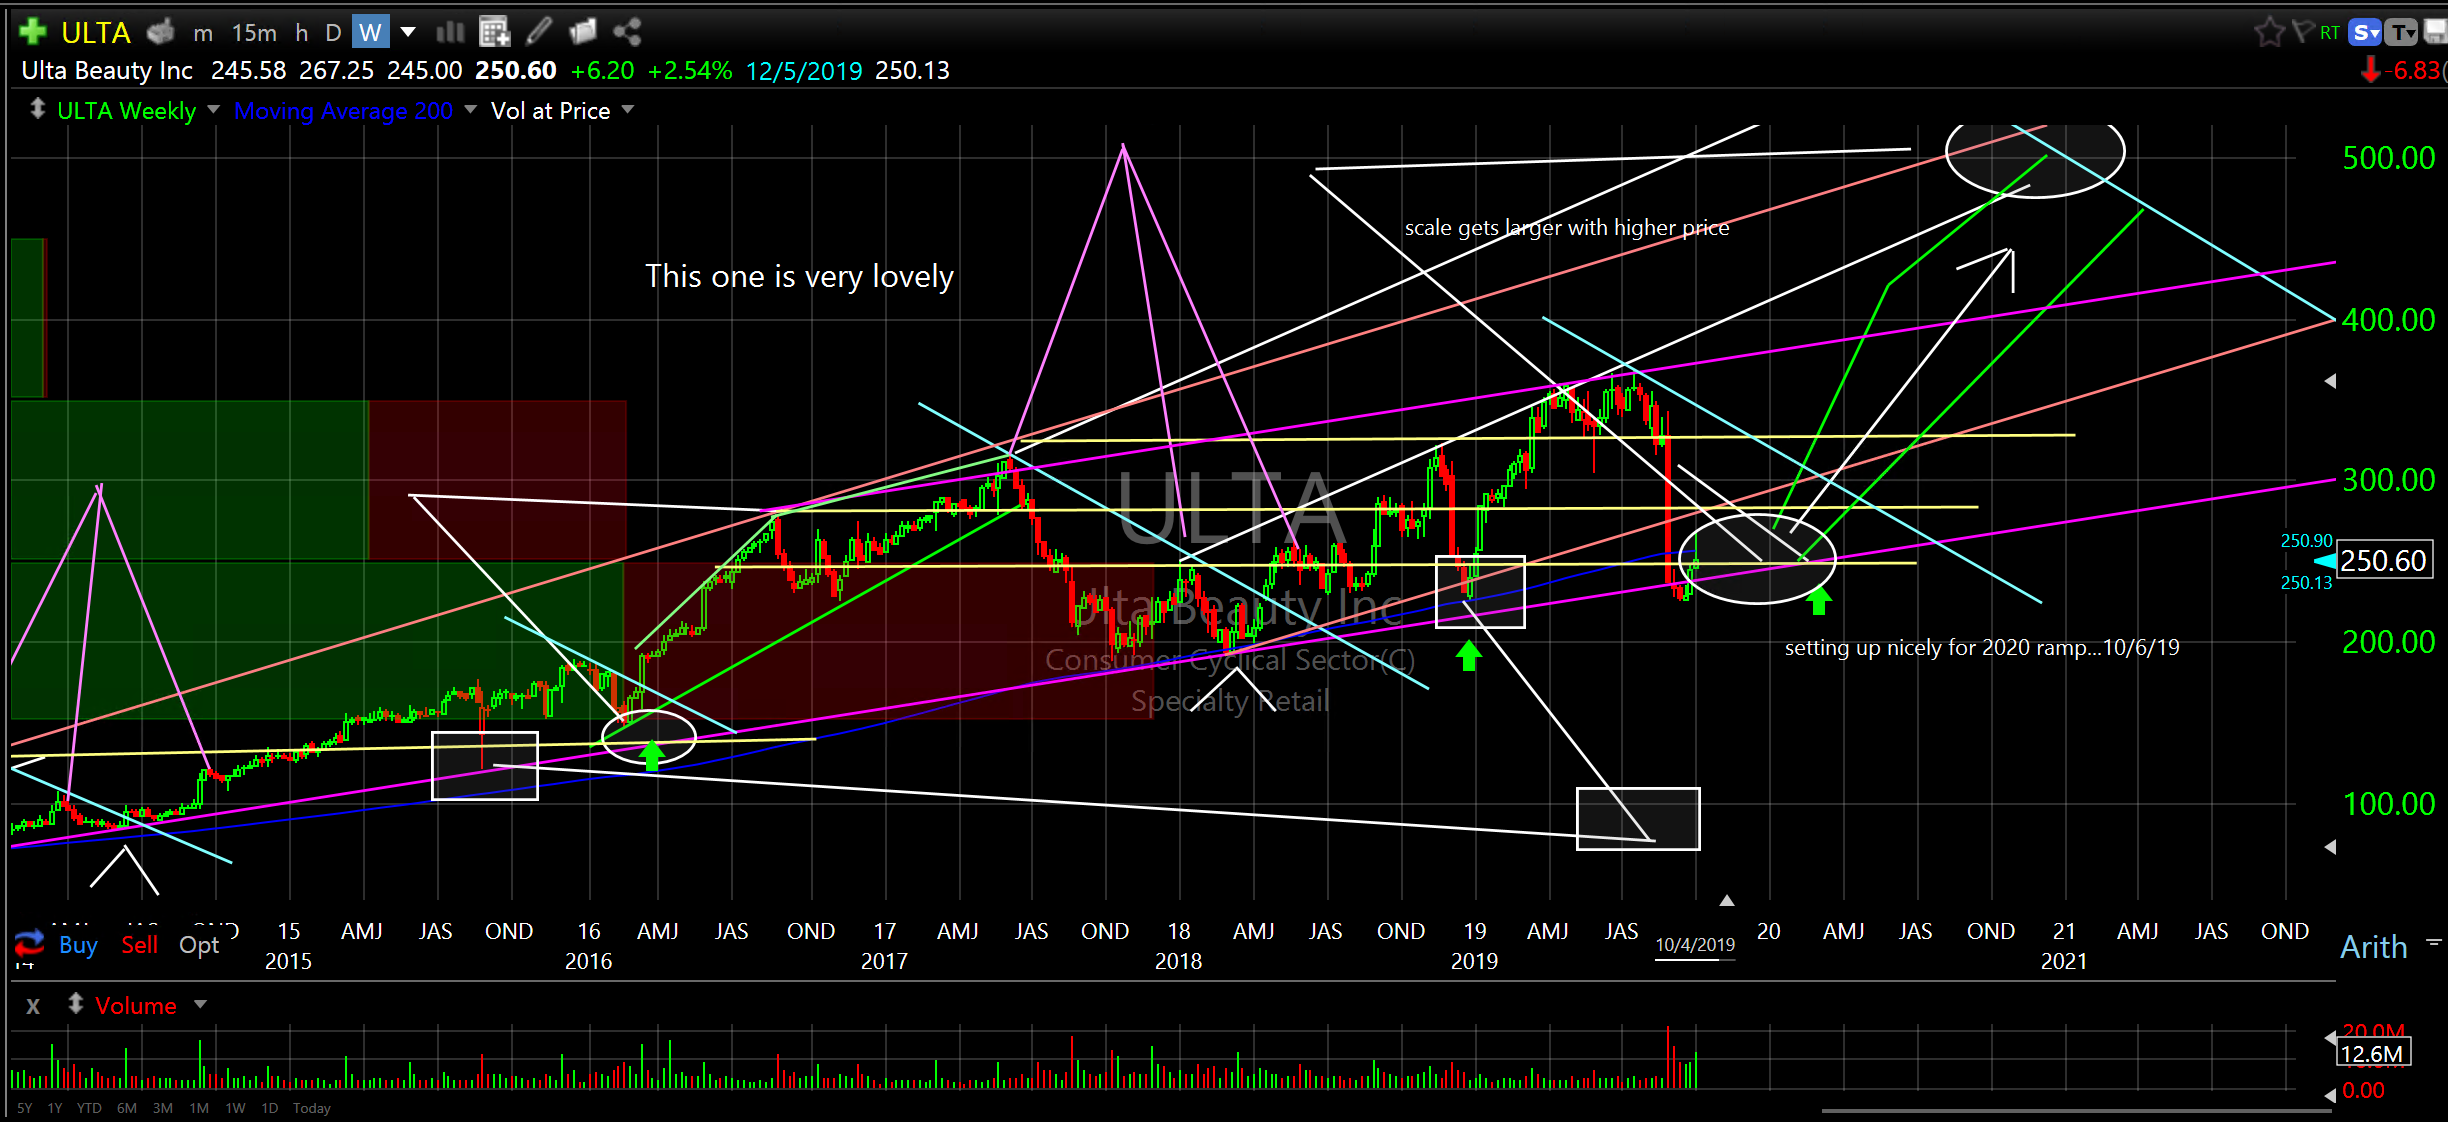
Ulta Beauty Inc (ULTA) weekly
Cautiously getting excited,
Don