Don’t you just love a good logarithmic scale now and then? I know, you are probably getting goose bumps right about now.
I generally use an arithmetic scale on my price charts but I like to look at a log scale when looking at long time frames. It gives me a better “look” at percentage gains over decades.
Arithmetic scales have equal spacing of price on the vertical axis so a $5 change from $10 to $15 (50% move) looks the same as a $5 change from $95 to $100 (<5% move). Log scales show percentage moves to be equal spacing. A 10% change from $5 to $5.50 will look the same as a 10% change from $100 to $110. Note that the comparison is a 50 cent move vs a $10 move.
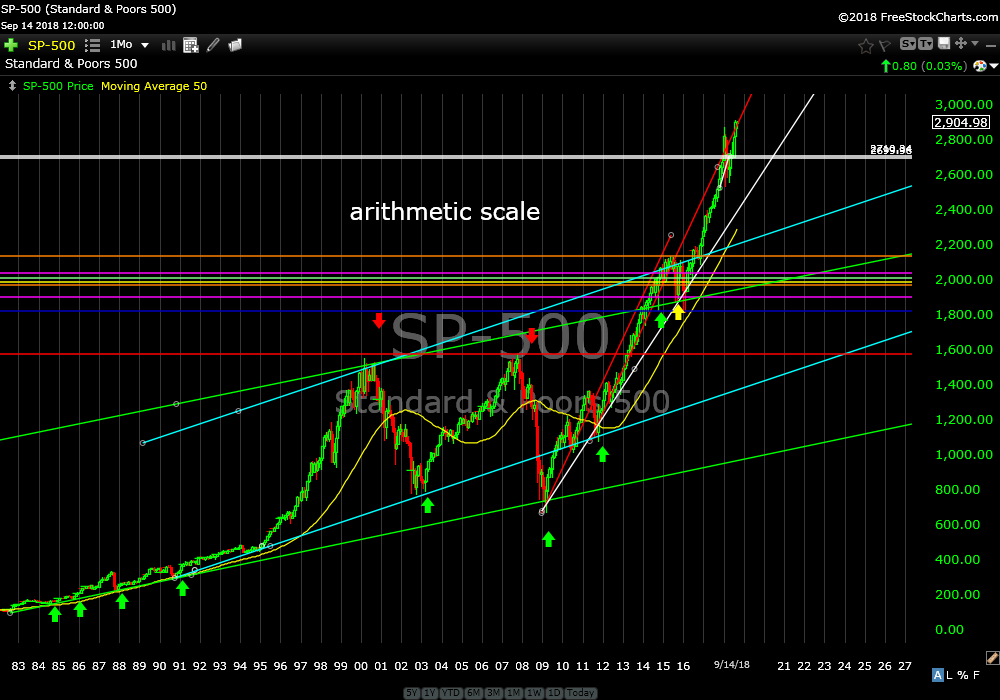
Please compare the two charts below. They are identical charts of the S&P 500 index with the exception that the first one is arithmetic and the second one is logarithmic. Do you see the difference?
Standard & Poors 500 arithmetic scale
Standard & Poors 500 logarithmic
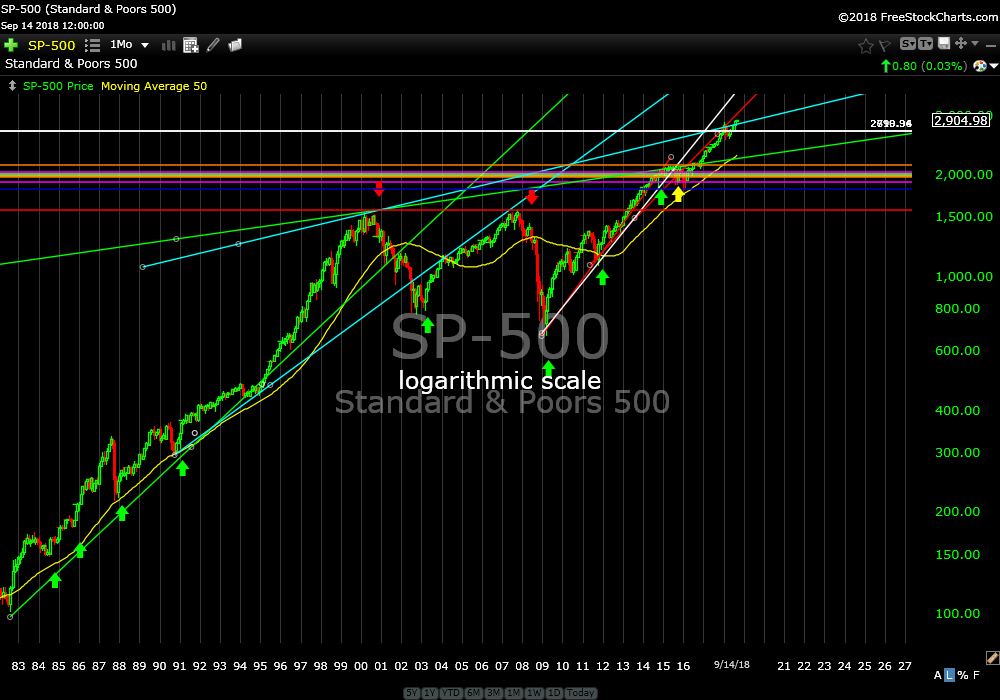
The long term support and resistance levels I have drawn in are from my arithmetic chart. It’s interesting to note where they are relative to log scaling.
The big takeaway is comparing the percentage rise in price during the bull market from 1982 to 2001 relative to current price from either the top in 2001 or 2007 or the bottom in 2009.
From the low in September 1982 to the high in September 2000 price went from 117.16 to 1530.09. That is a 1206% increase. From the high in 2000 to now price has gone from 1530.09 to 2888.92 (9-12-18 close). That is only an 89% increase in the past 18 years compared to the 18 year increase of 1206% from 1982 to 2000. The return from the bottom in 2009 to now is 333%.
The log chart really shows us that in terms of percentage change we have a long way to go to come close to the percentage rise in price from 1982 to 2000. A similar rise in price from the bottom in 2009 would equal a price of 8041. That is a 178% return on price from now; $100,000 grows to $278,000.
I’m not saying we are going to 8041 SPX without a sustained multi year bear market but on the other hand it’s not out of the question in terms of historic moves. Note: 1987 and 1991 were not sustained bear markets. They were black swan events that only lasted about two months each.
The Nasdaq index is even more interesting. From the low in 1991 to the high in 2000 the return was 2856%. In comparison, the low from 2009 to now has returned 636%. A similar rise in price from the bottom in 2009 would equal a price of 740. That is a 300% return from now: $100,000 grows to $400,000. Maybe this bull is going to have a much longer life than most expect? There is no reason it can’t live for many more years. Just sayin’.
Last weeks price action…
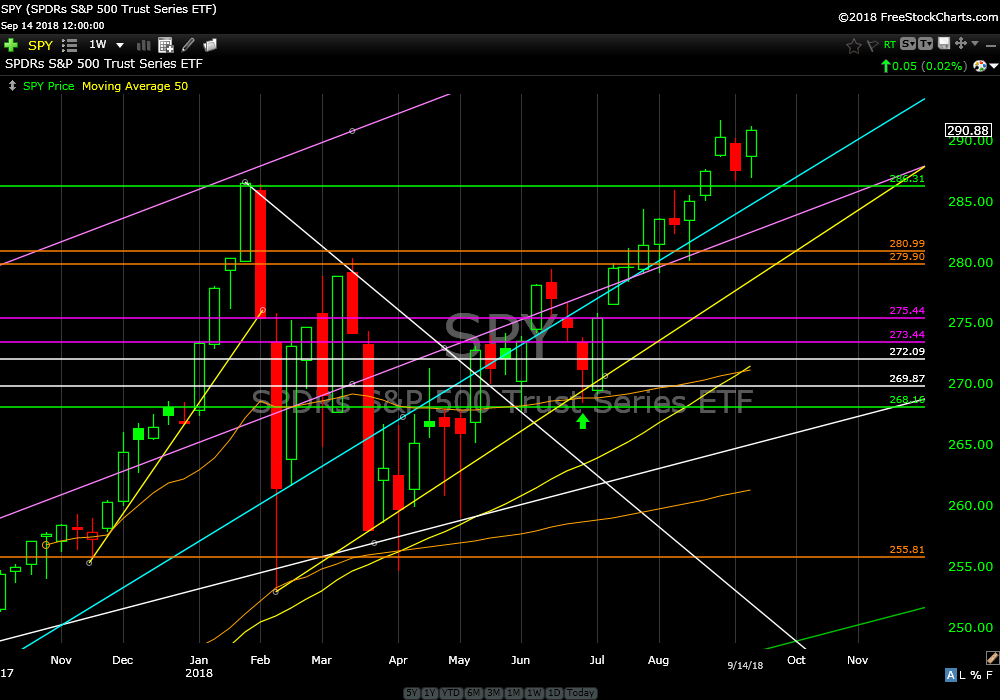
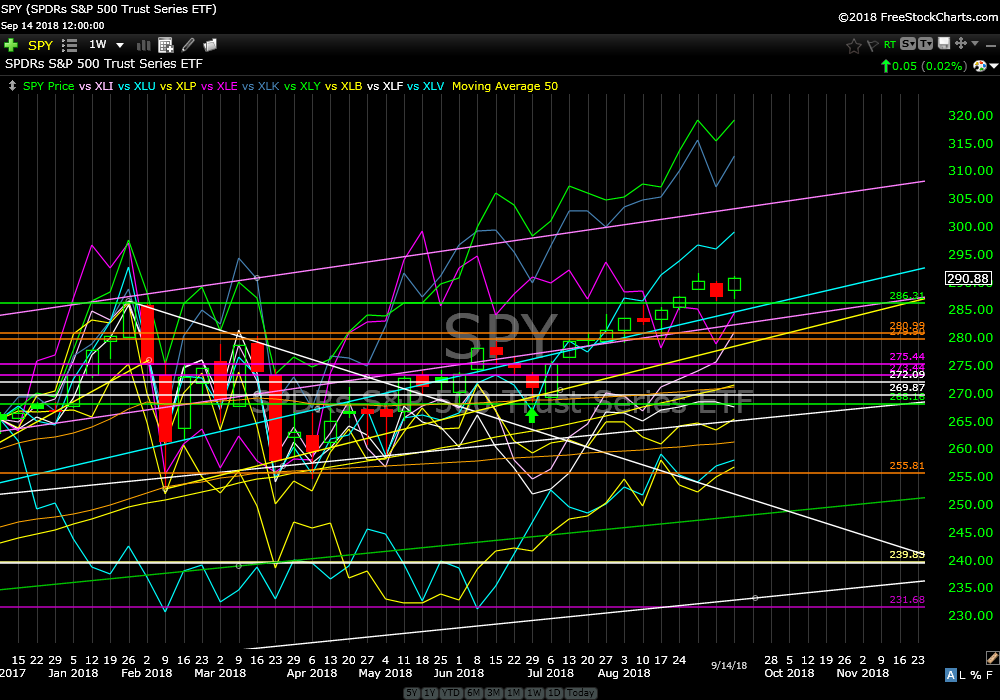
SPY, the ETF for the S&P 500 index, made a new all time weekly closing high. Looking good to my eyes.
SPDR’s S&P 500 Trust Series ETF (SPY) weekly
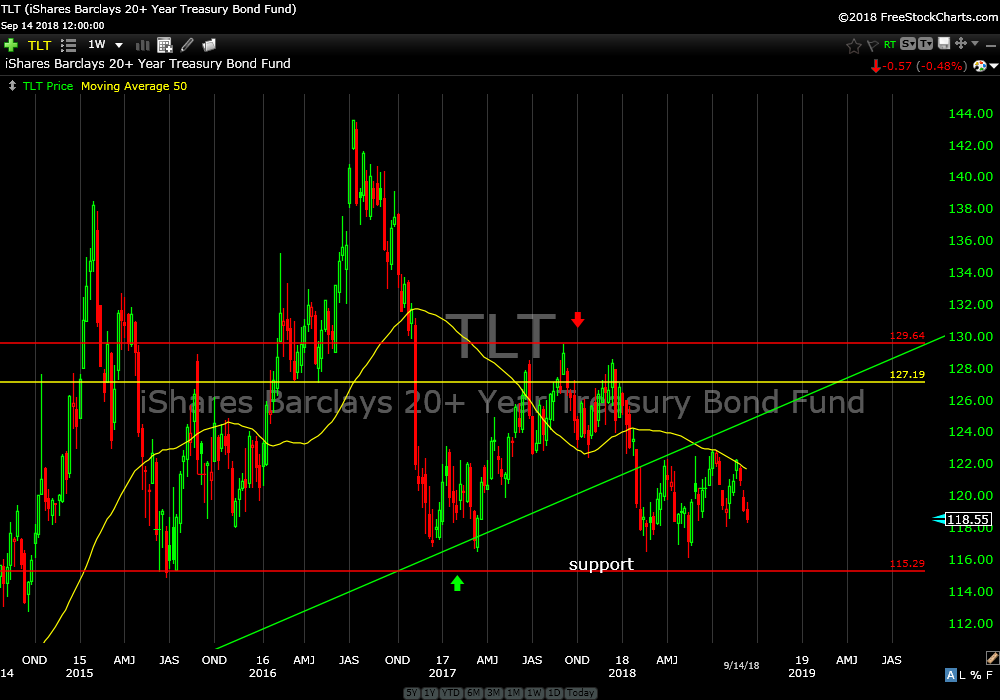
TLT, the ETF for 20+year Treasury Bonds, is still trading sideways. Above 115 is good.
iShares Barclays 20+ Year Treasury Bond Fund (TLT) weekly
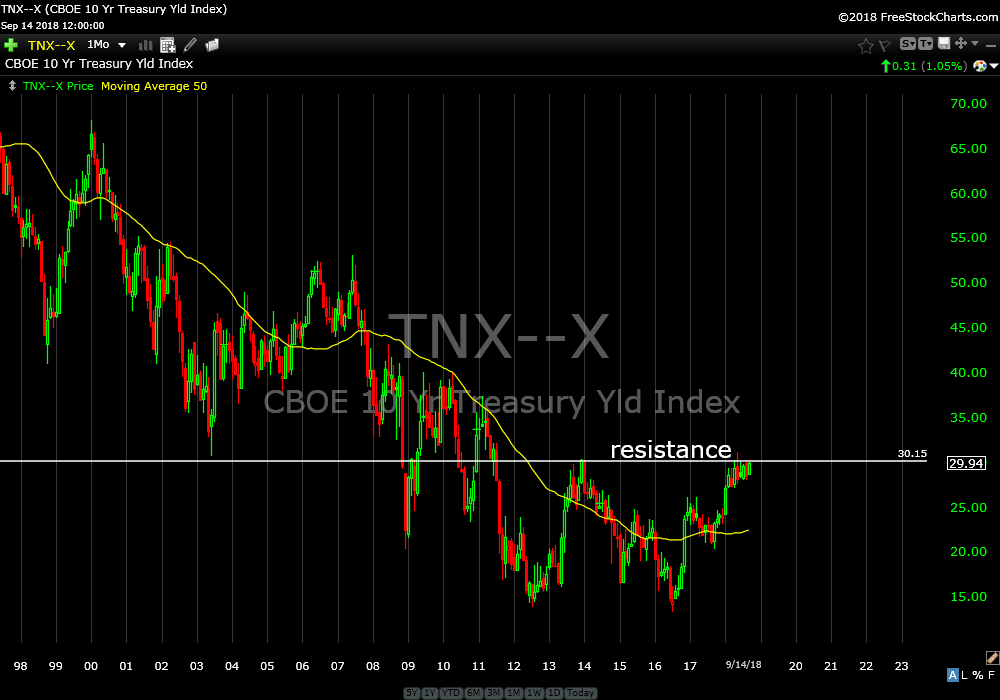
The 10 year Treasury Yield is banging on 3%…resistance. Below 3% is good.
CBOE 10 Year Treasury Yld Index…monthly
All S&P 500 sectors are mostly rising.
SPDR’s S&P 500 Series ETF (SPY) weekly comp
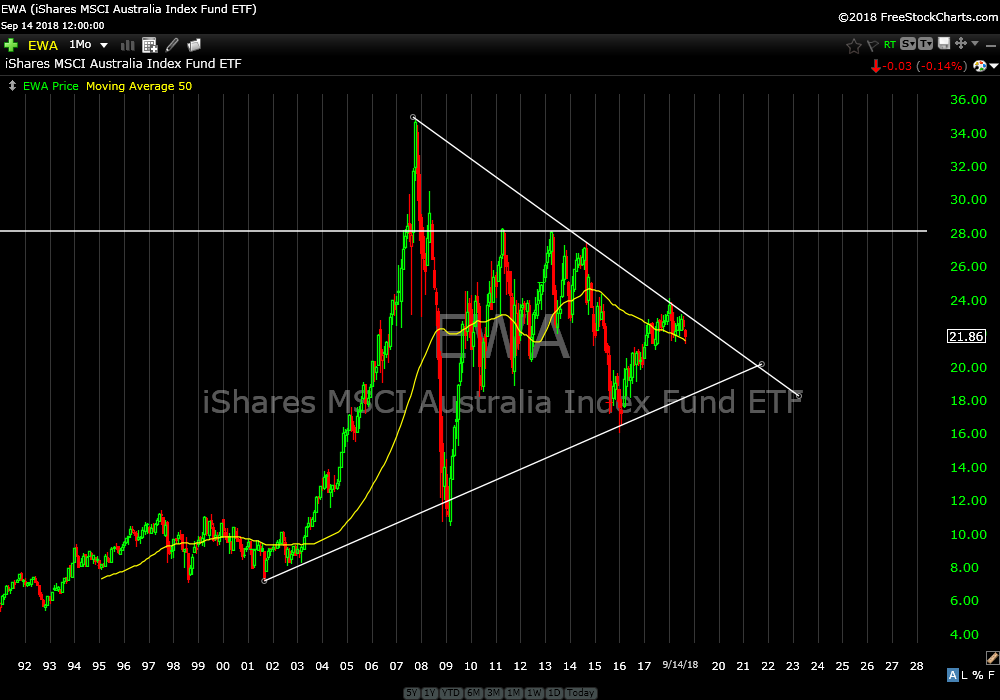
It’s almost Fall. 🙂 and finally, For my mates in Straya. What the kangaroo is going on down there? Your stock index looks like a half-eaten moldy day old can of vegemite. Just sayin’.
iShares MSCI Australia Index Fund ETF (EWA) monthly
Carry on mates,
Don