SPY, QQQ and XLK
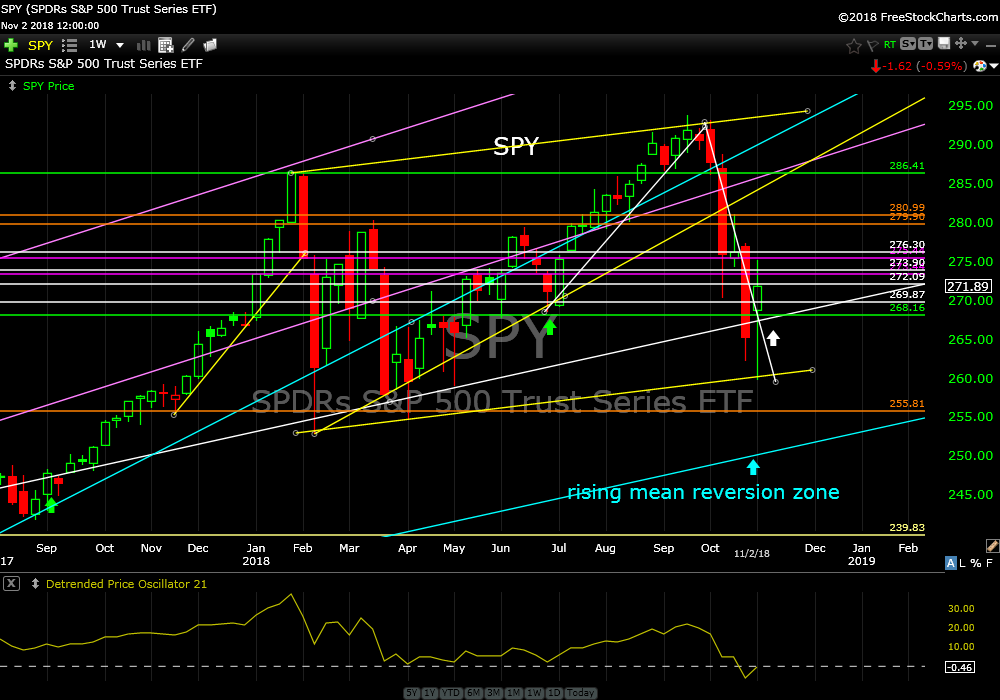
Another week with big range in most equity markets world wide. The S&P 500 index ETF (SPY) tested lower lows than the prior week but closed higher (slight positive). The low end of the range tagged short term support (yellow) on Monday then climbed higher all week. The high end of the week’s range was below the prior week’s high. I still think price is seeking rising mean reversion (blue). See SPY weekly chart.
SPDR’s S&P 500Trust Series ETF (SPY) weekly
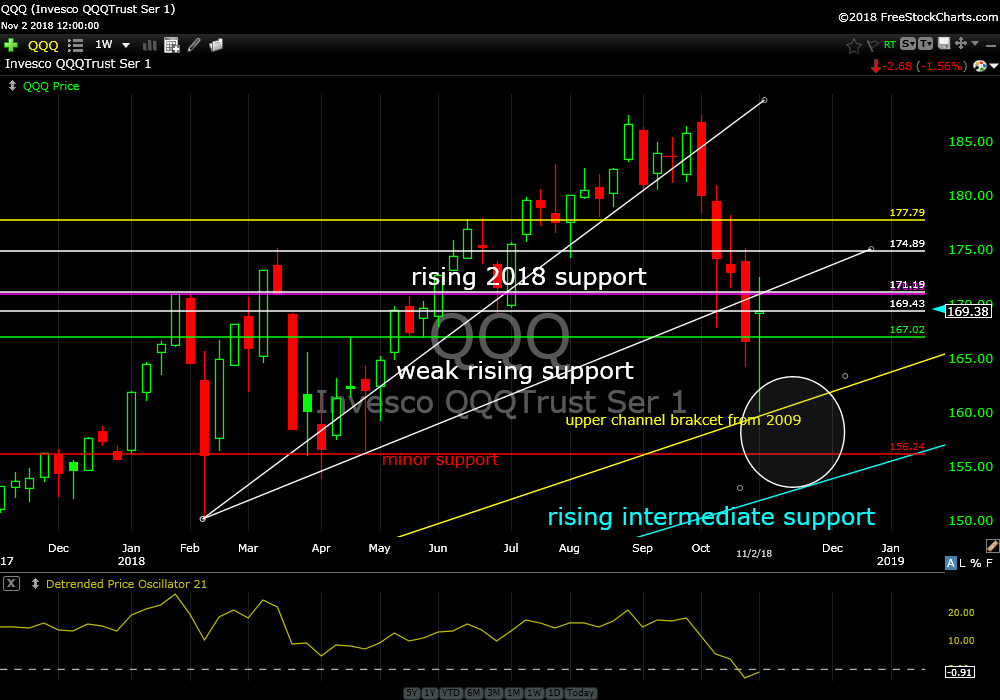
The Nasdaq 100 ETF (QQQ) looked similar. Price action tested much lower into support and retraced about half of the prior week’s range to end the week higher. Looks nice but me thinks it’s just reaction from being so oversold the prior weeks. I don’t think the selling is over.
Invesco QQQTrust Ser 1 (QQQ) weekly
The Technology Sector ETF (XLK) also went deep into enemy territory (down) and I was surprised they came out alive. Price did not quite get down into rising intermediate support (purple)…yet. To my eye, this is the logical place price action wants to go before making new highs.
SPDR’s Select SectorTechnology ETF (XLK) weekly
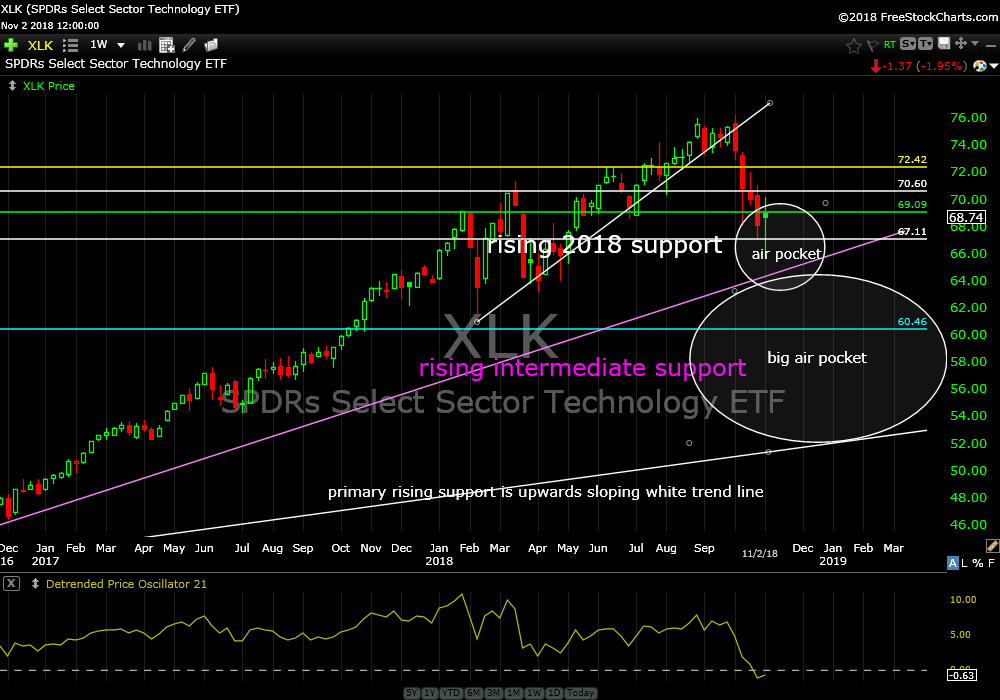
And…drum roll…where price action really wants to go is rising primary support. That would be the big mean reversion with the emphasis on mean. Let’s not worry about that today though.
Remember, these are just my opinions and anything is possible.
I think SPY, QQQ and XLK will work their way into these lower support levels to gain some equilibrium before having the chance for any meaningful expansion. If this occurs, this will be the time to put on more positions if bid up at these rising levels.
Energy XLE, KBR and USO
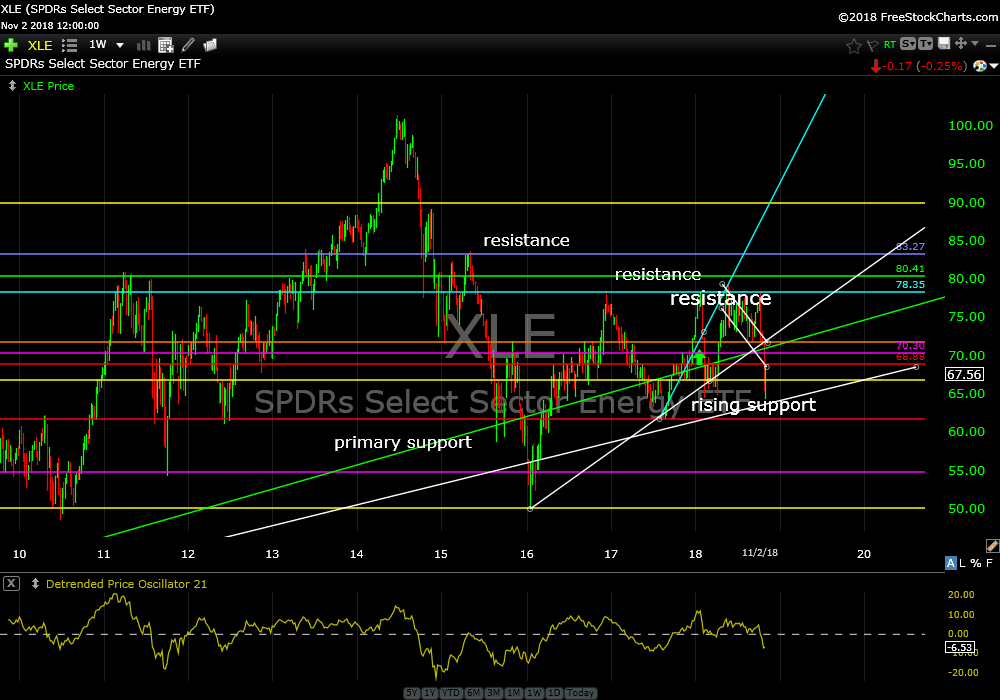
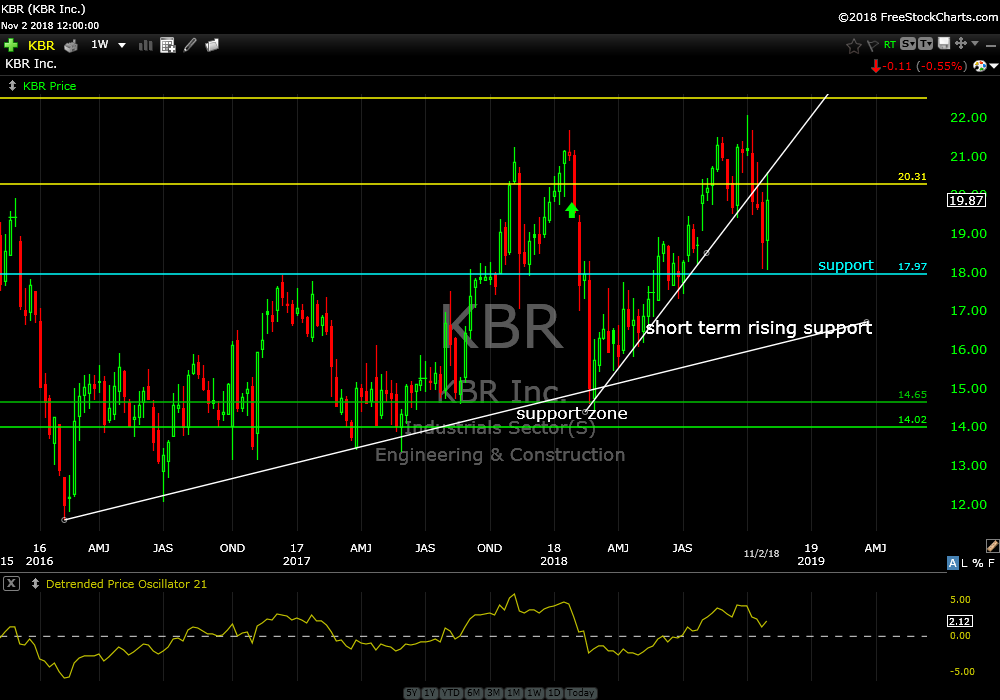
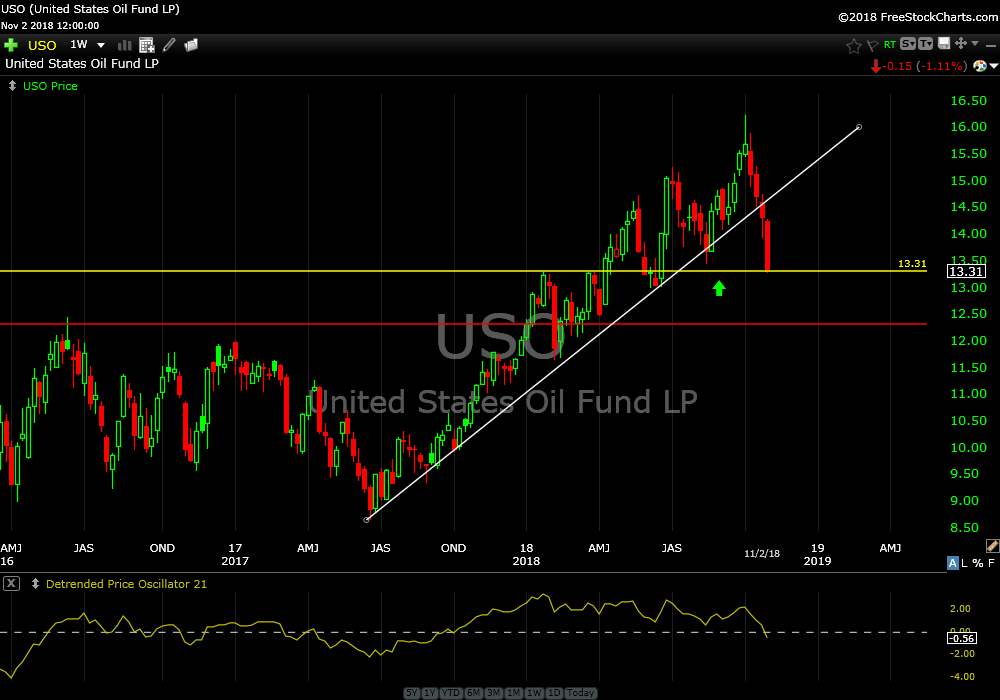
Crazy price action. For some reason this year when price action goes down in energy related it really goes down. Price is right where you don’t want to buy it and right where you don’t want to sell it. If you can’t stand the pain then sell. I’m holding for now at current support levels. Someone please remind me over and over that energy is always a hard trade.
SPDR’s Select Sector Energy ETF (XLE) weekly
KBR Inc (KBR) weekly
United States Oil Fund LP (USO) daily
Facebook Inc (FB) daily
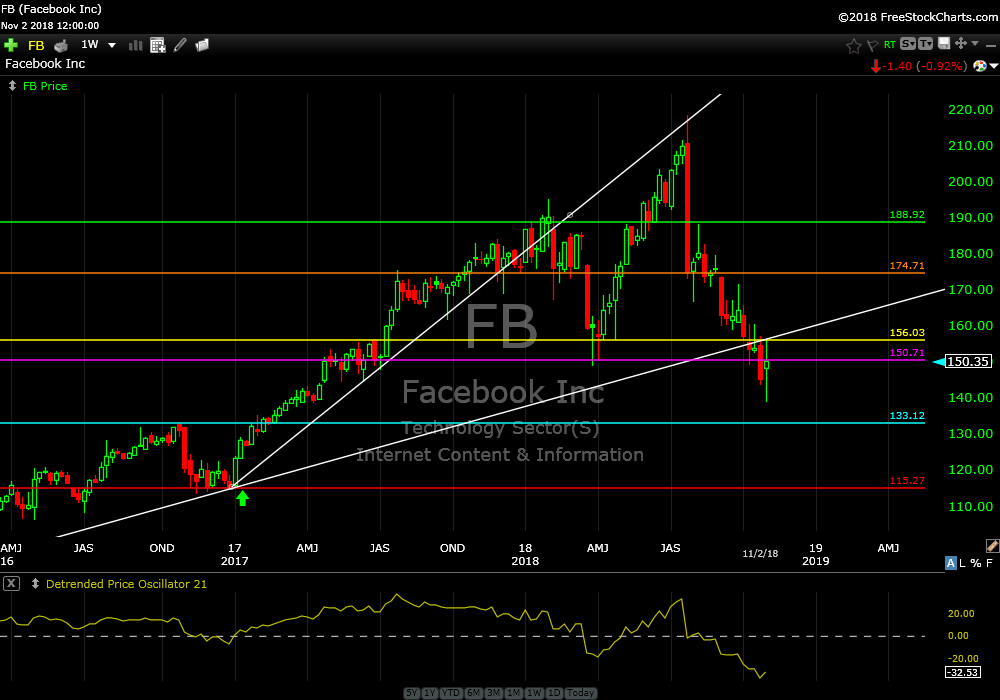
Time to sell. It has broken too much support and price wants to seek 133 so I’m recommending taking profits from January 17, 2017. Gain of about 17%.
SPDR’s Select Sector Health Care ETF (XLV) daily
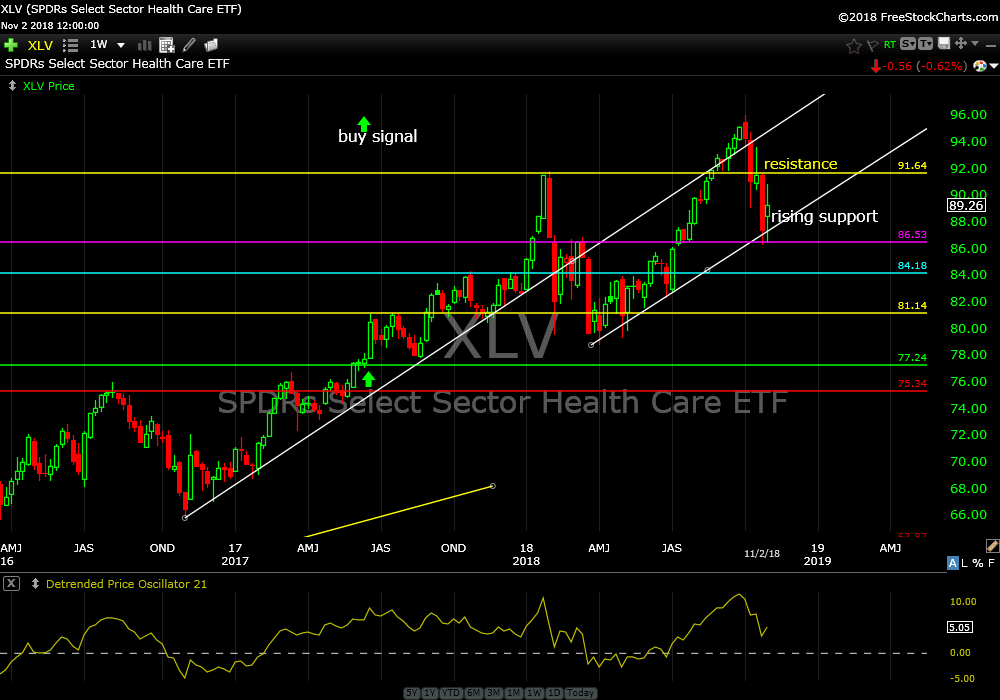
Currently up about 12% from June 2017. Price should continue compressing between rising support and resistance before breaking out. Long term trend is up, however, showing signs of weakness. Hold.
Square (SQ) daily
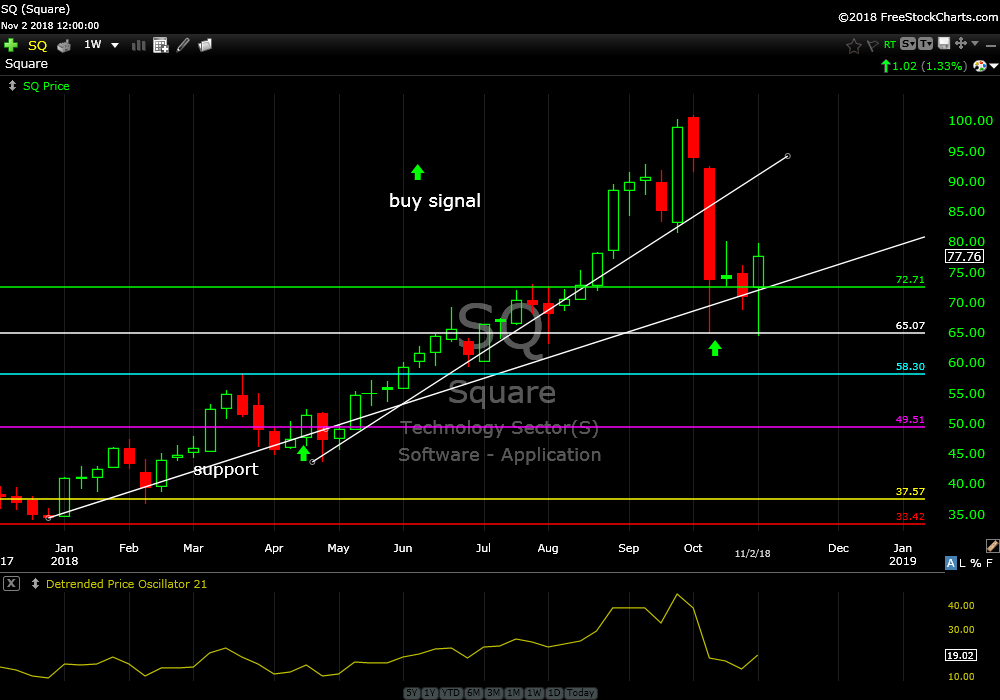
SQ has mostly been a ripper. Up about 53% from my recommendation on April 23. It suffered a break of two short term support zones during Octobers sell off but has outperformed the broader market since and closed above the longer and stronger support zone. Continue to hold.
SPDR’s Select Sector Utilities ETF (XLU) weekly
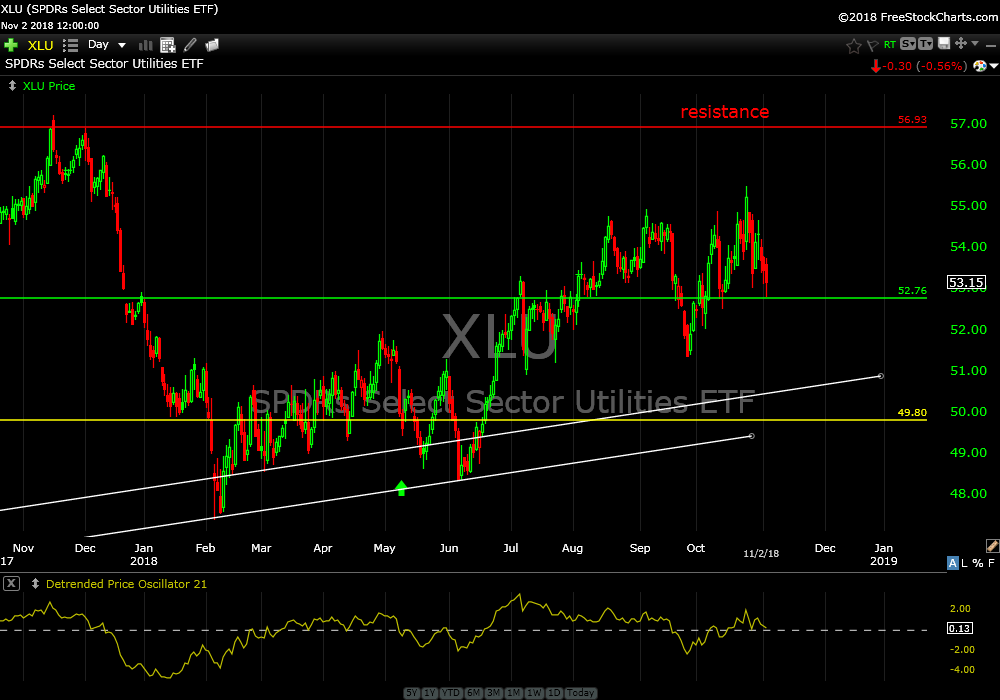
XLU is up about 3.5% from my recommendation on May 7. It is approaching resistance (red) at $57 which will be the next hurdle. Continue to hold.
Total System Services (TSS) daily
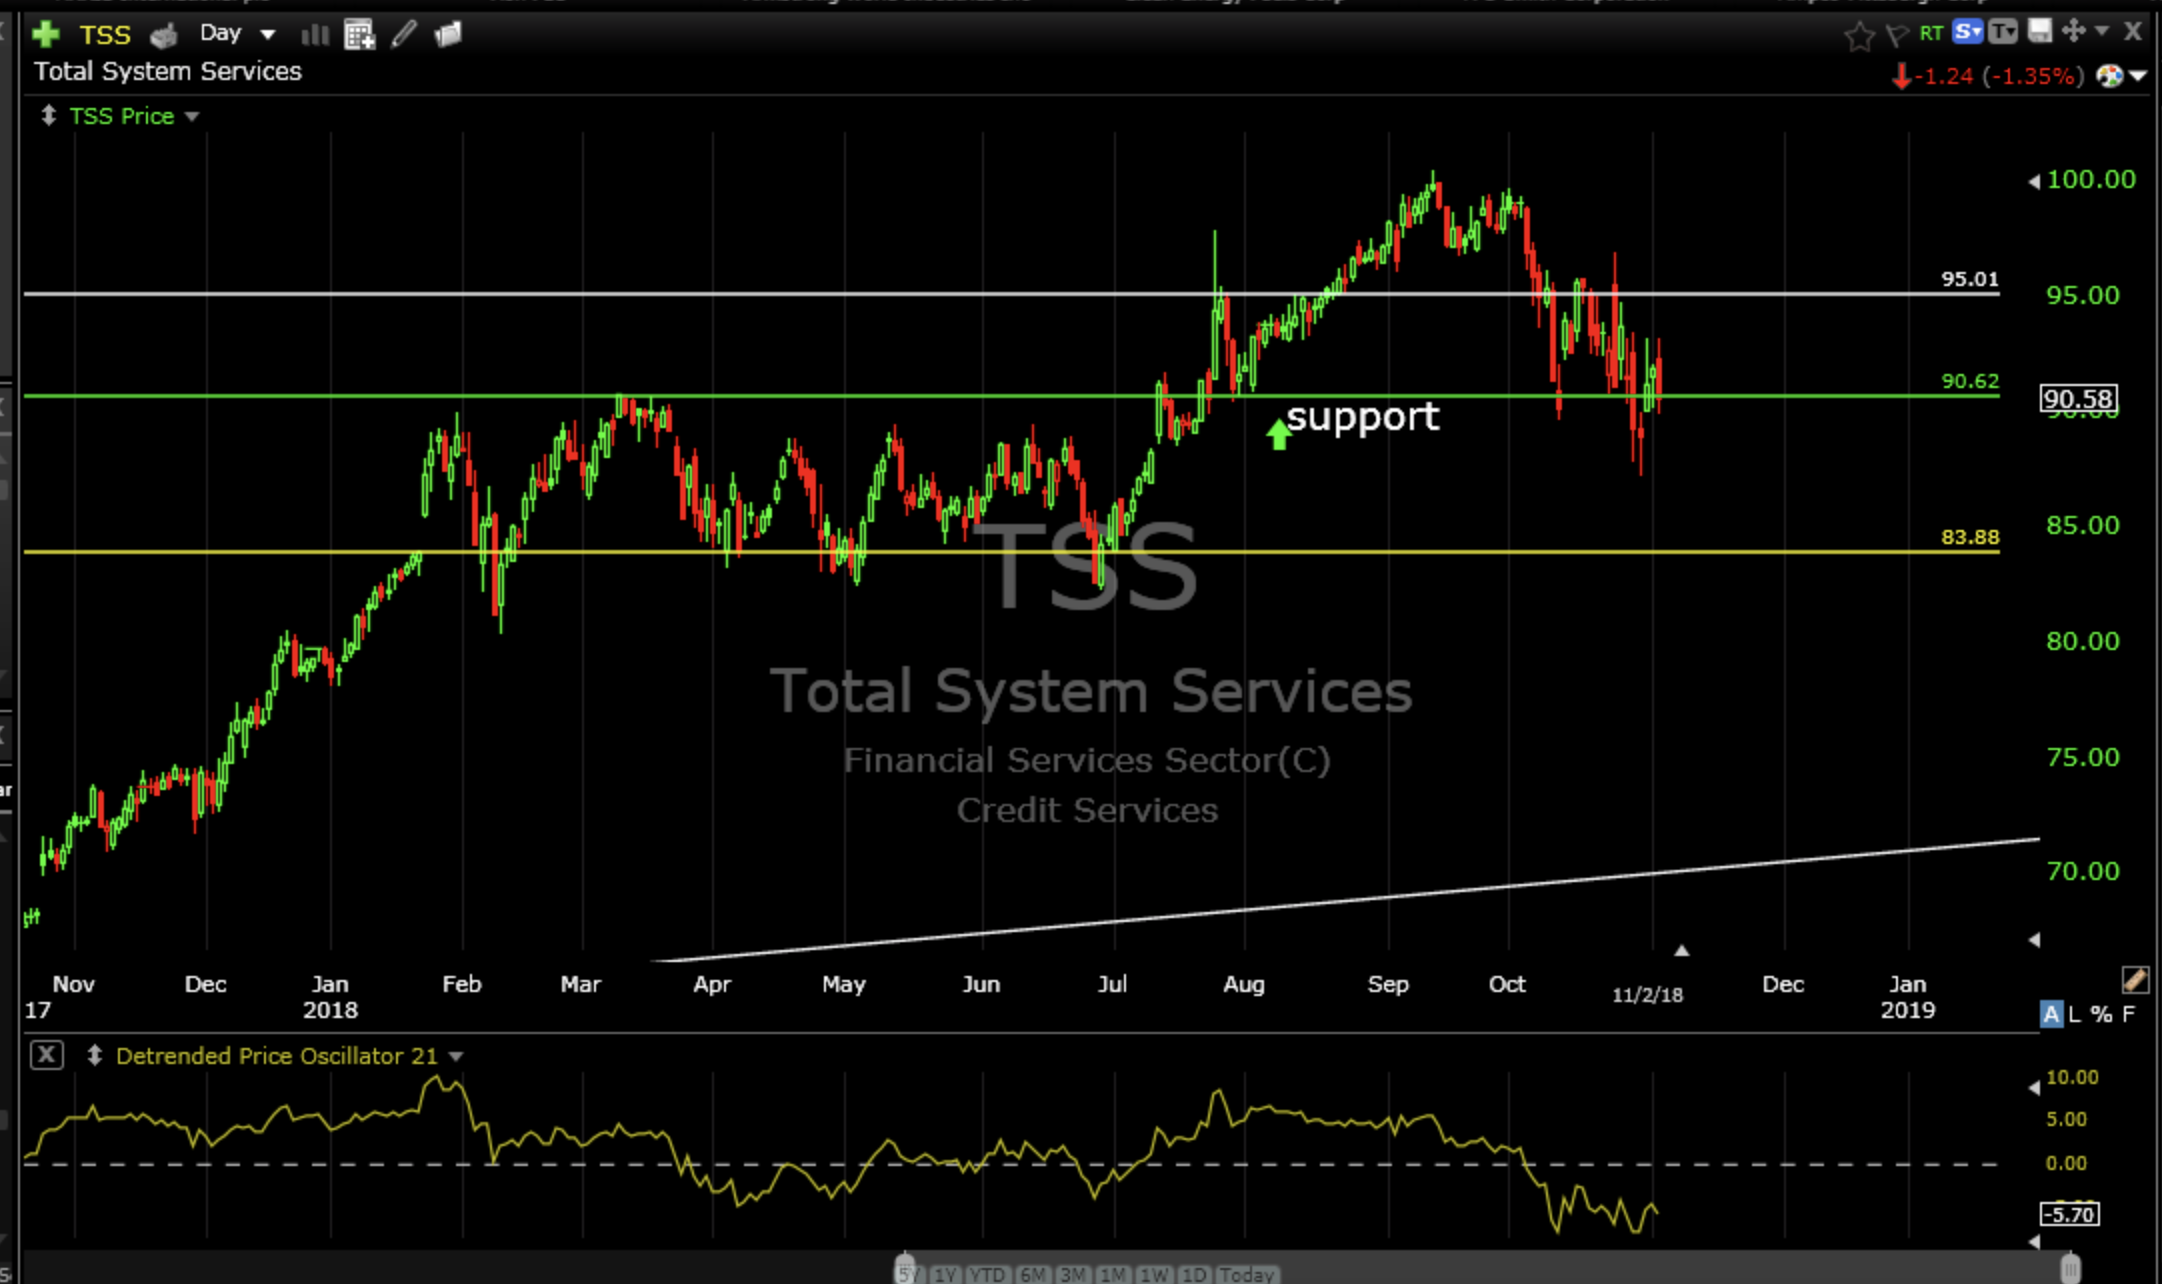
Down about 2.5% from my recommendation on August 6. Outperformance considering the financial sector ETF (XLF) is down 6% during that period. Hold considering price is right on top of support.
Norfolk Southern Corp (NSC) daily
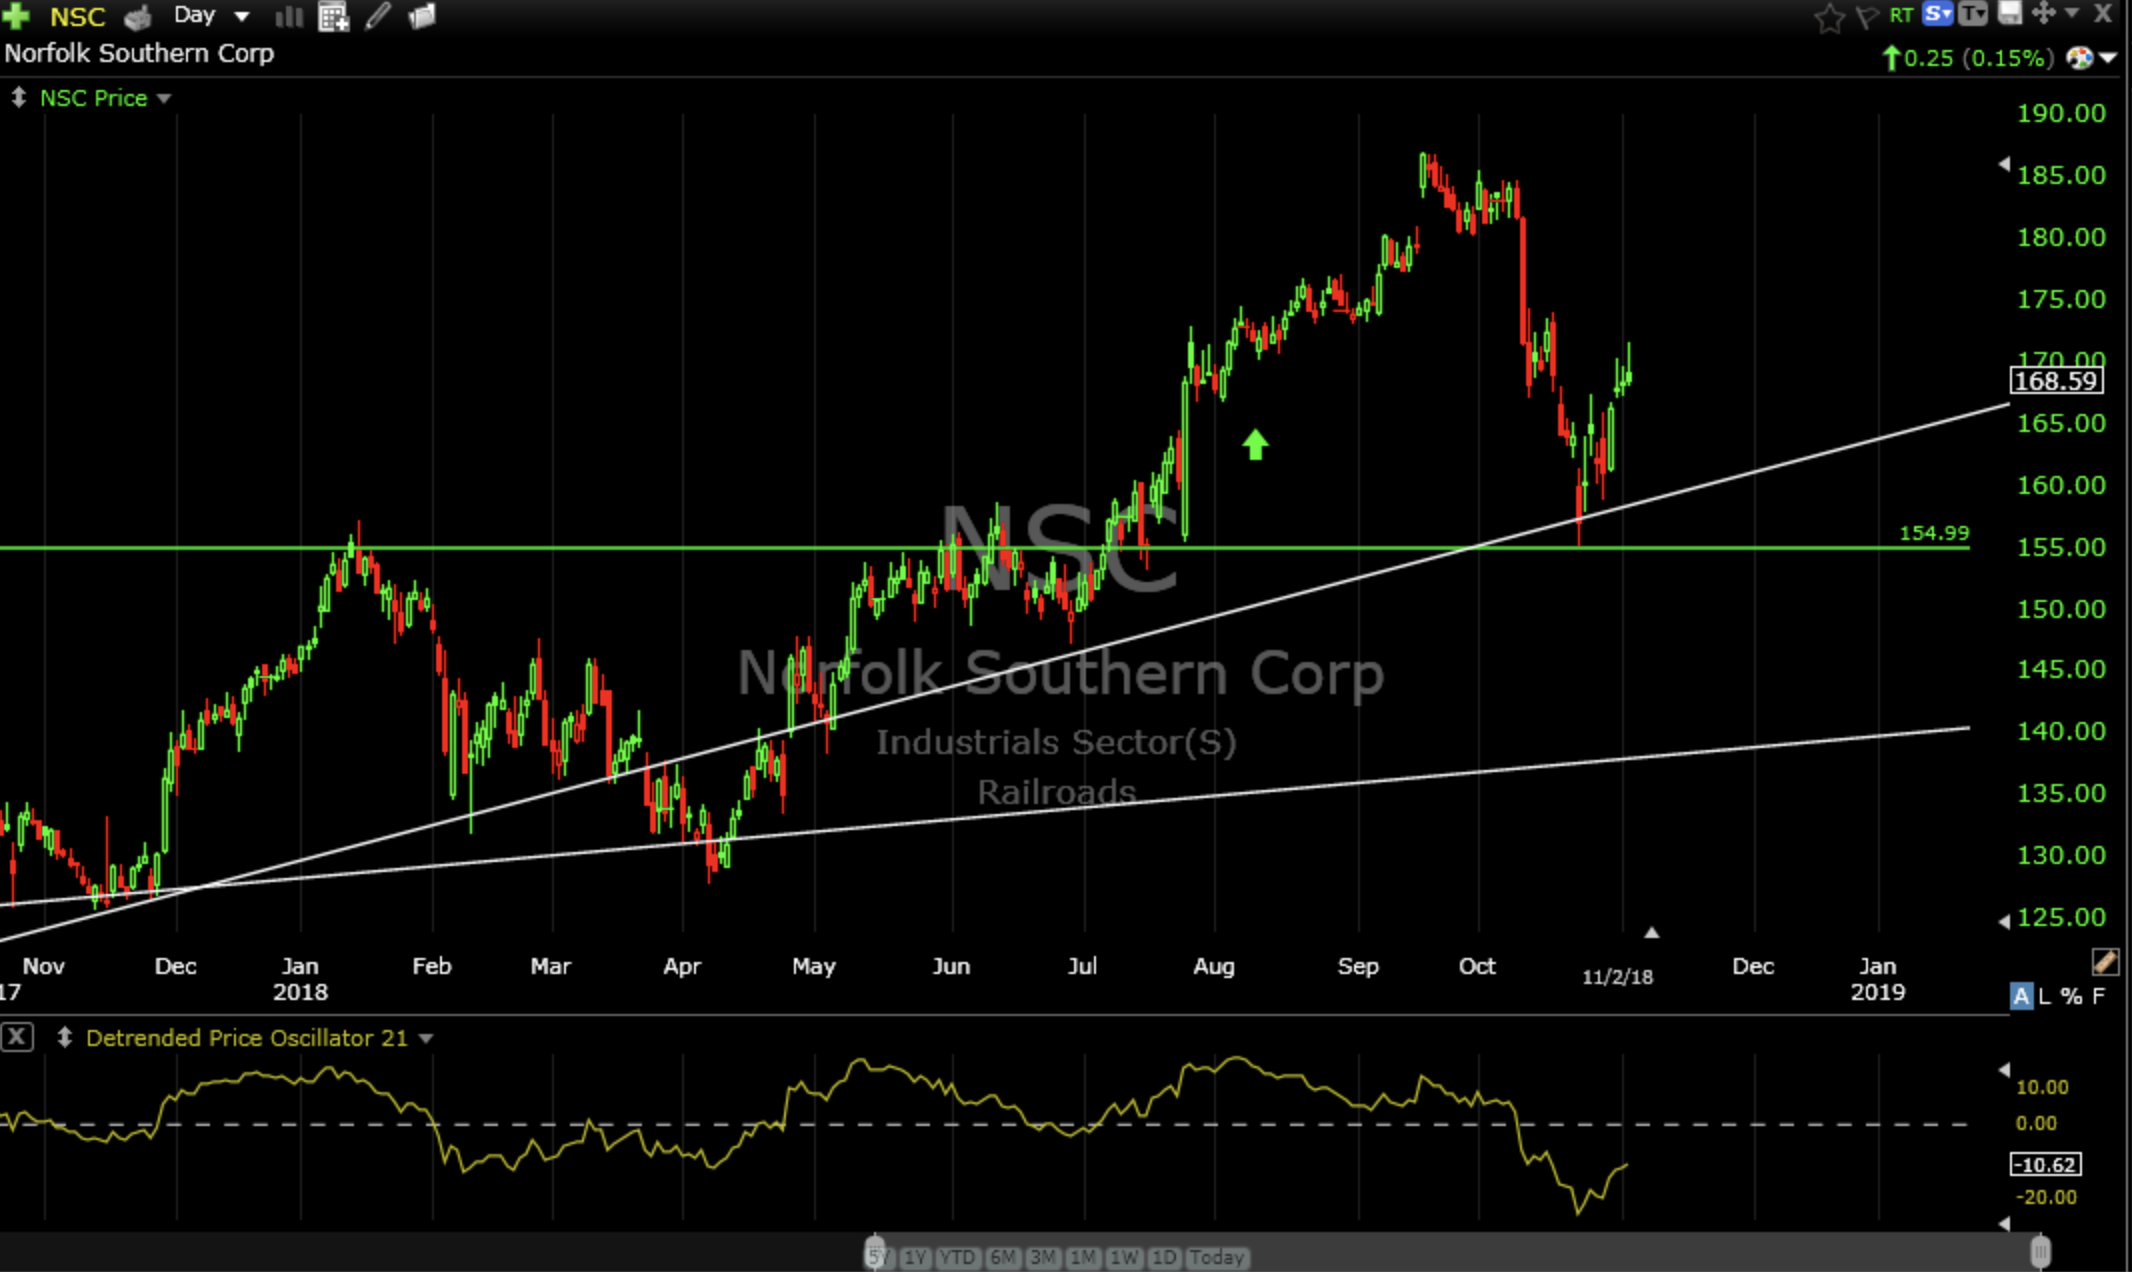
Down about 2% from my recommendation on August 6. Price has since sucked back into rising support and is making it’s way higher. Continue to hold.
Costco Wholesale Corp (COST) daily
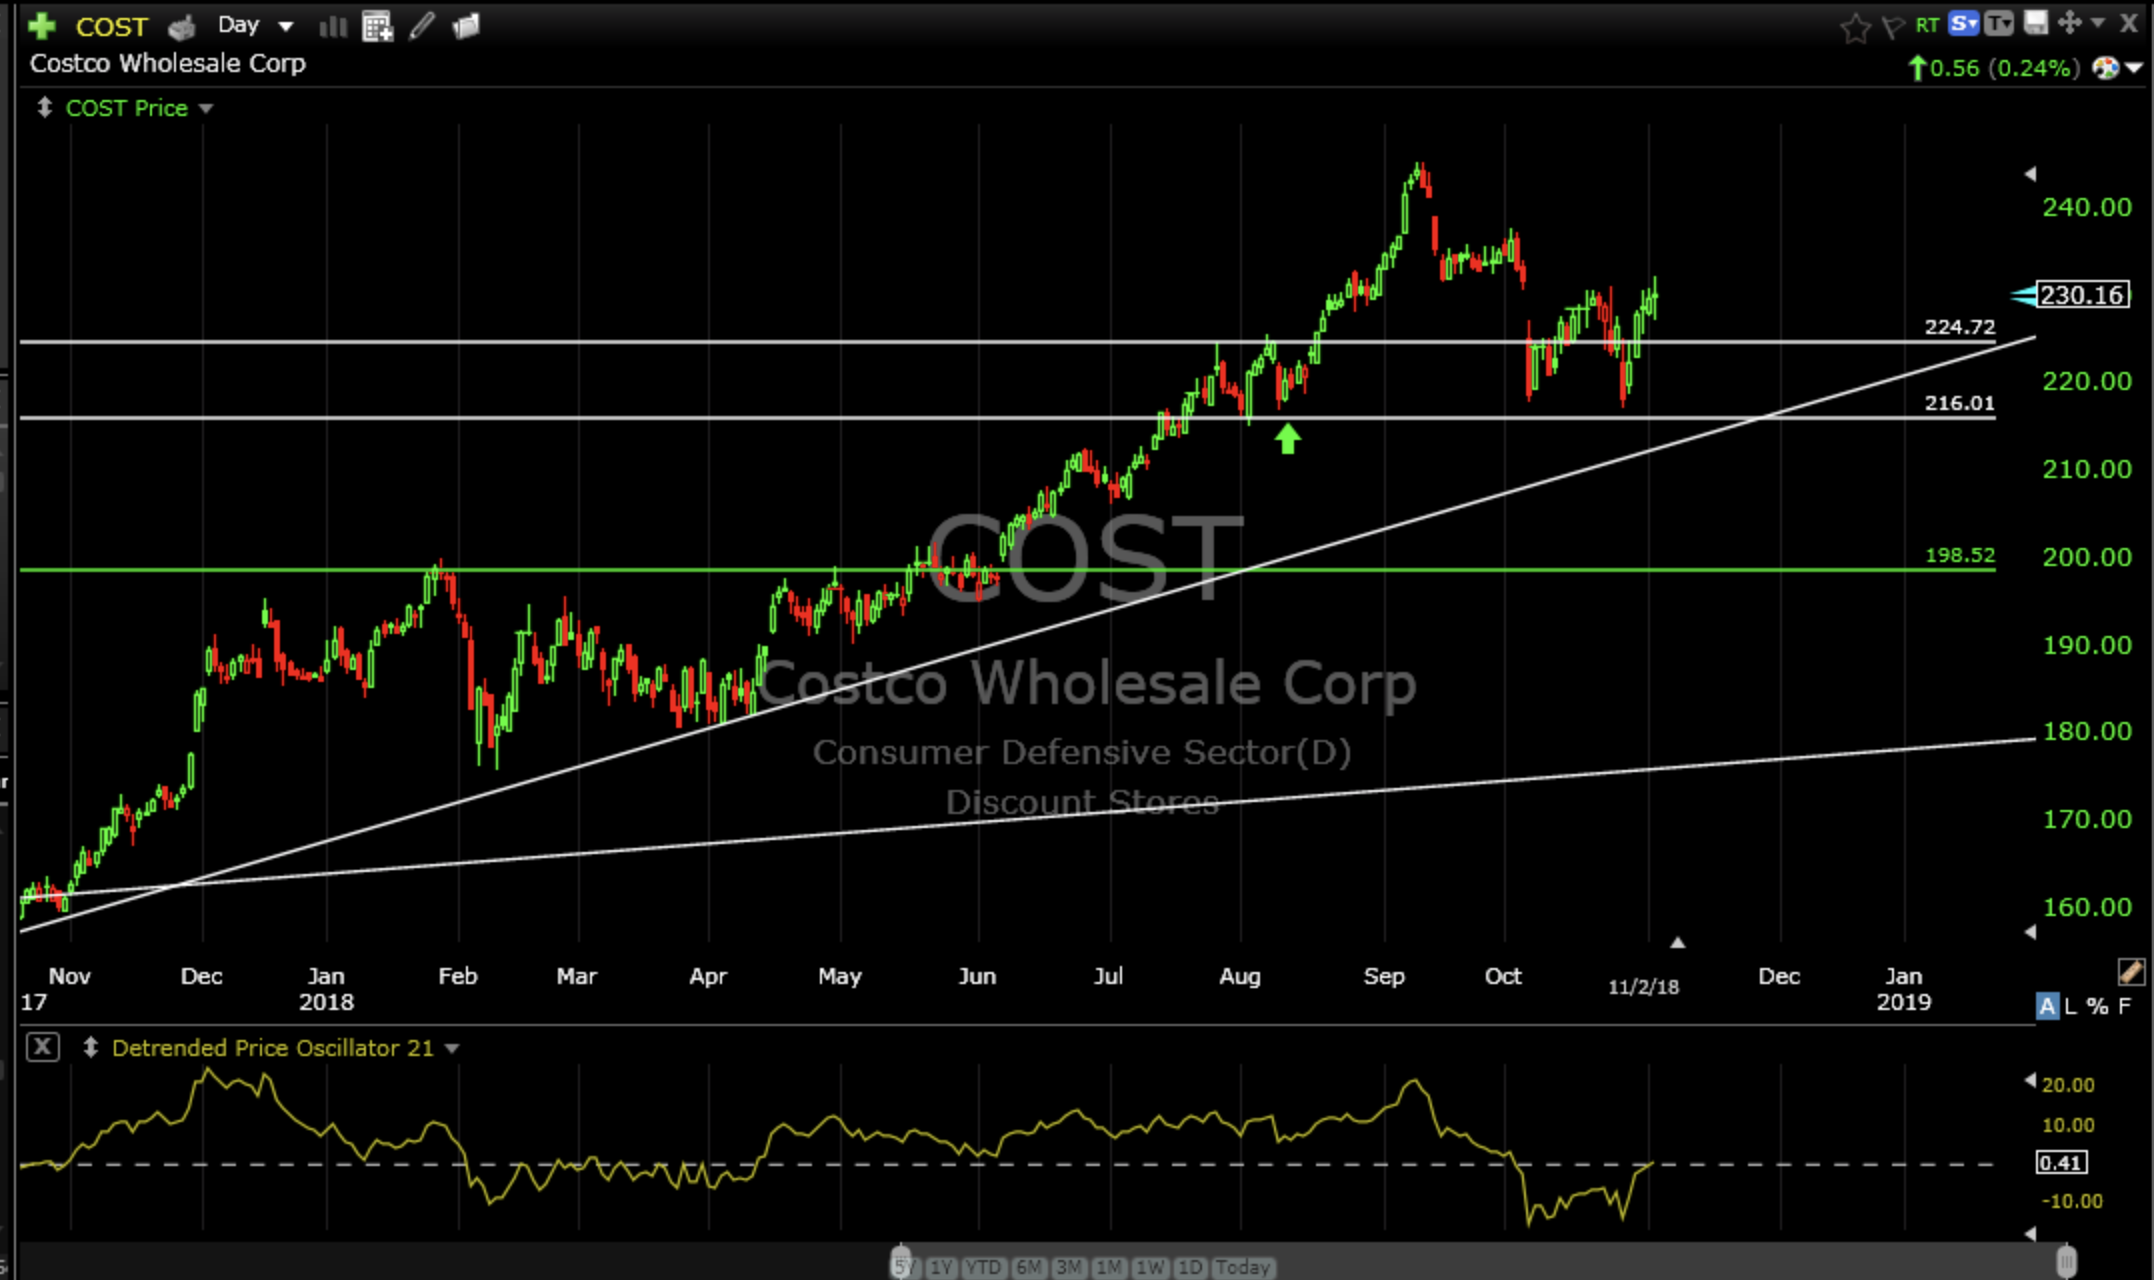
COST is up about 3.5% from my recommendation on August 6 while the retail sector ETF (XRT) is down about 4% during that period. Probably because I end up in Costco every other day. Look for lost old man in cookie section.
Intel Corp (INTC) daily
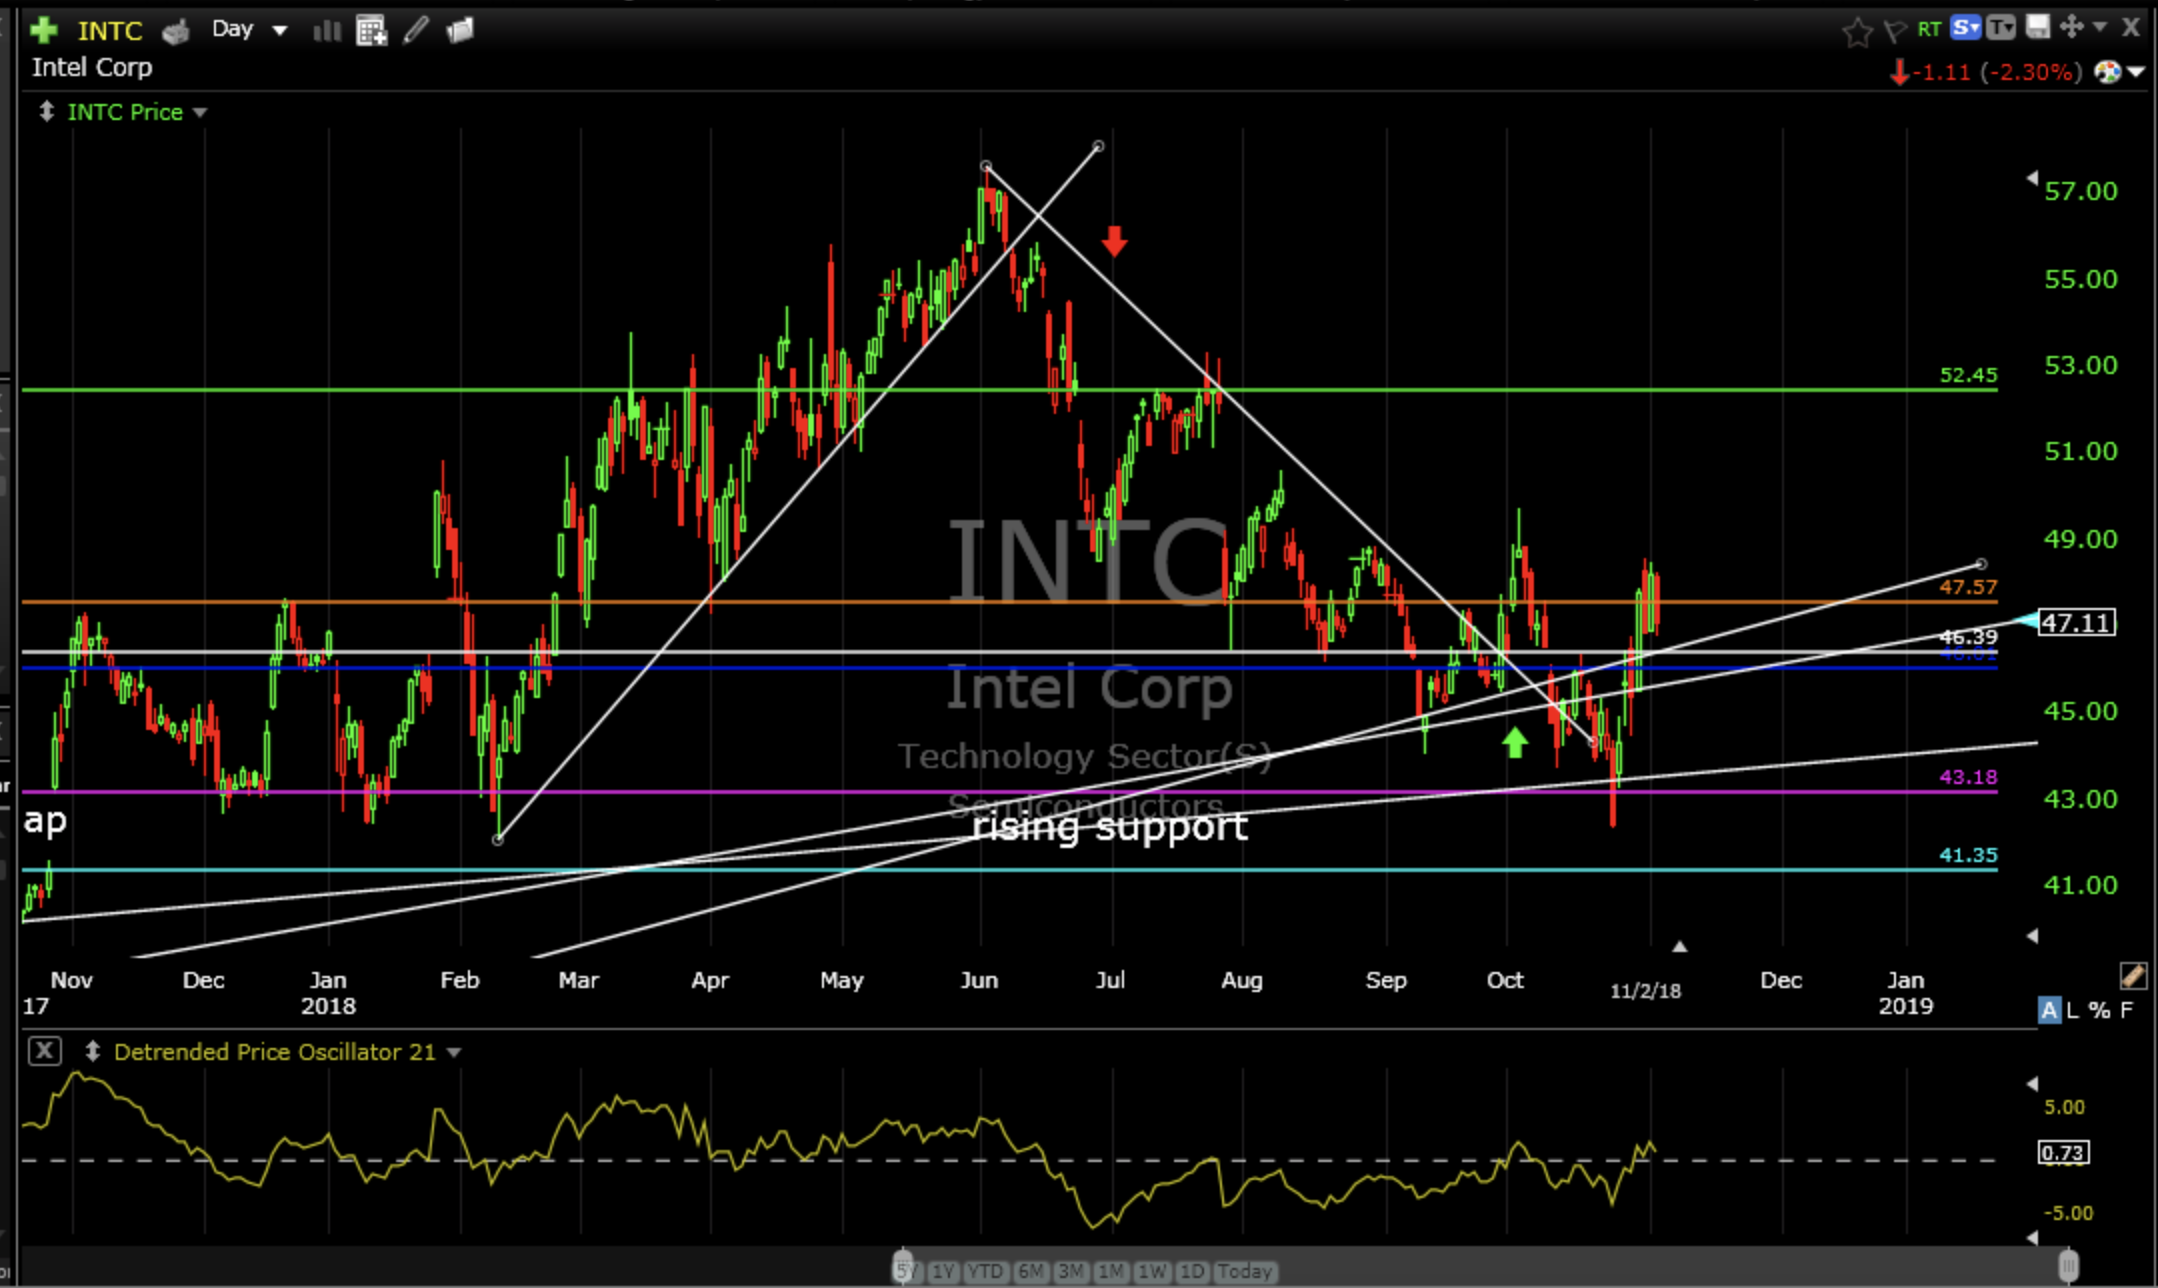
After selling INTC in July for a 25% gain I recommended it again on September 30. It is currently break even. Hold it for now as it is still above support.
Visa Inc (V) daily
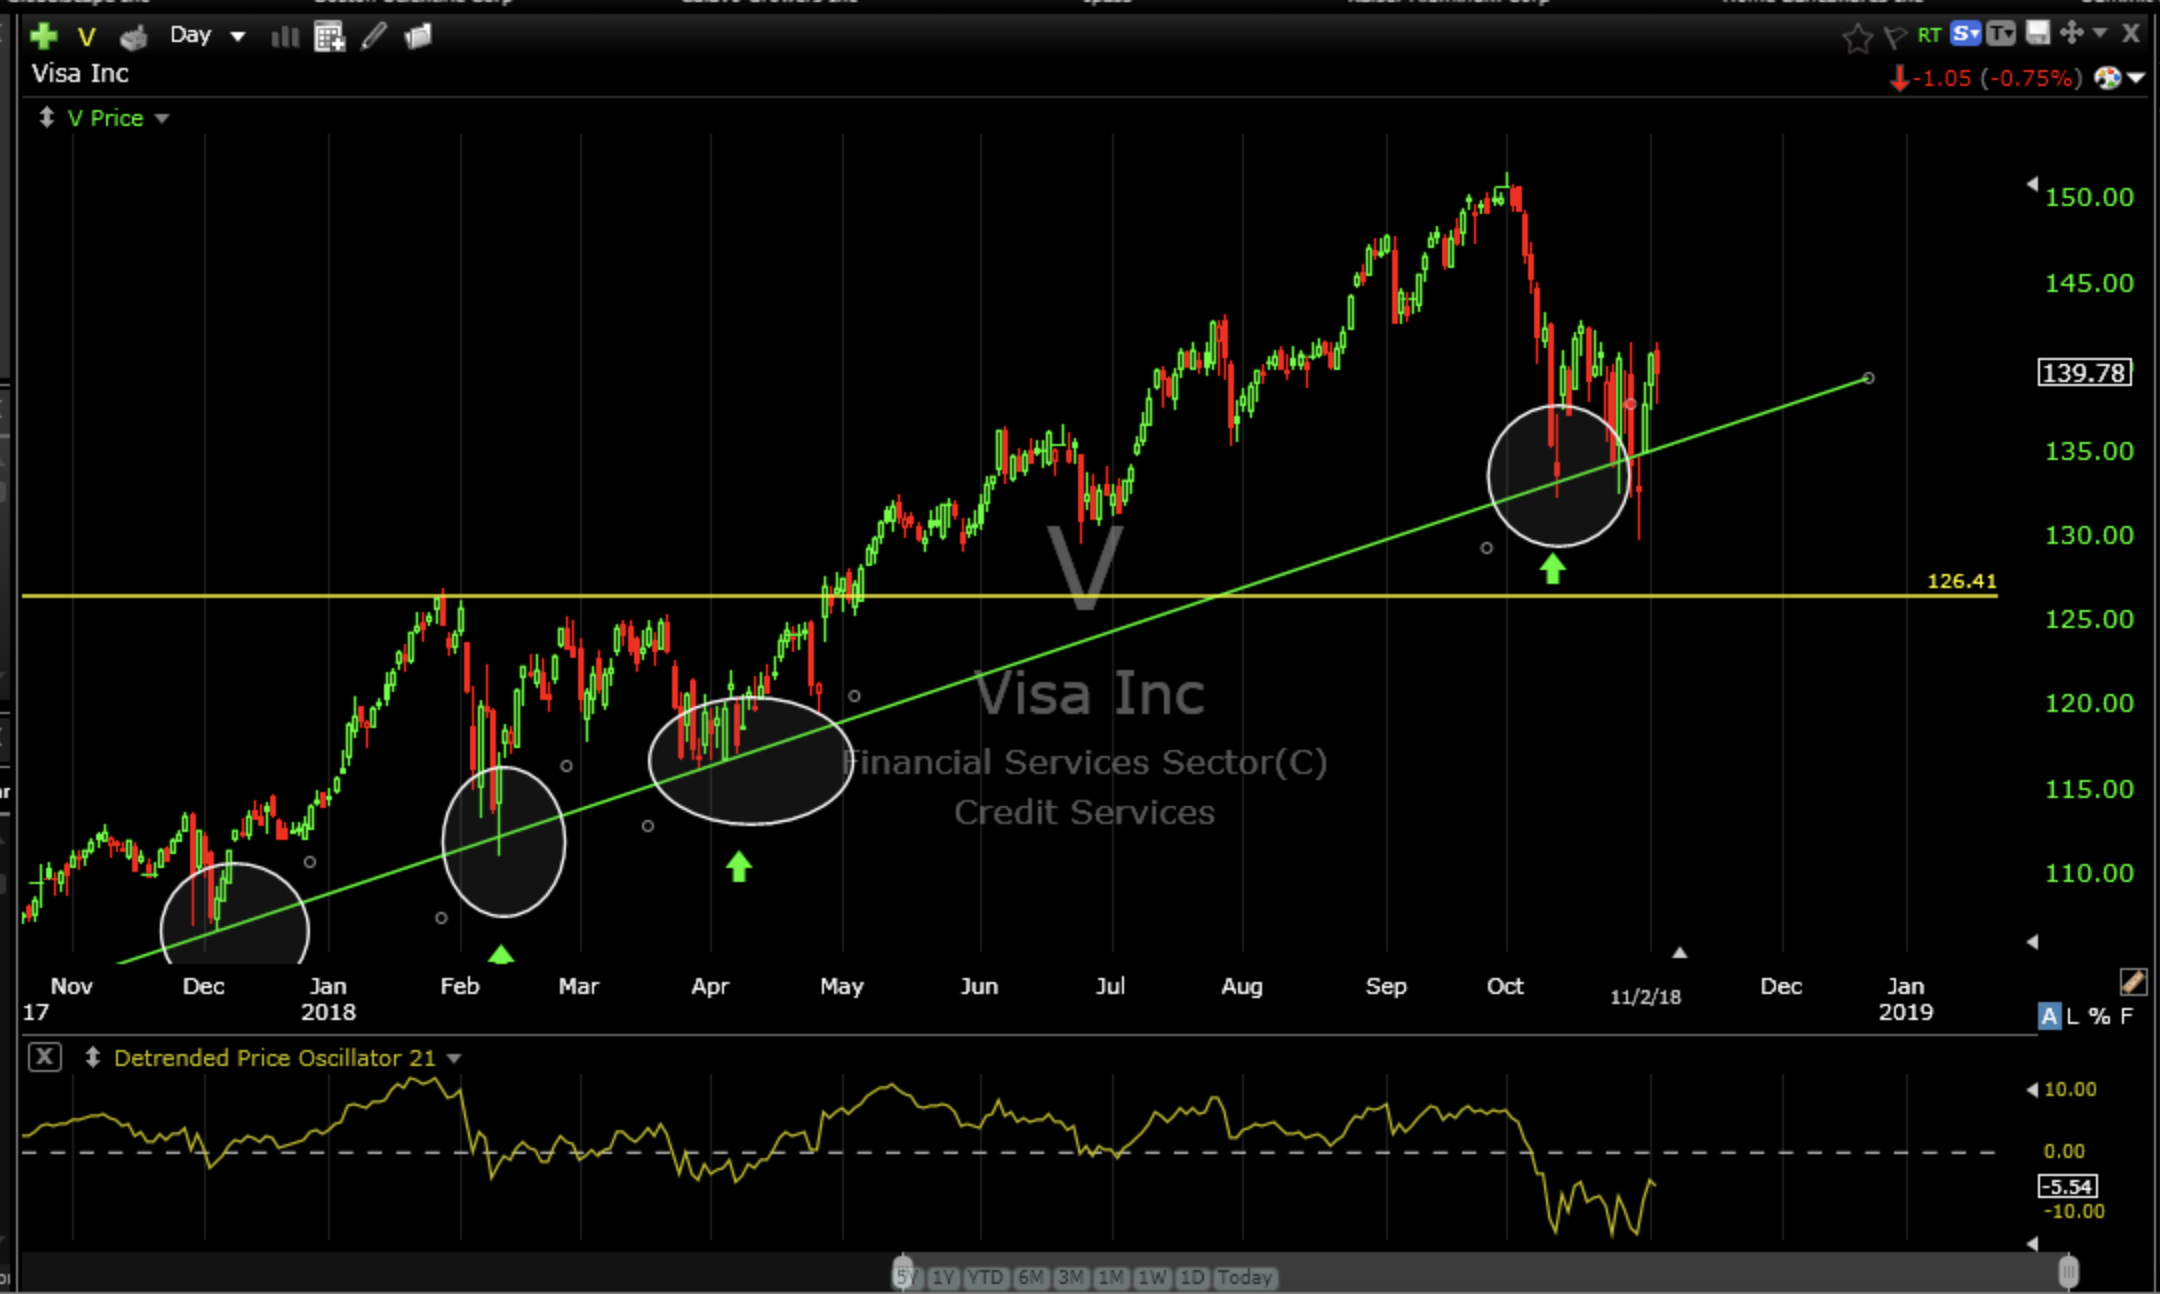
I recommended V on October 19 after getting bid up at rising support. Support is still intact. Continue to hold.
Concluding Thoughts
I don’t think the selling is over. I have explained my first level of downside targets concerning SPY, QQQ and XLK. I believe these levels need to be “backfilled” to find price equilibrium before another sustainable leg up begins.
Please note I recommended reducing equity exposure in early July selling all of the following:
Retail…
International equities
European equities
Financials
China
Emerging markets
Then in September…
Social media
Mexico
Then on October 8th two days before the S&P 500 began to tank I recommended selling the semiconductor index ETF…
SMH
They are all down since…
As you can see the technical analysis I practice gave us the clues to begin reducing equity exposure back in early July and into early October before the big sell off.
The other clues I warned with were bonds breaking multi-year support on October 3rd, semis (SMH) breaking multi year support on October 4th along with Nasdaq (QQQ) and the tech sector ETF (XLK) the same day…4 days before the big S&P 500 break (October 10).
It ain’t perfect but it beats the crap out of buy and hope or the occasional rebalance. Do you see how we organically reduced exposure as different asset classes/sectors began to fail? It worked just like it’s supposed to. It was like the dominoes started to fall during the summer and into September and, as they fell, we sold them and avoided the subsequent freefall that many in the buy and hold camp did not avoid. Oh, by the way, we made money on all of those trades as well.
Now I’m looking for more mean reversion before putting on more risk. I think less exposure is better than more exposure until current market action finds some peace and quiet to resume a more sustainable uptrend.
If you have any questions on individual stocks, ETF’s or whatever just send me an email and I would be happy to respond.
Have a great week.
Trade Smart,
Don