Price action last week was positive with most major indexes closing higher than the previous week. The week started out a little rough with Tuesday and Wednesday selling off then a big push higher Friday afternoon.
I still expect more back and fill with testing of the SPY rising support zone that held the weekly close during the big dump three weeks ago. This support zone is represented by the upwards sloping light blue line on both the weekly and daily charts. This trend line dates from January 2016 so it’s fairly significant.
Resistance is 275.41 which is the low from February 2nd. This price level was tested and rejected a week ago Friday and it looks like a re-test will be coming this week.
By no means do I think volatility is over. Bond prices are nearing a multi year support level and until this gets tested expect volatility to remain high. This support level is 115 represented by the horizontal red line on the weekly chart of TLT. We don’t want to see 115 violated.
Nudge that seat belt a tiny bit.
SPDR’s S&P 500 Trust Series ETF (SPY) weekly

SPDR’s S&P 500 Trust Series ETF (SPY) daily

SPDR’s S&P 500 Trust Series ETF (SPY) daily (c)

iShares Barclays 20+ Year Treasury Bond Fund (TLT) weekly

KBR got slammed Friday right into multi year support. Sell it if you wish but I’m holding. This is the exact price zone that propelled price in August of last year.
KBR Inc (KBR) weekly

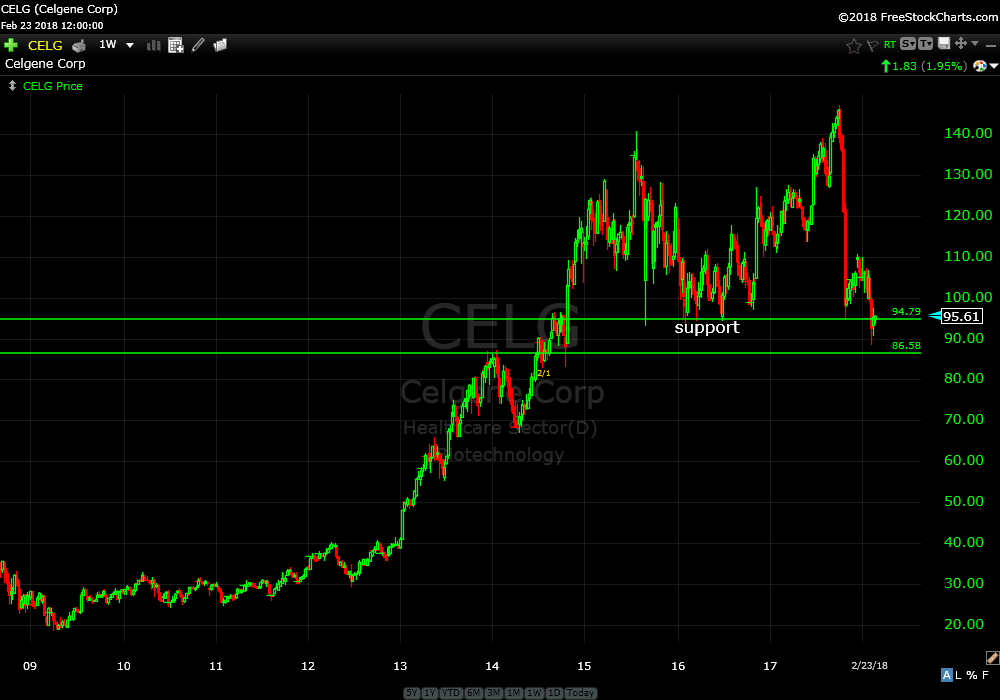
Celgene Corp (CELG) is starting to look interesting. This one has the potential to run up 20% in a hurry.
Celgene Corp (CELG) weekly
Is Netflix selling tulips? The monthly chart that gives me pause. Hmmm…
Netflix Inc (NFLX) monthly

Isn’t this fun?
Continue to hold all open recommendations.
Trade Smart,
Don