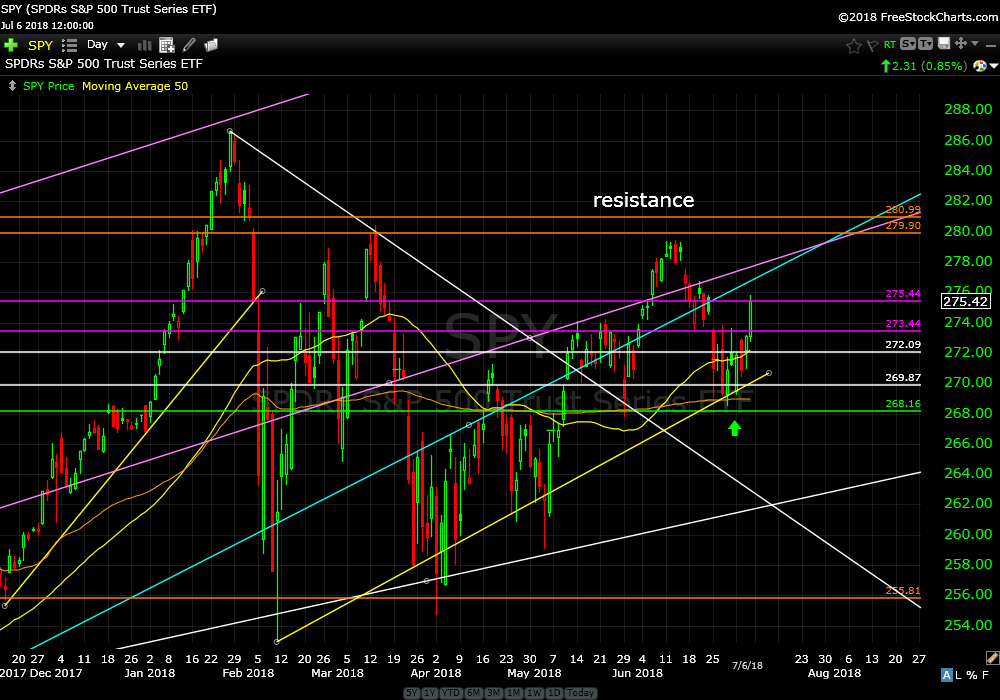
Two weeks ago I wrote that it was likely SPY would correct 2%-3% into support and if bid up I would recommend buying more. It did correct 2%. It was bid up exactly at support. I did recommend buying more. Don’t you just love it when a plan comes together?
So far, so good. SPY is up 2% from my Monday morning recommendation. Continue to hold all SPY positions from the past 7 years.
SPDR’s S&P 500 Trust Series ETF (SPY) daily
Hold
+2%
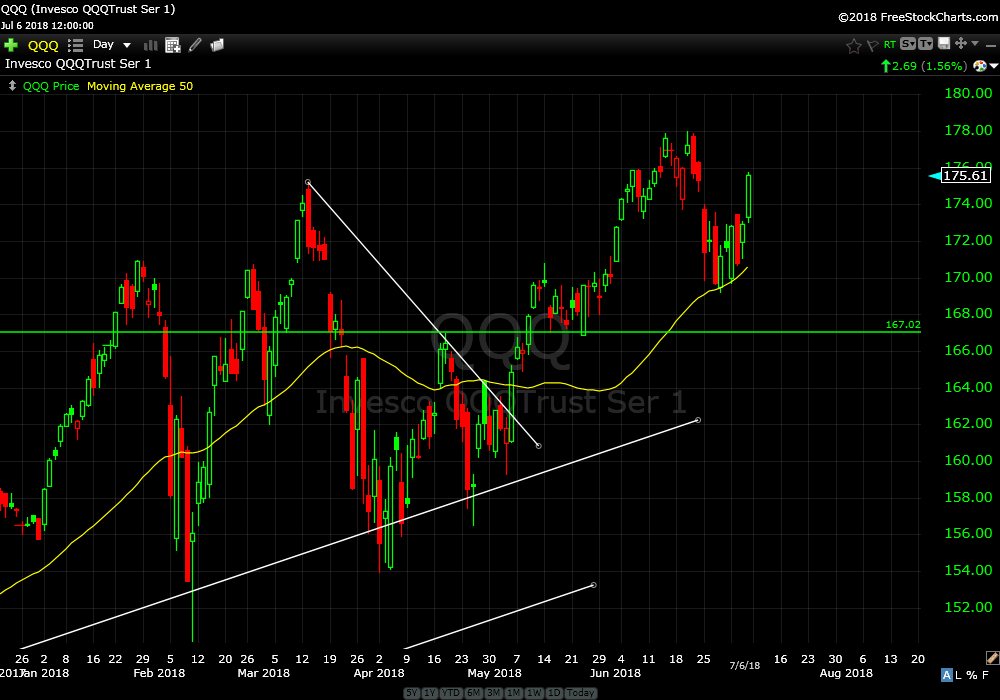
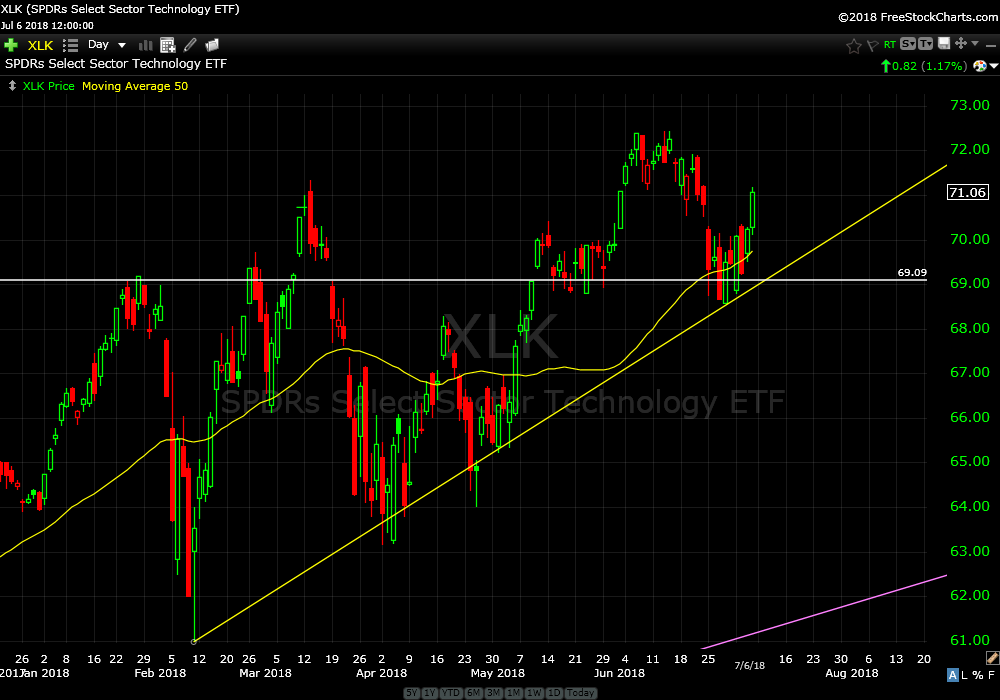
Continue to hold all QQQ and XLK positions. Technology just continues to rip.
Invesco QQQTrust Ser 1 (QQQ) daily
Hold
SPDR’s Select Sector Technology ETF (XLK) daily
Hold
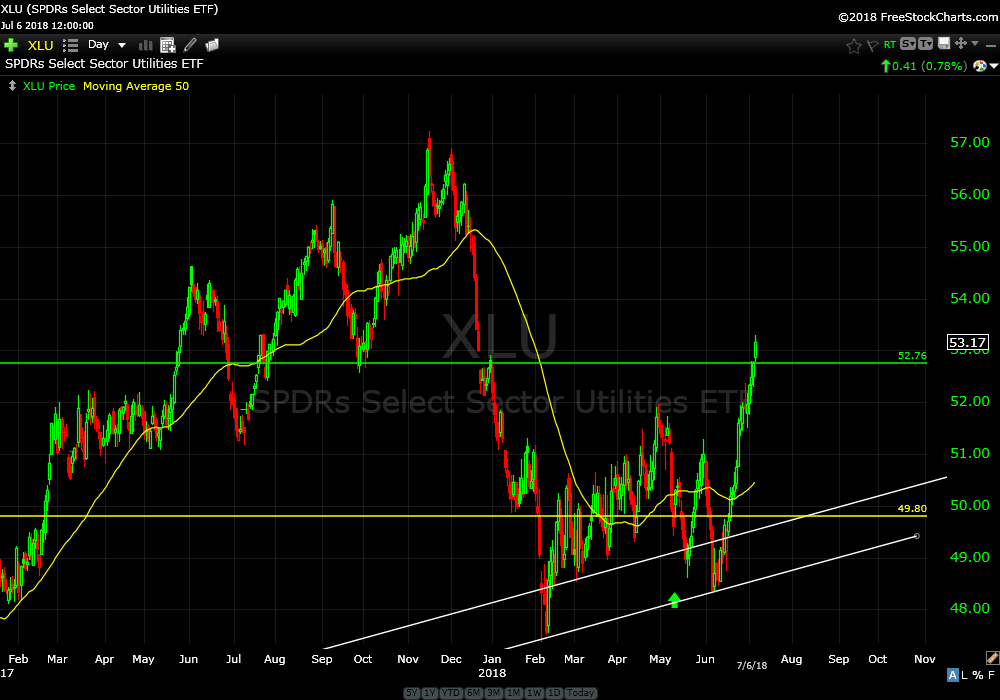
I recommended buying the utility sector ETF (XLU) on May 7th. Shortly thereafter, XLU started out performing the broader market ETF (SPY). Price has shot up about 3 1/2% from my recommendation. It closed today just above resistance. This is where the sellers are lurking around. Continue to hold.
SPDR’s Select Sector Utilities ETF (XLU) daily
Hold
+3.5%
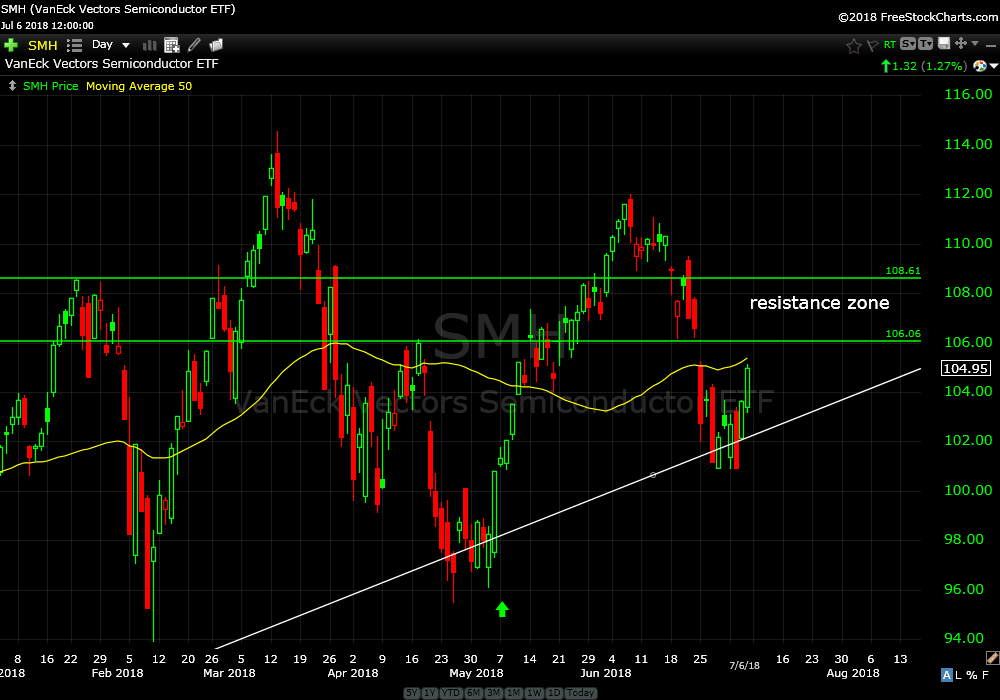
I recommended buying the semiconductor ETF (SMH) on May 7th. Price is up about 4% after popping and fading back in to support. I’m tempted to buy more but there is a lot of overhead resistance. Probably best to not add yet. Continue to hold.
VanEck Vectors Semiconductor ETF (SMH) daily
Hold
+4%
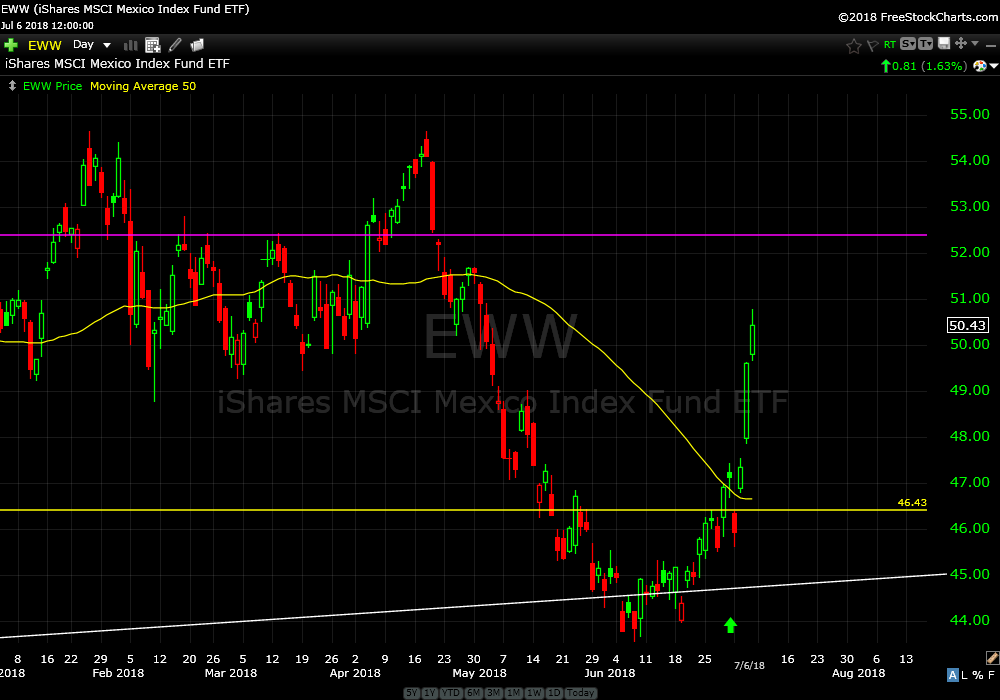
I recommended buying the Mexico Index ETF (EWW) Monday morning after recommending covering the profitable Latin America (ILF) short sell. It’s up about 10% since. Overhead resistance at just above 52. Continue to hold.
iShares MSCI Mexico Index Fund ETF (EWW) daily
Hold
+10%
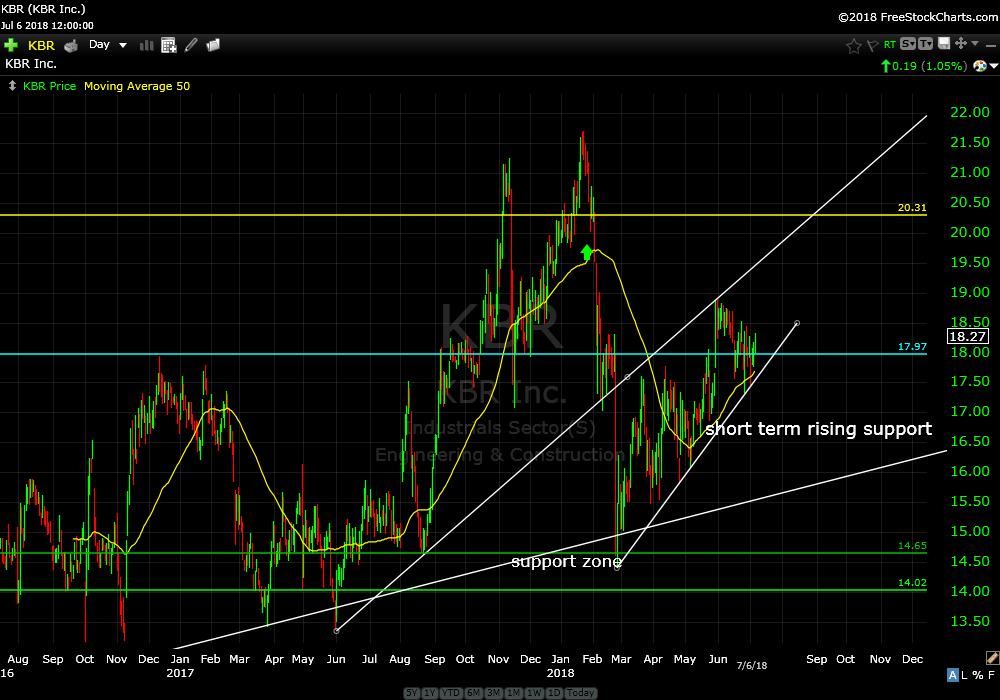
I recommended KBR Inc (KBR) on January 23 this year. It is down about 15%. After the big dump in February KBR has been grinding higher. You can see where the buyers are pushing the buy button…all along the short term rising support zone.I recommend holding.
KBR Inc (KBR) daily
Hold
-15%
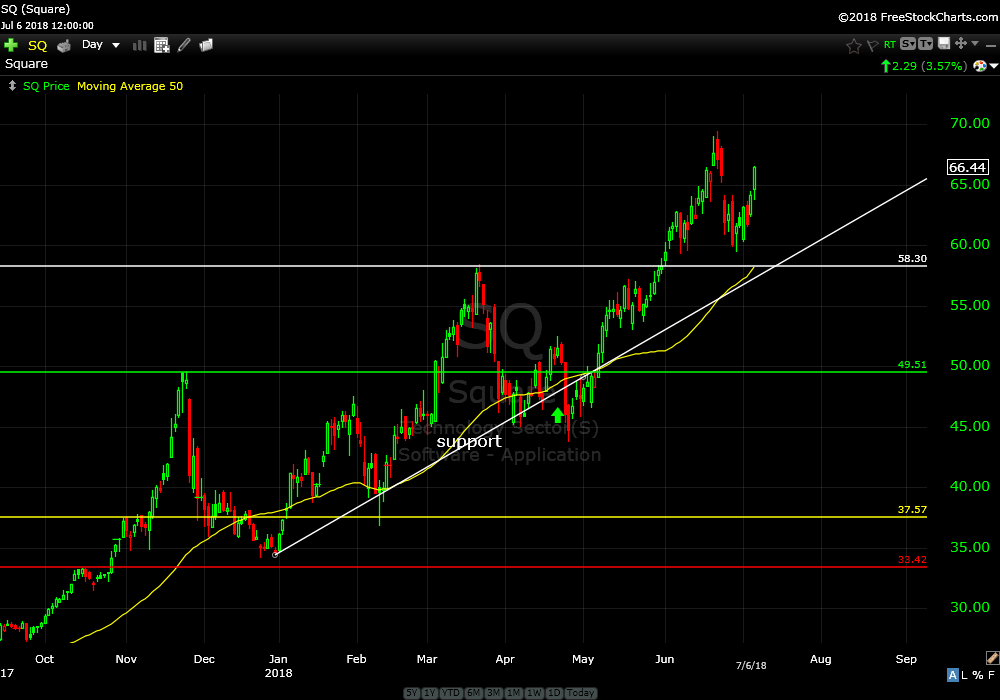
I recommended Square (SQ) on April 23rd this year. It is up about 30% in those six weeks. I see no reason to sell this one. Continue to hold.
Square (SQ) daily
Hold
+30%
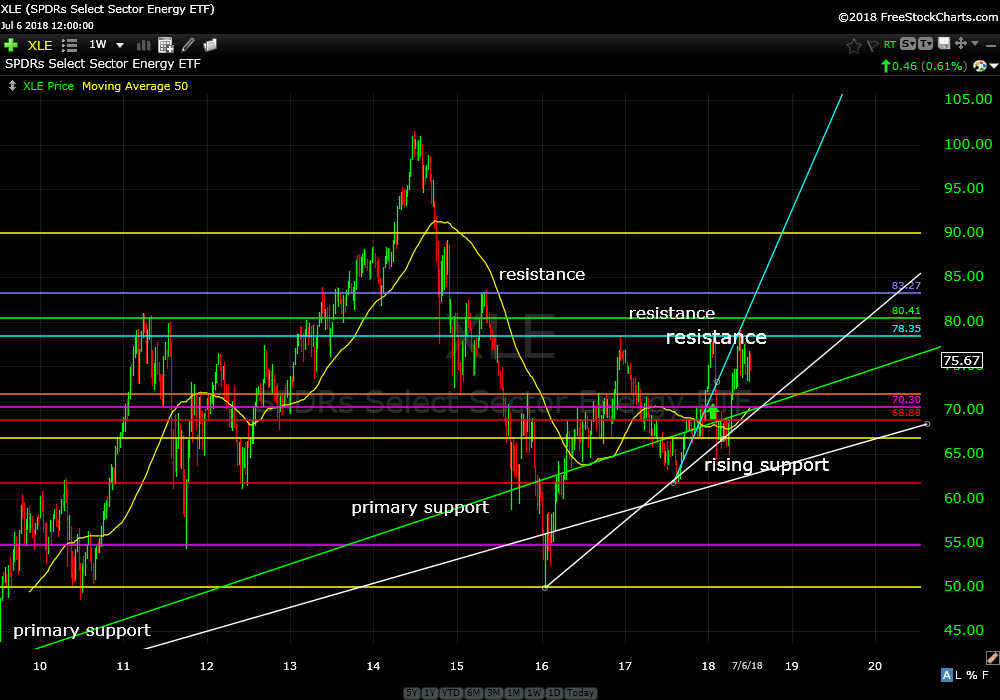
I recommended buying the energy sector ETF (XLE) on January 8th this year.`It is slightly profitable. There are a lot of sellers between $78 and $80 so price is struggling to get through this area. Continue to hold.
SPDR’s Select SectorEnergy ETF (XLE) weekly
Hold
+1%
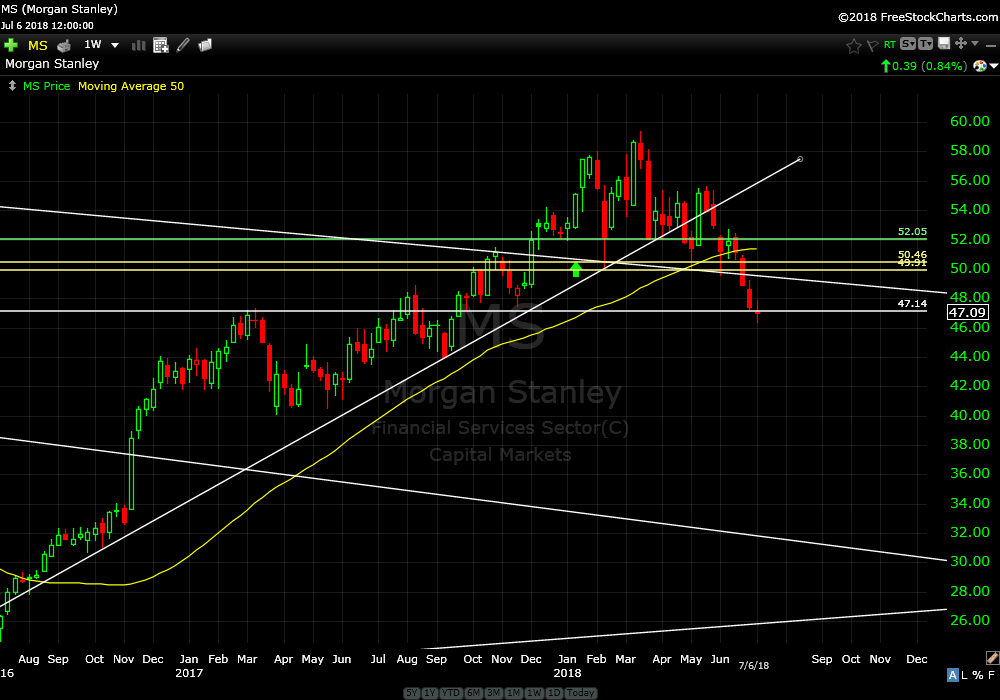
I recommended Morgan Stanley (MS) on January 8th this year. It is down about 11%. It looks broken after support violation. Sell it and limit losses.
Morgan Stanley (MS) daily
Sell
-11%
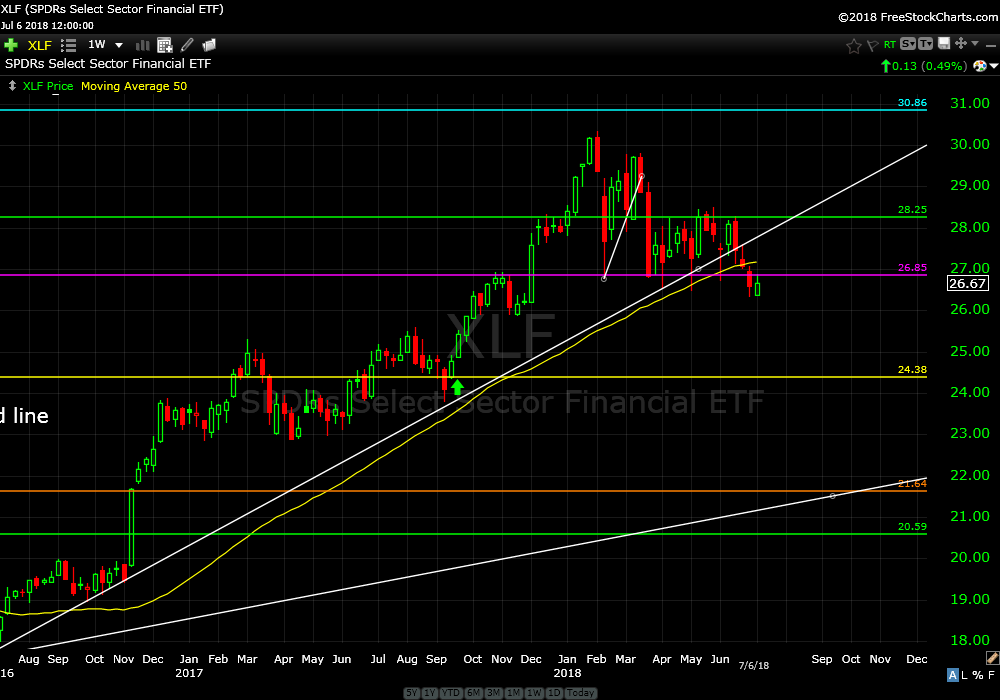
I recommended the financial sector ETF (XLF) on September 28, 2017. It is up about 4% after attempting taking out the pre financial crisis highs from 2007 and fading back. Price has broken support from early 2016 and I am recommending selling the position, collecting a small profit and moving on.
SPDR’s Select Sector Financial ETF (XLF) daily
Sell
+4%
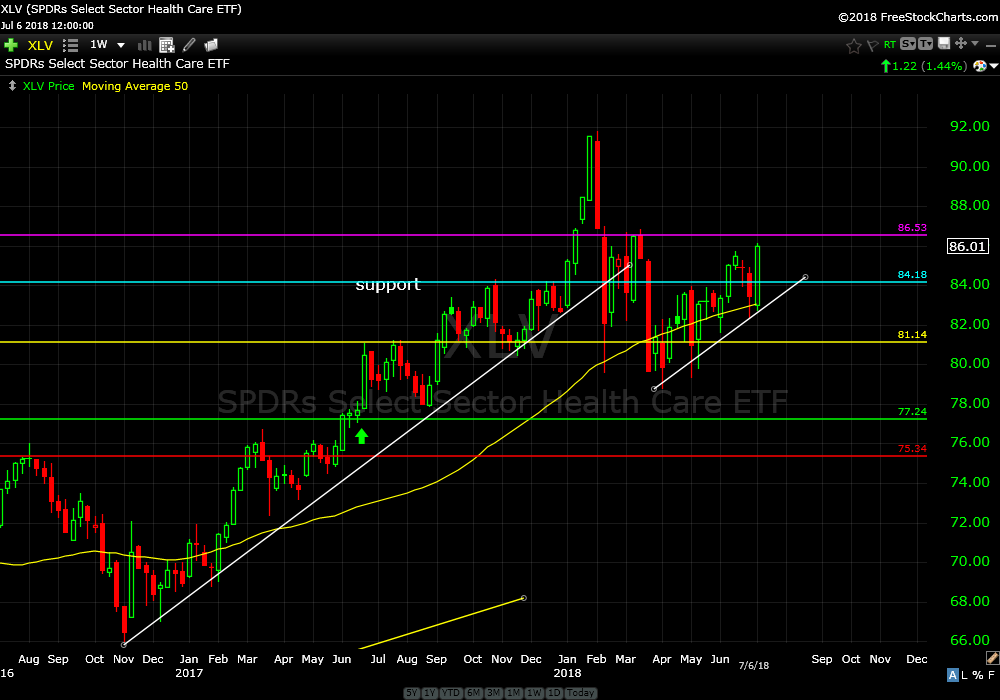
I recommended the health care sector ETF (XLV) on June 21, 2017. It is up about 9%. Price broke support during the February dump, tried to rally then failed again and now it’s getting bid up again. If we can get through $87 we can make a run at the highs from earlier this year. I recommend holding.
SPDR’s Select Sector Health Care ETF (XLV) daily
Hold
+9%
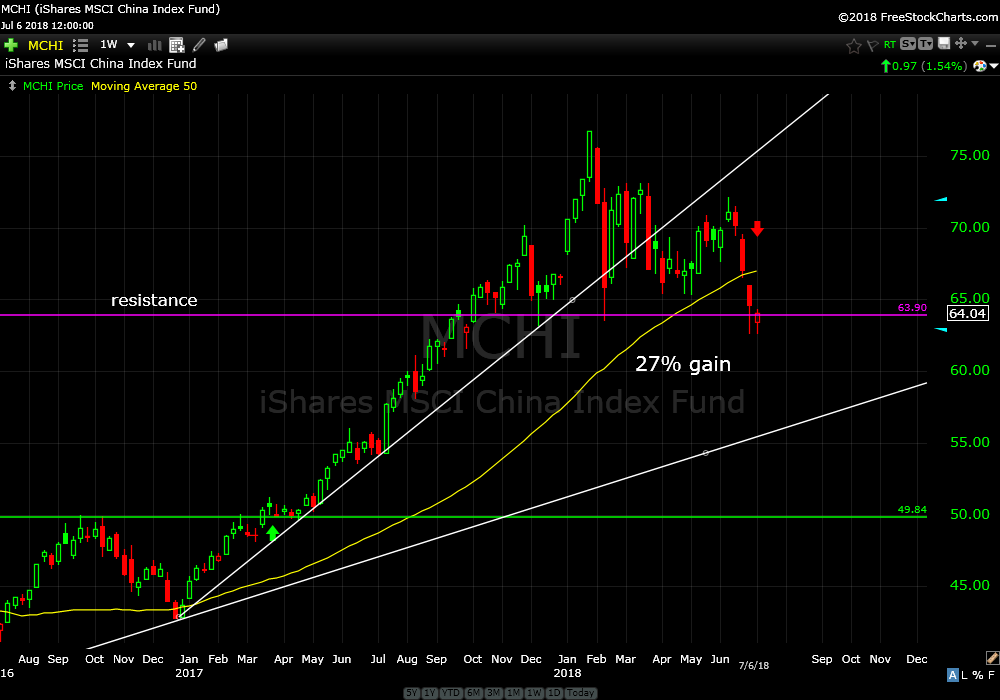
I recommended the China Index Fund (MCHI) on March 29, 2017. It is up about 27%. Price has broken rising support then a failed attempt to rally and now has closed below the 2015 highs. Sell it and ring the cash register.
iShares MSCI China Index Fund (MCHI) weekly
Sell
+27%
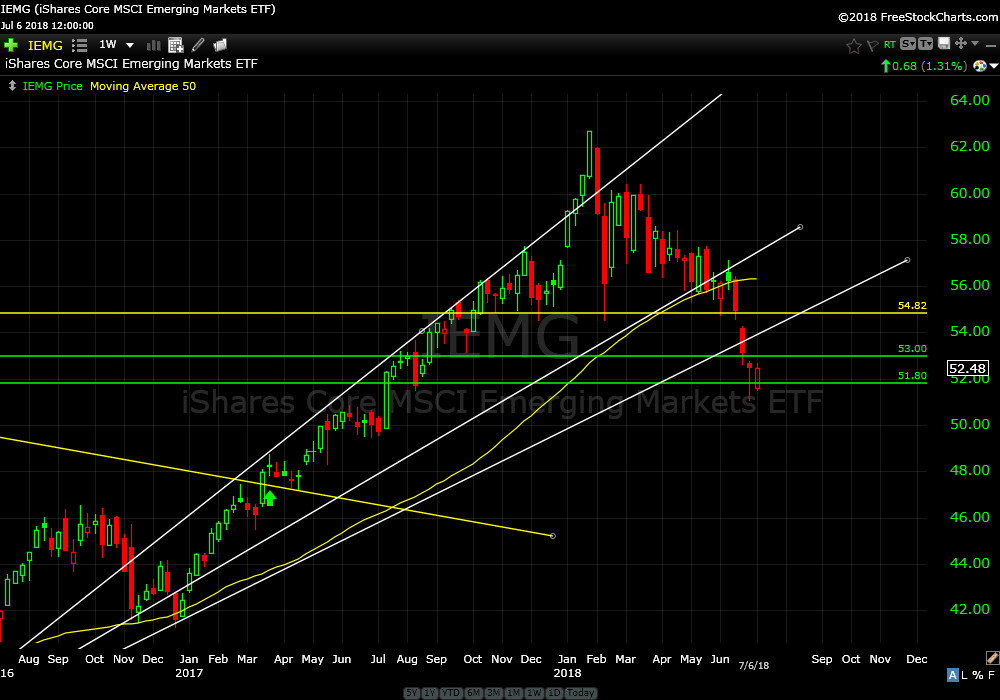
I recommended IEMG, an emerging markets ETF, on March 29, 2017. It is up about 8 1/2%. All support has failed. Sell it and take profits.
iShares Core MSCI Emerging Markets ETF (IEMG) daily
Sell
+8.5%
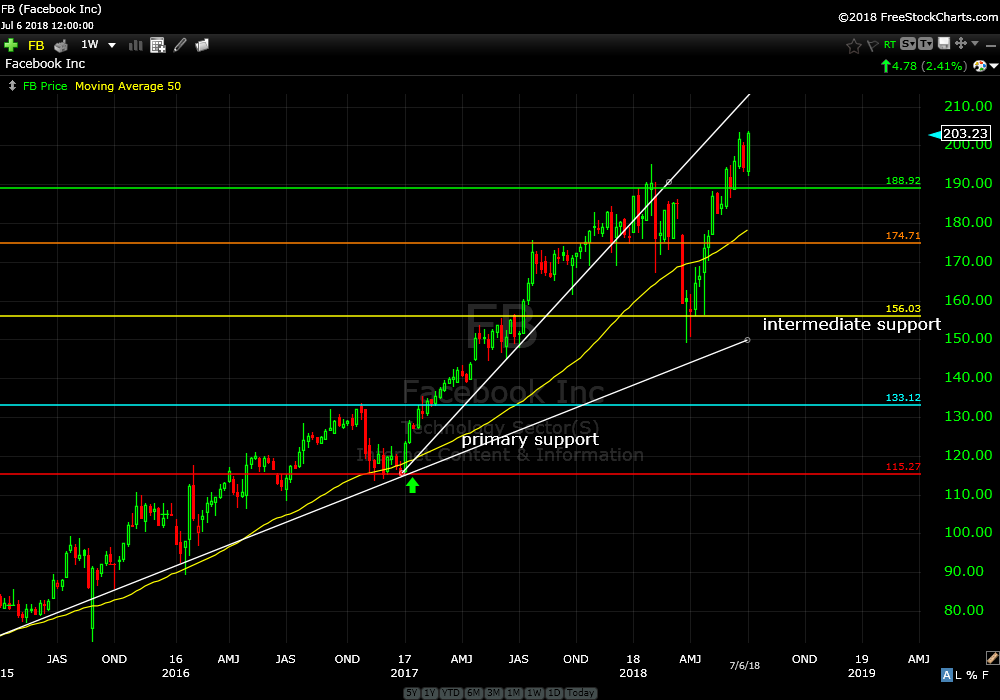
I recommended Facebook (FB) on January 17, 2017. It is up 58%. It’s making new highs. Hold it.
Facebook (FB) daily
Hold
+58%
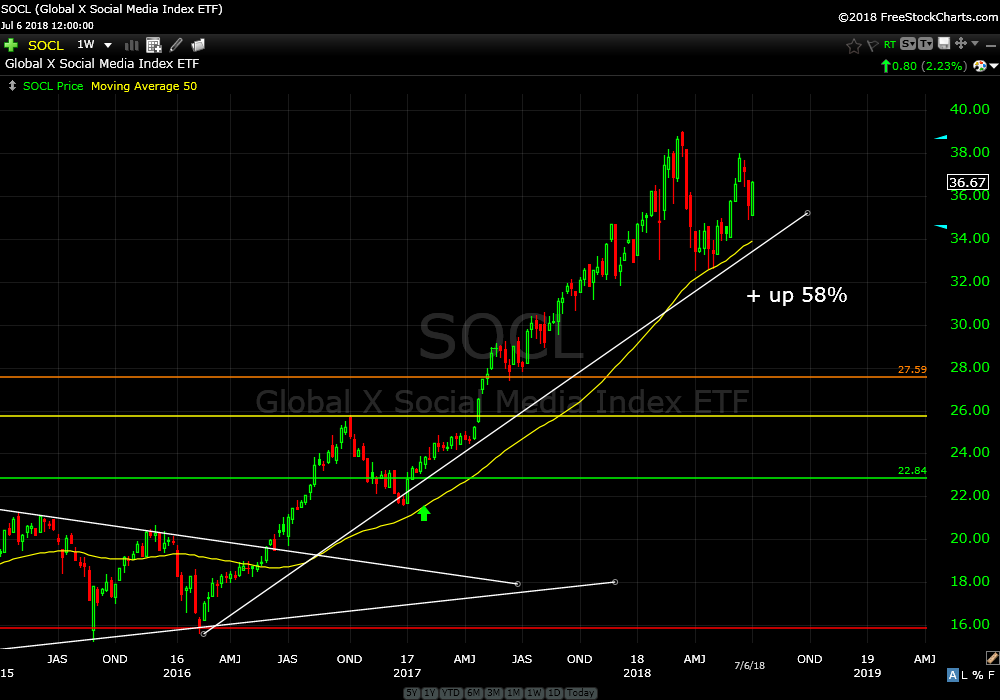
I recommended the social media ETF (SOCL) on January 17,2017. It is up 58%. It continues to get bid up at good support. Continue to hold.
Global X Social Media Index ETF (SOCL) daily
Hold
+58%
So, a little buying, a little more selling. Just trying to be objective and not let my feelings screw anything up. Just trying to be objective and follow my methodology. Just trying to be objective and totally ignore fundamental garbage by focusing on what really moves markets. It’s not earnings by the way. It’s buyers and sellers.
If we know where the big buyers and sellers are lurking we can just follow them. I know it’s not that easy. But it’s not that hard either.
Stay tuned for new opportunities that are brewing. If you have any questions or would like me to review any price charts just shoot me an email.
Have a great week and see how many people you can make smile.
Trade Smart,
Don