Amazon.Com (AMZN) daily
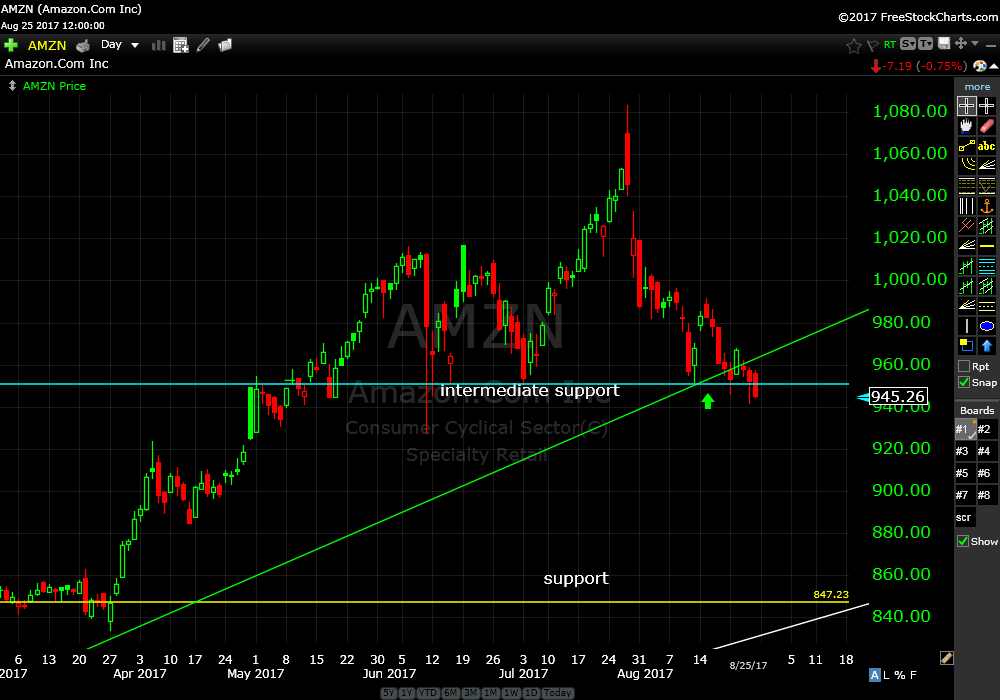
Price closed the week out below intermediate support, the horizontal blue line. This is the first weekly close under this price level since May. Our recommendation from August 15 is down about 4%. Sell it and limit losses.
Global X Lithium ETF (LIT) daily
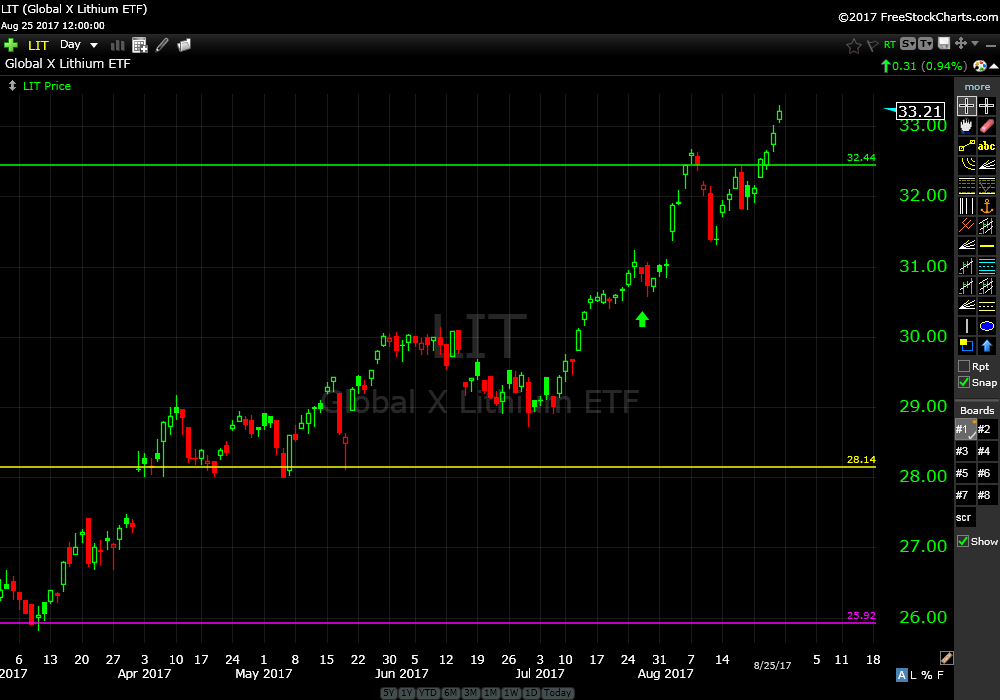
Price is up about 7.5% from our recommendation on July 26. Our next price target is 34.82. Price action is looking good. Continue ho hold.
Albermarle Corp (ALB) daily
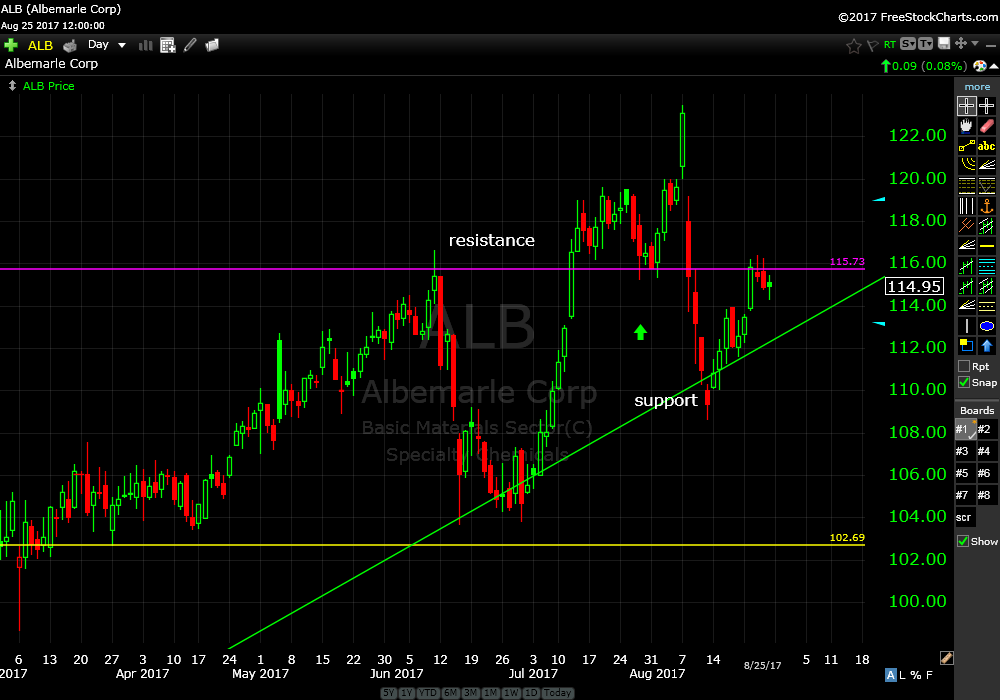
Price is down about 2.5 % from our recommendation on July 26. Price is struggling a bit at resistance over the past few days. Continue to hold.
SPDR’s Select Sector Health Care ETF (XLV) daily
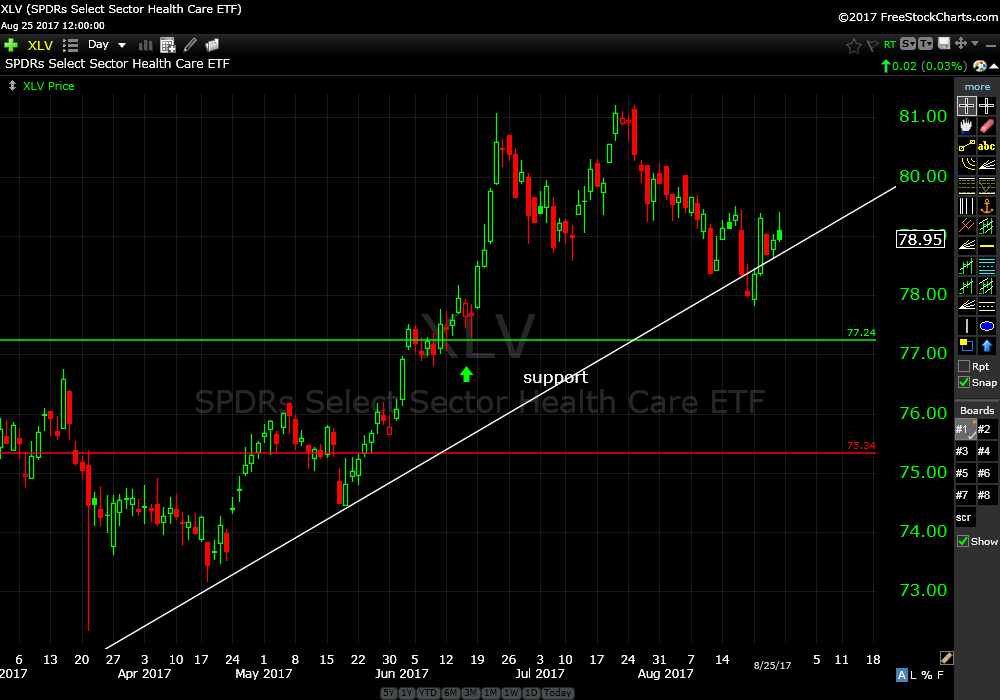
Price is almost exactly break even from our recommendation on June 21. As long as support, white upwards sloping trend line, holds we are good to go. Continue to hold.
iShares MSCI China Index Fund (MCHI) daily
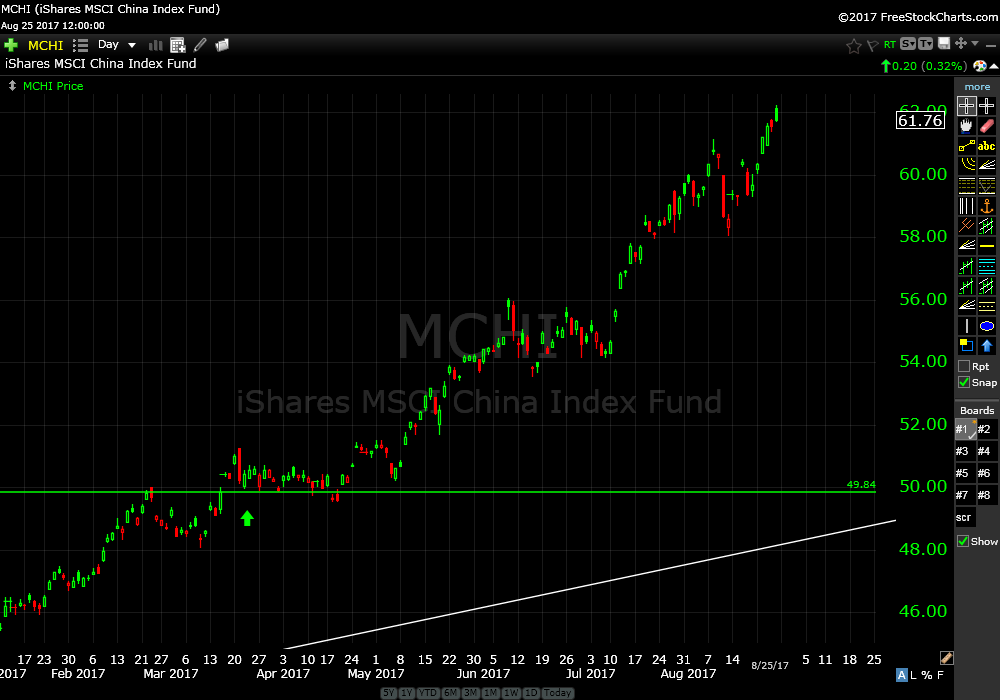
Price is up about 22.5% from our recommendation on March 29. Next price target is 63.90. Looking good. Continue to hold.
iShares Core MSCI Emerging Markets ETF (IEMG) daily
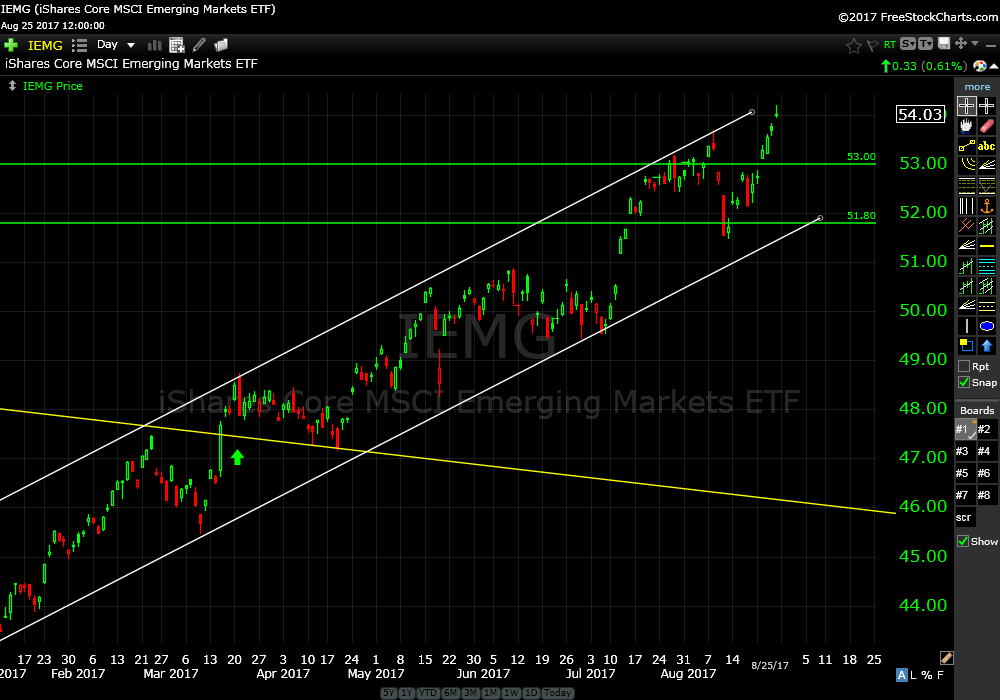
Price is up about 12% from our recommendation on March 29. There is some overhead resistance soon where price may stall. continue to hold.
SPDR EURO STOXX 50 ETF (FEZ) daily
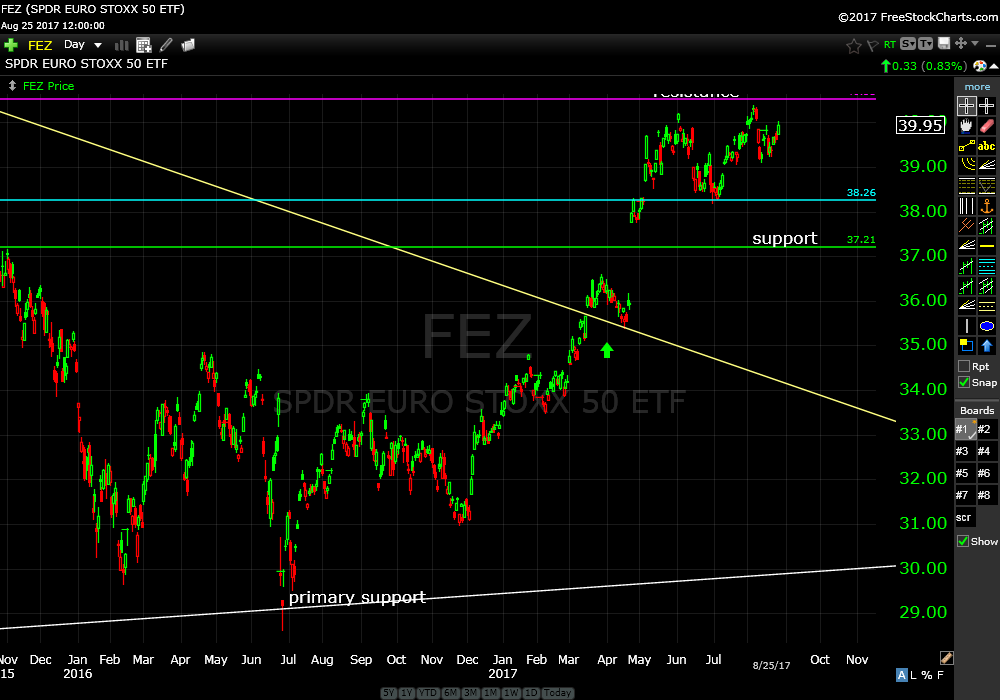
Price is up about 10% from our recommendation on March 29. Price is struggling to break through resistance. Continue to hold.
Schwab International Equity ETF (SCHF) daily
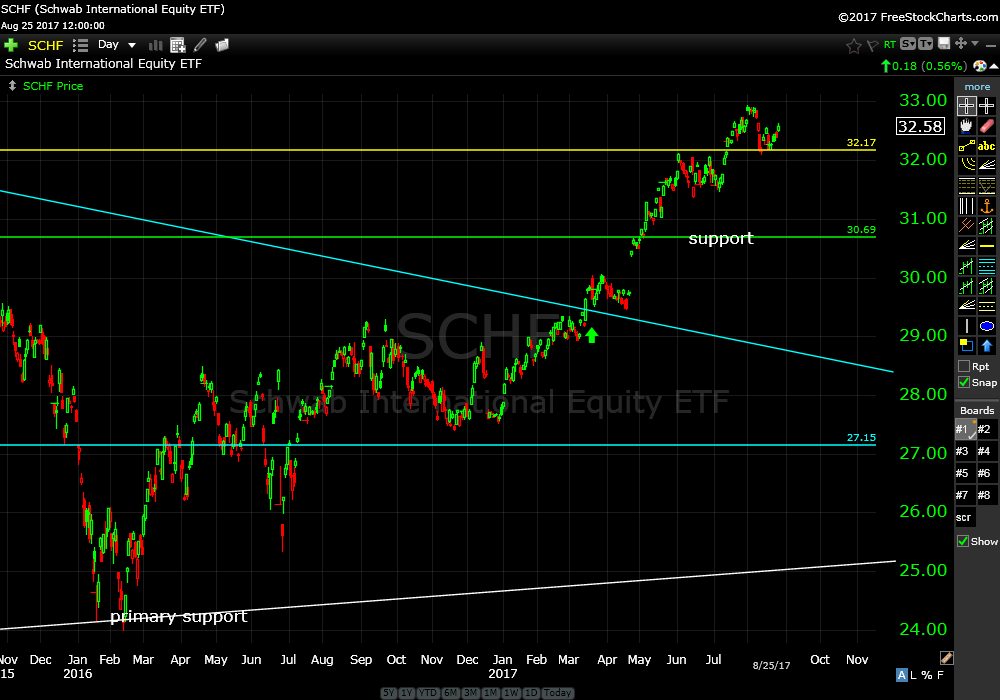
Price is currently up about 9% from our recommendation on March 19. Running into resistance at 33.30 so it might get bumpy up there…keep your seat belts fastened. Continue to hold.
iShares Barclay’s 20+ Year Treasury Bond Fund (TLT) daily
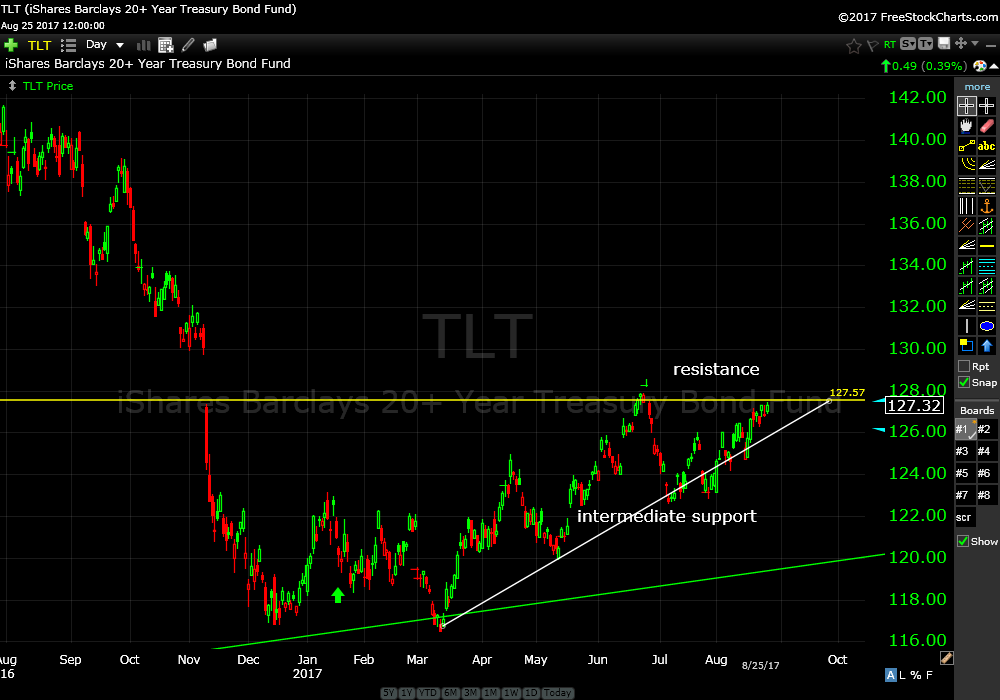
When we recommended this on January 23rd EVERYONE was saying “interest rates will continue to rise from here. Well, the exact opposite happened. Hmmm. Price is up about 5% from our recommendation. Bumping up against resistance soon. Continue to hold.
Facebook Inc (FB) daily
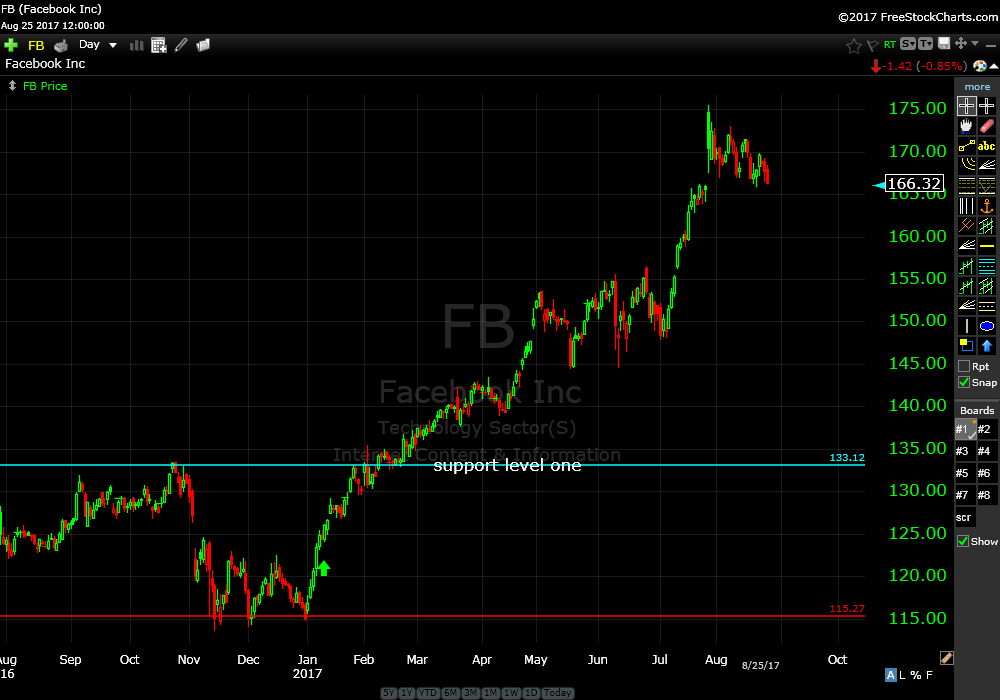
Price is up about 30% from our recommendation on January 17. I like it. Please share it. Continue to hold.
Global X Social Media Index ETF (SOCL) daily
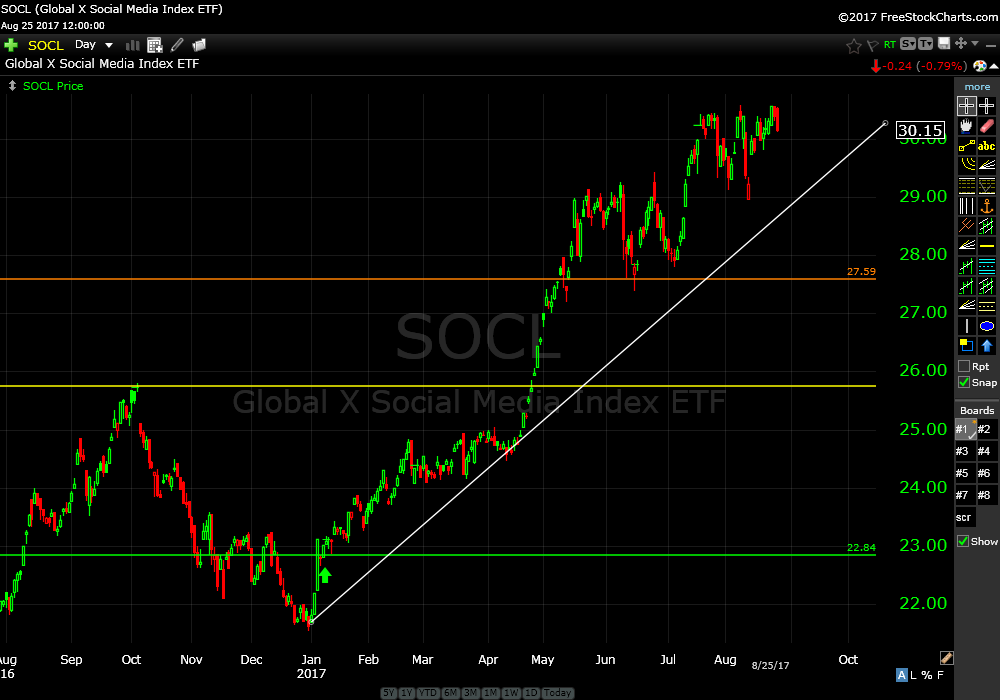
Price is up about 30% from our recommendation on January 17. Rock Star performance. Continue to hold.
iShares MSCI India Index (INDA) daily
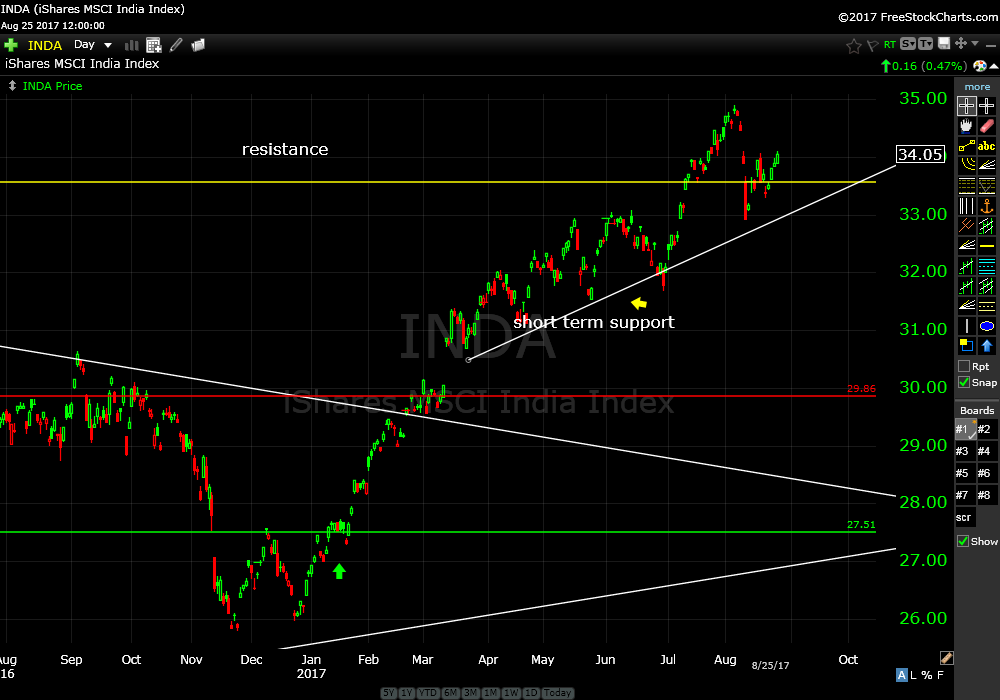
Price is up about 23% from our recommendation on January 17. Price action is looking good. Continue to hold.
In addition continue to hold SPY, QQQ and XLK. Price action looks fine to me. We are coming into a time of year that has been known to be a bit volatile. Fall is actually my favorite time of year…go figure.
Trade Smart,
Don