Broader Market Review
Well, that was one hell of a Trump tweet Friday morning. The Dow dropped off a cliff as soon as it came out…623 Dow points. The previous little Trump tweet sent the market spiraling down 797 Dow points on Monday, August 5th. Someone take away his phone please! While I expected and wrote about some big down days this past week even this one took me by surprise. Wow!
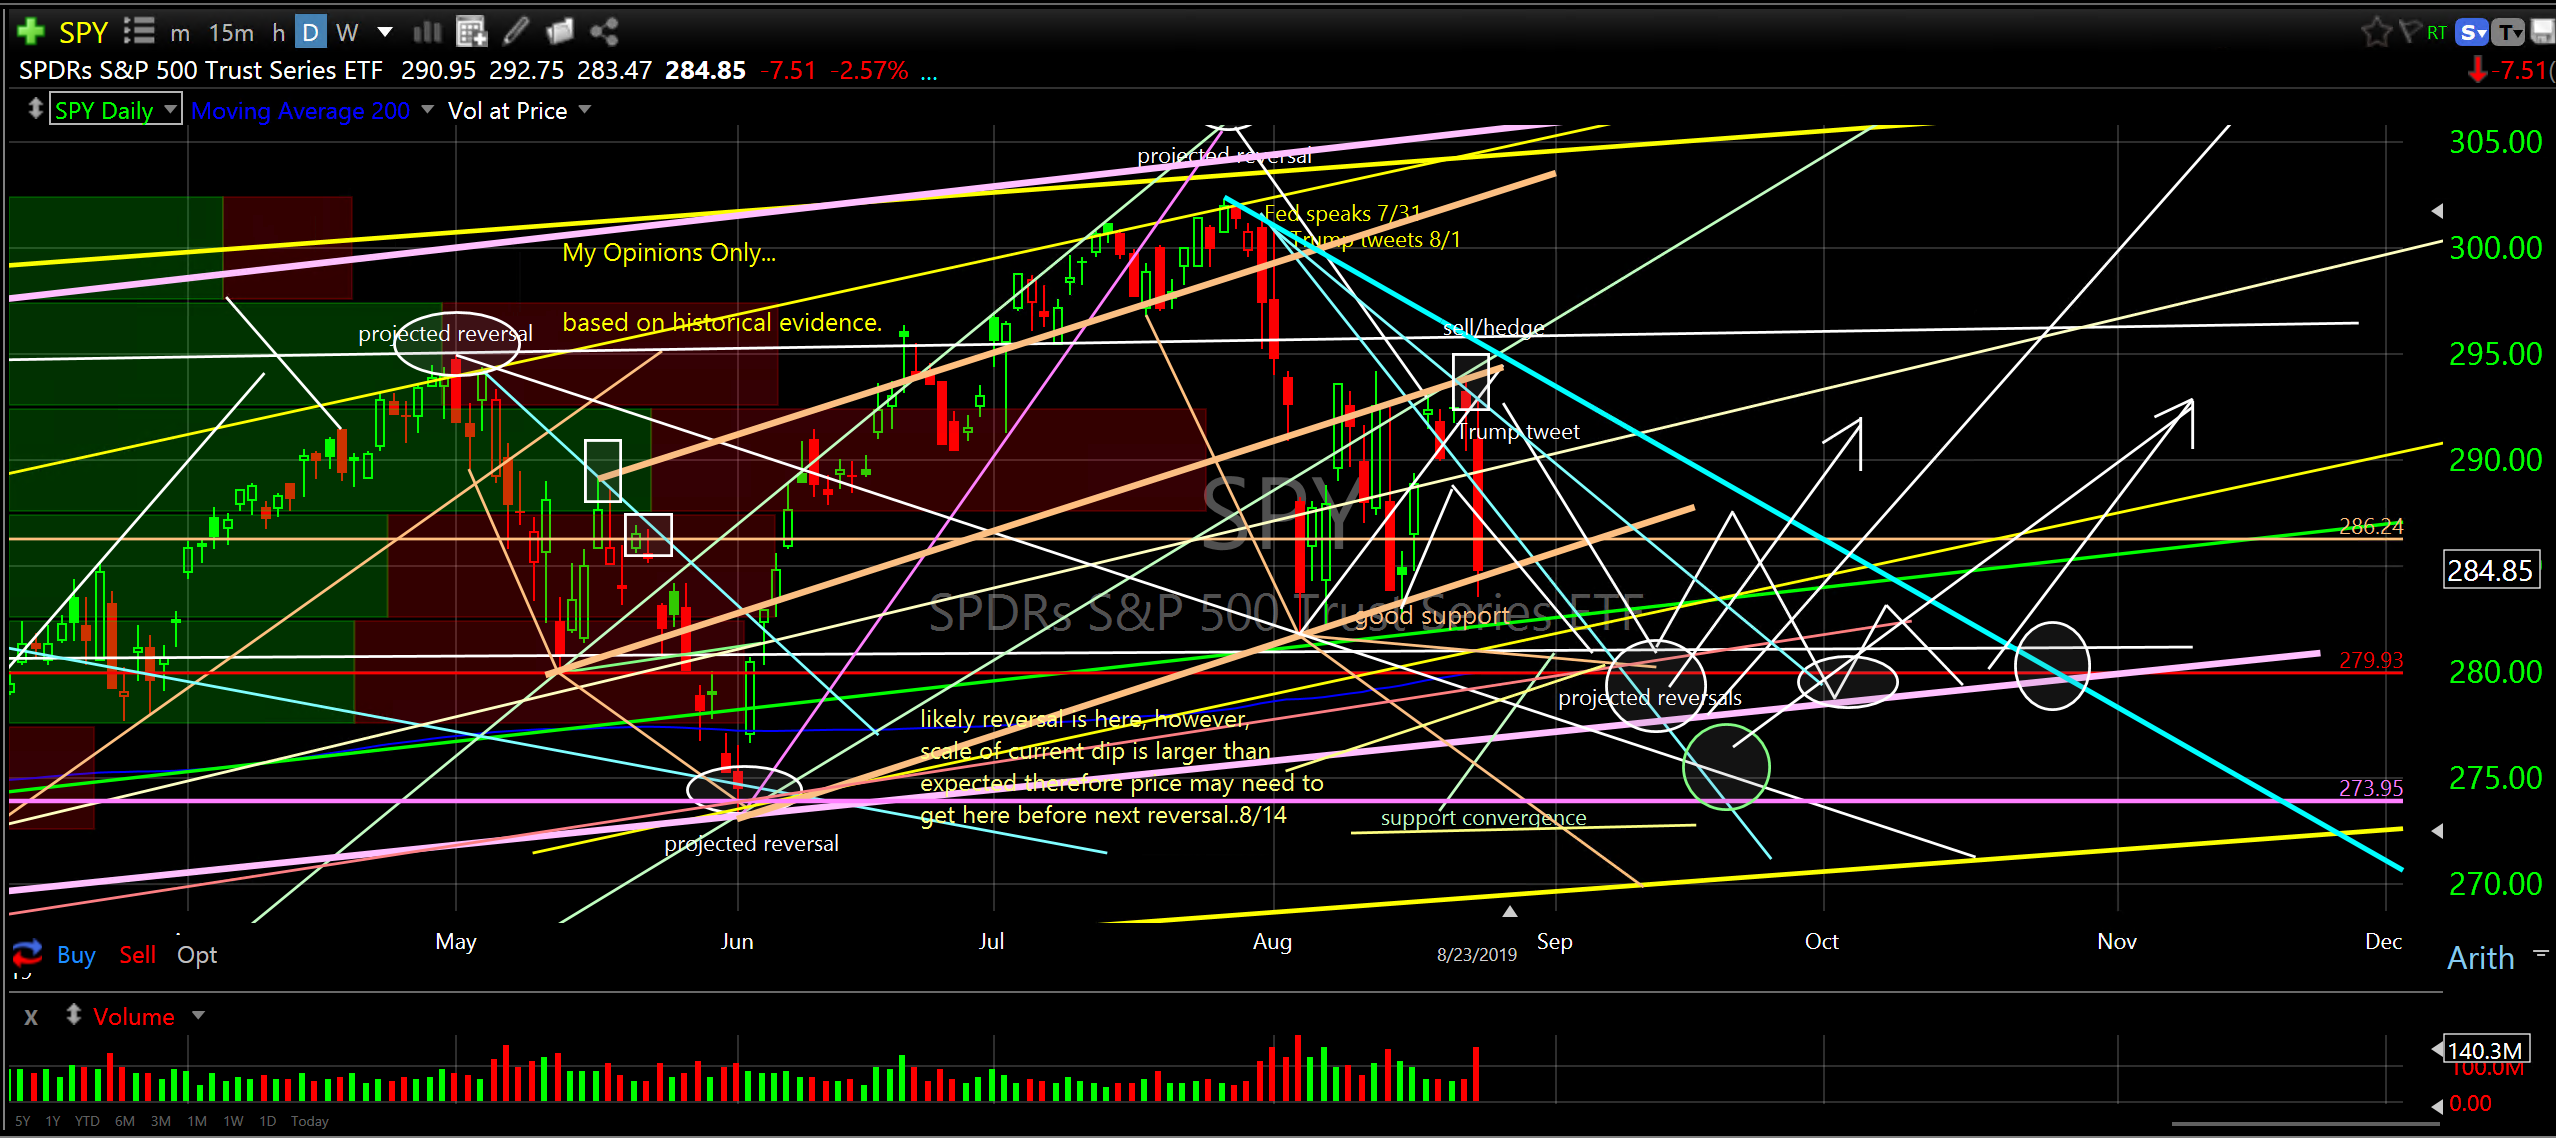
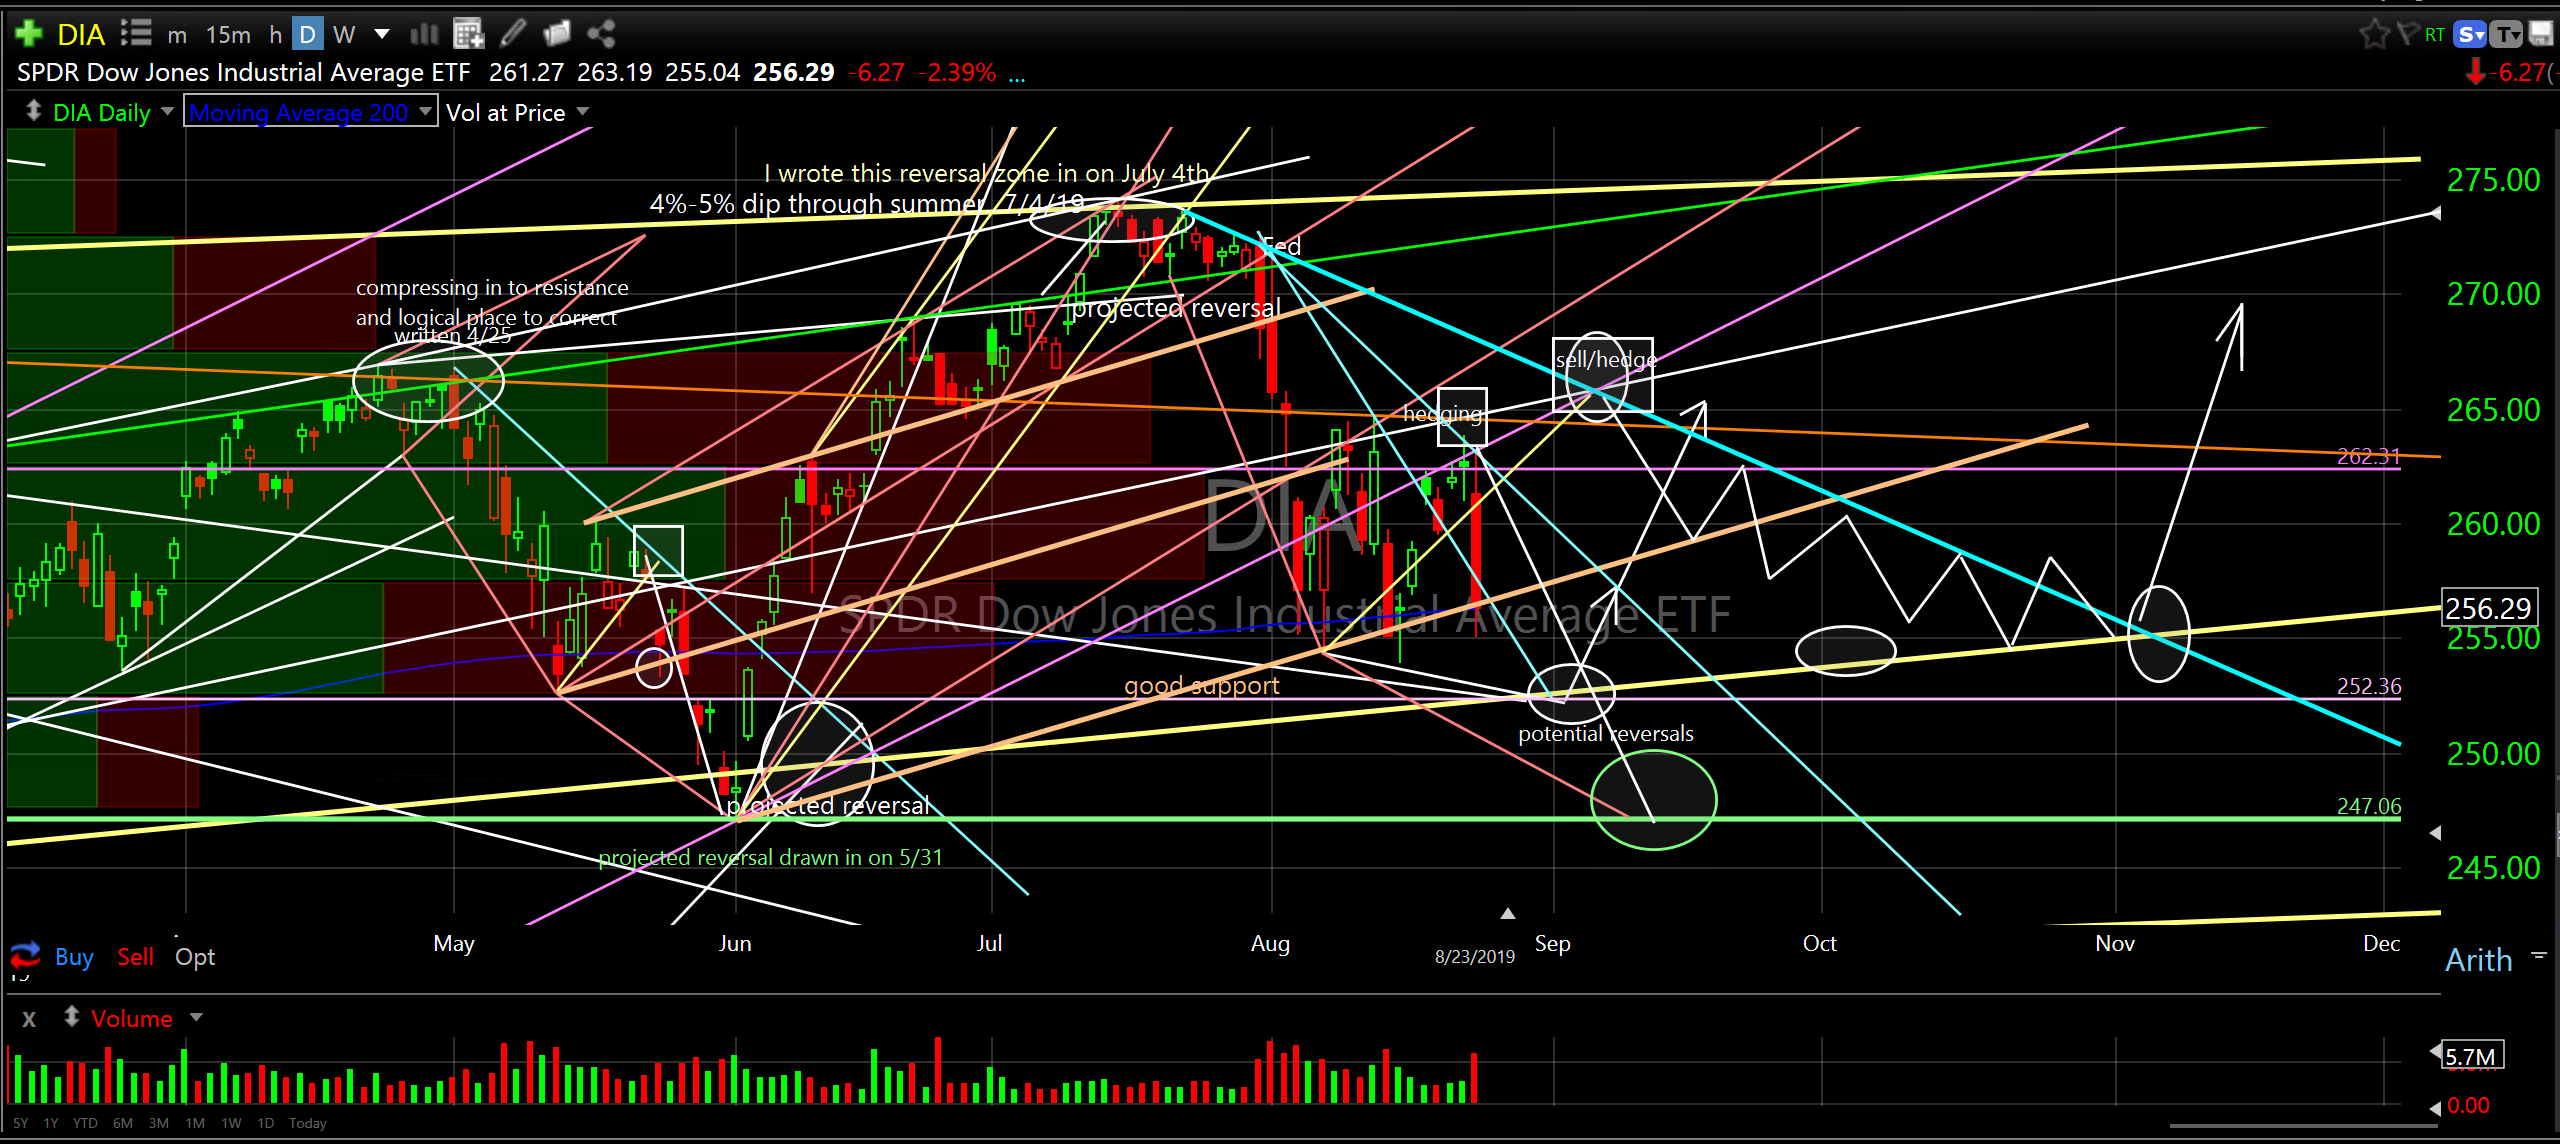
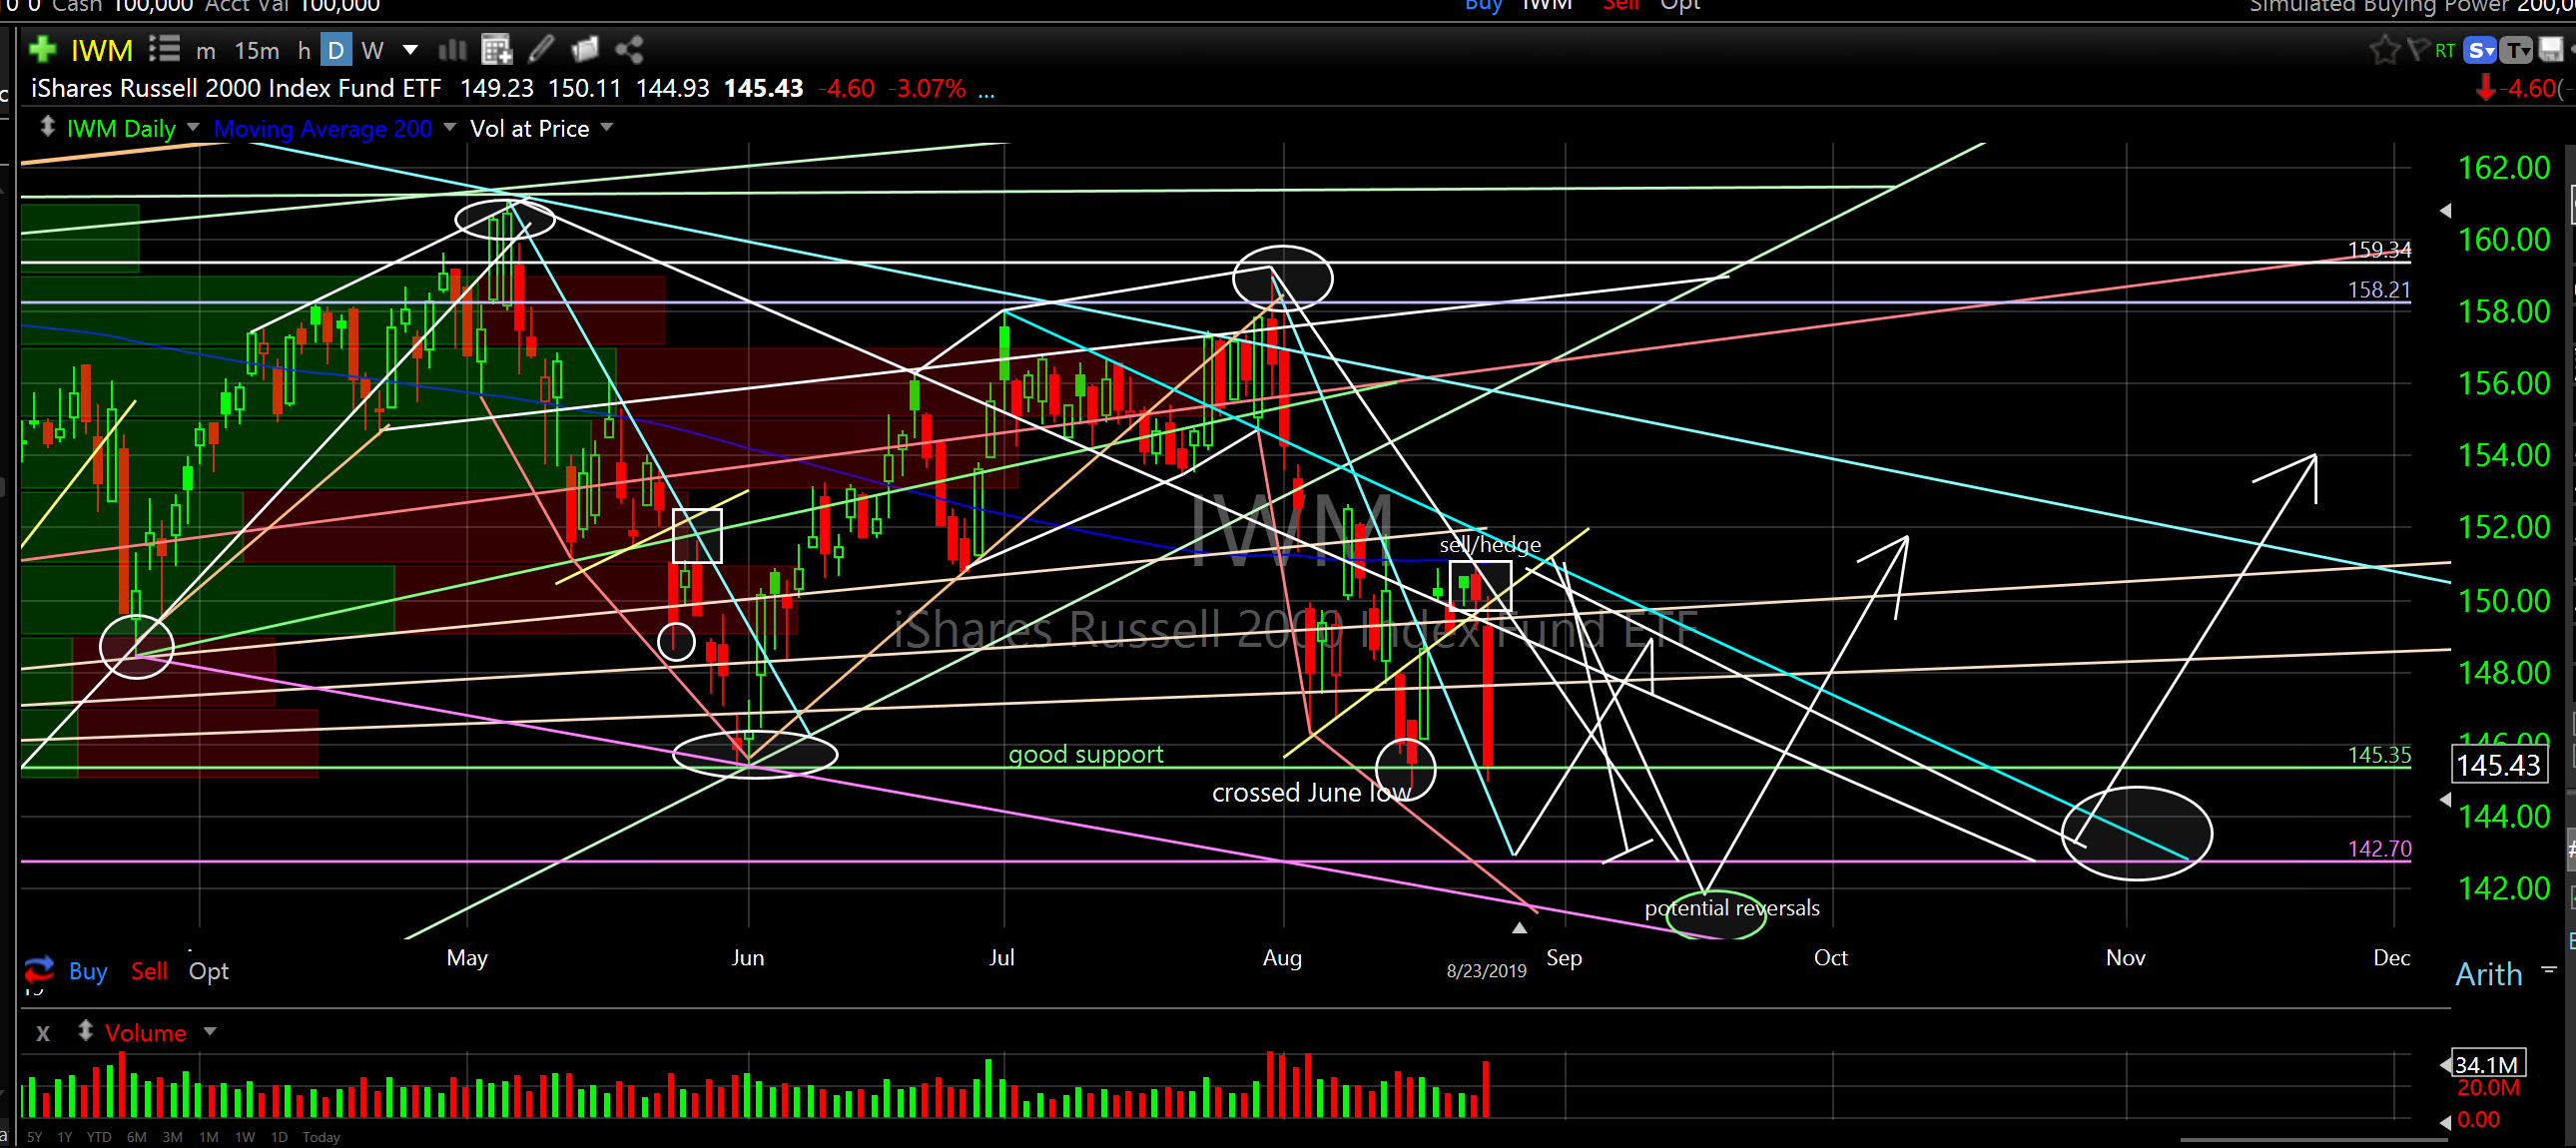
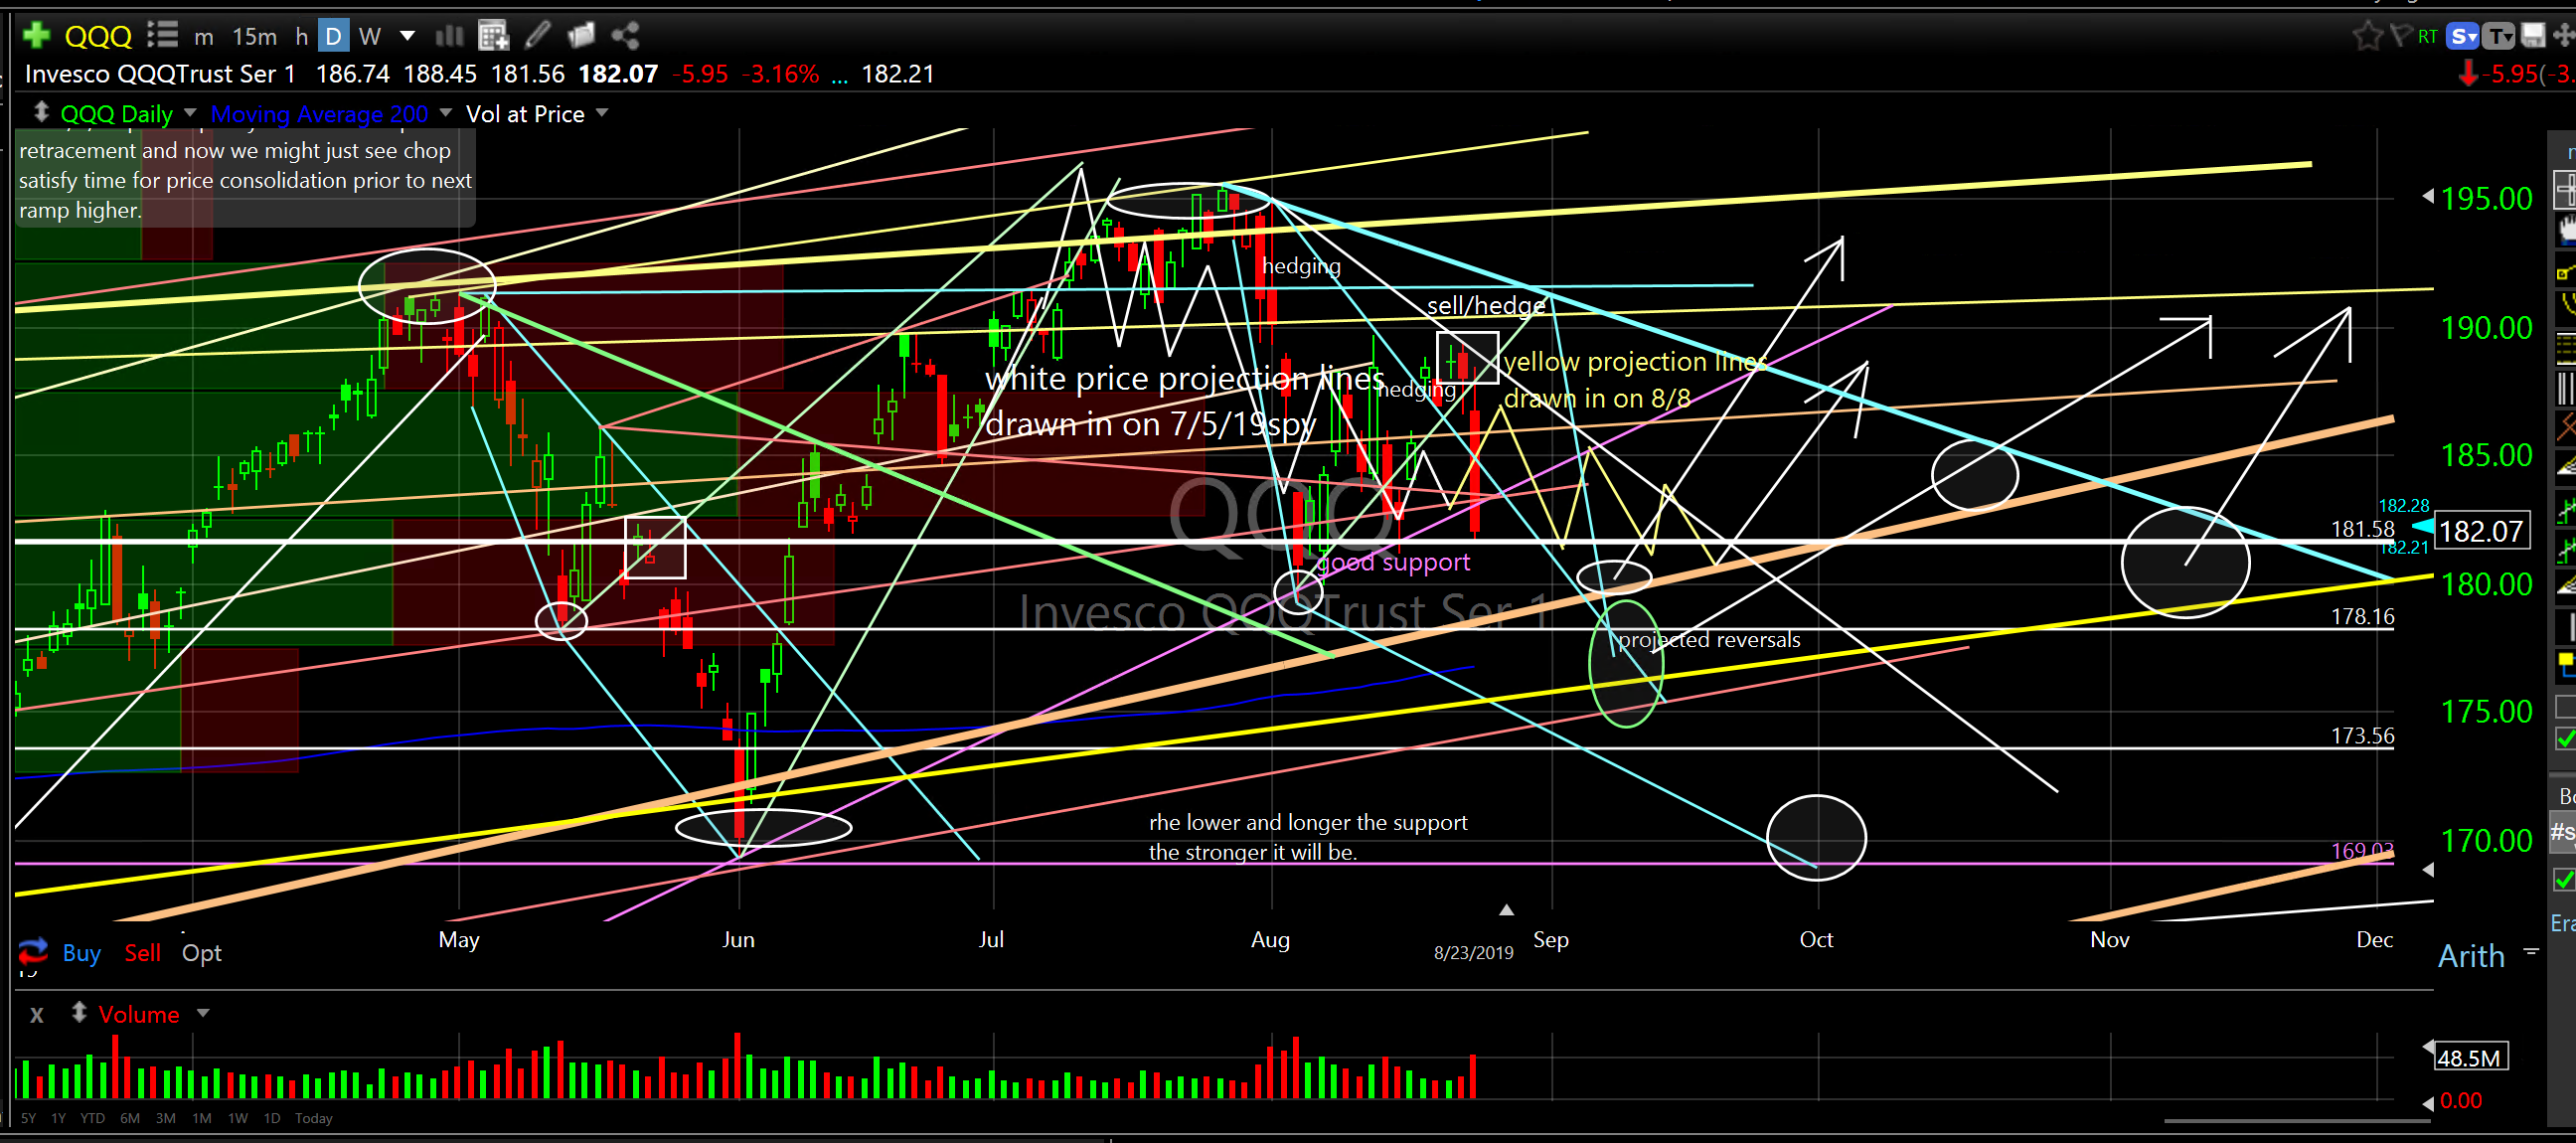
SPY, DIA, IWM and QQQ all moved sideways and slightly up to cross resistance Wednesday and Thursday. This widening price action coupled with the “steep and deep” of the move down on August 5th and again Friday is indicative of a dip that is larger in structure and volatility than I originally measured. Except…I’m not sure how to measure the tweet storm.
The good news is that SPY, DIA and IWM all closed right on top of very solid support (see charts). QQQ did not though. The QQQ’s did close at the mid point of the May correction and at the point they broke down in early 2018 however. The bad news is that technical corrections (sans tweets) usually have two legs down. See the past couple of dips and see my yellow line that shows the two separate legs. So, if this is the beginning of the second leg down the reversals measure out to the green circles I drew in. Yuck.
SPDR’s S&P 500 Trust Series ETF (SPY) daily
SPDR Dow Jones Industrial Average ETF (DIA) daily
iShares Russell 2000 Index Fund ETF (IWM) daily
Invesco QQQTrust Ser 1 (QQQ) daily
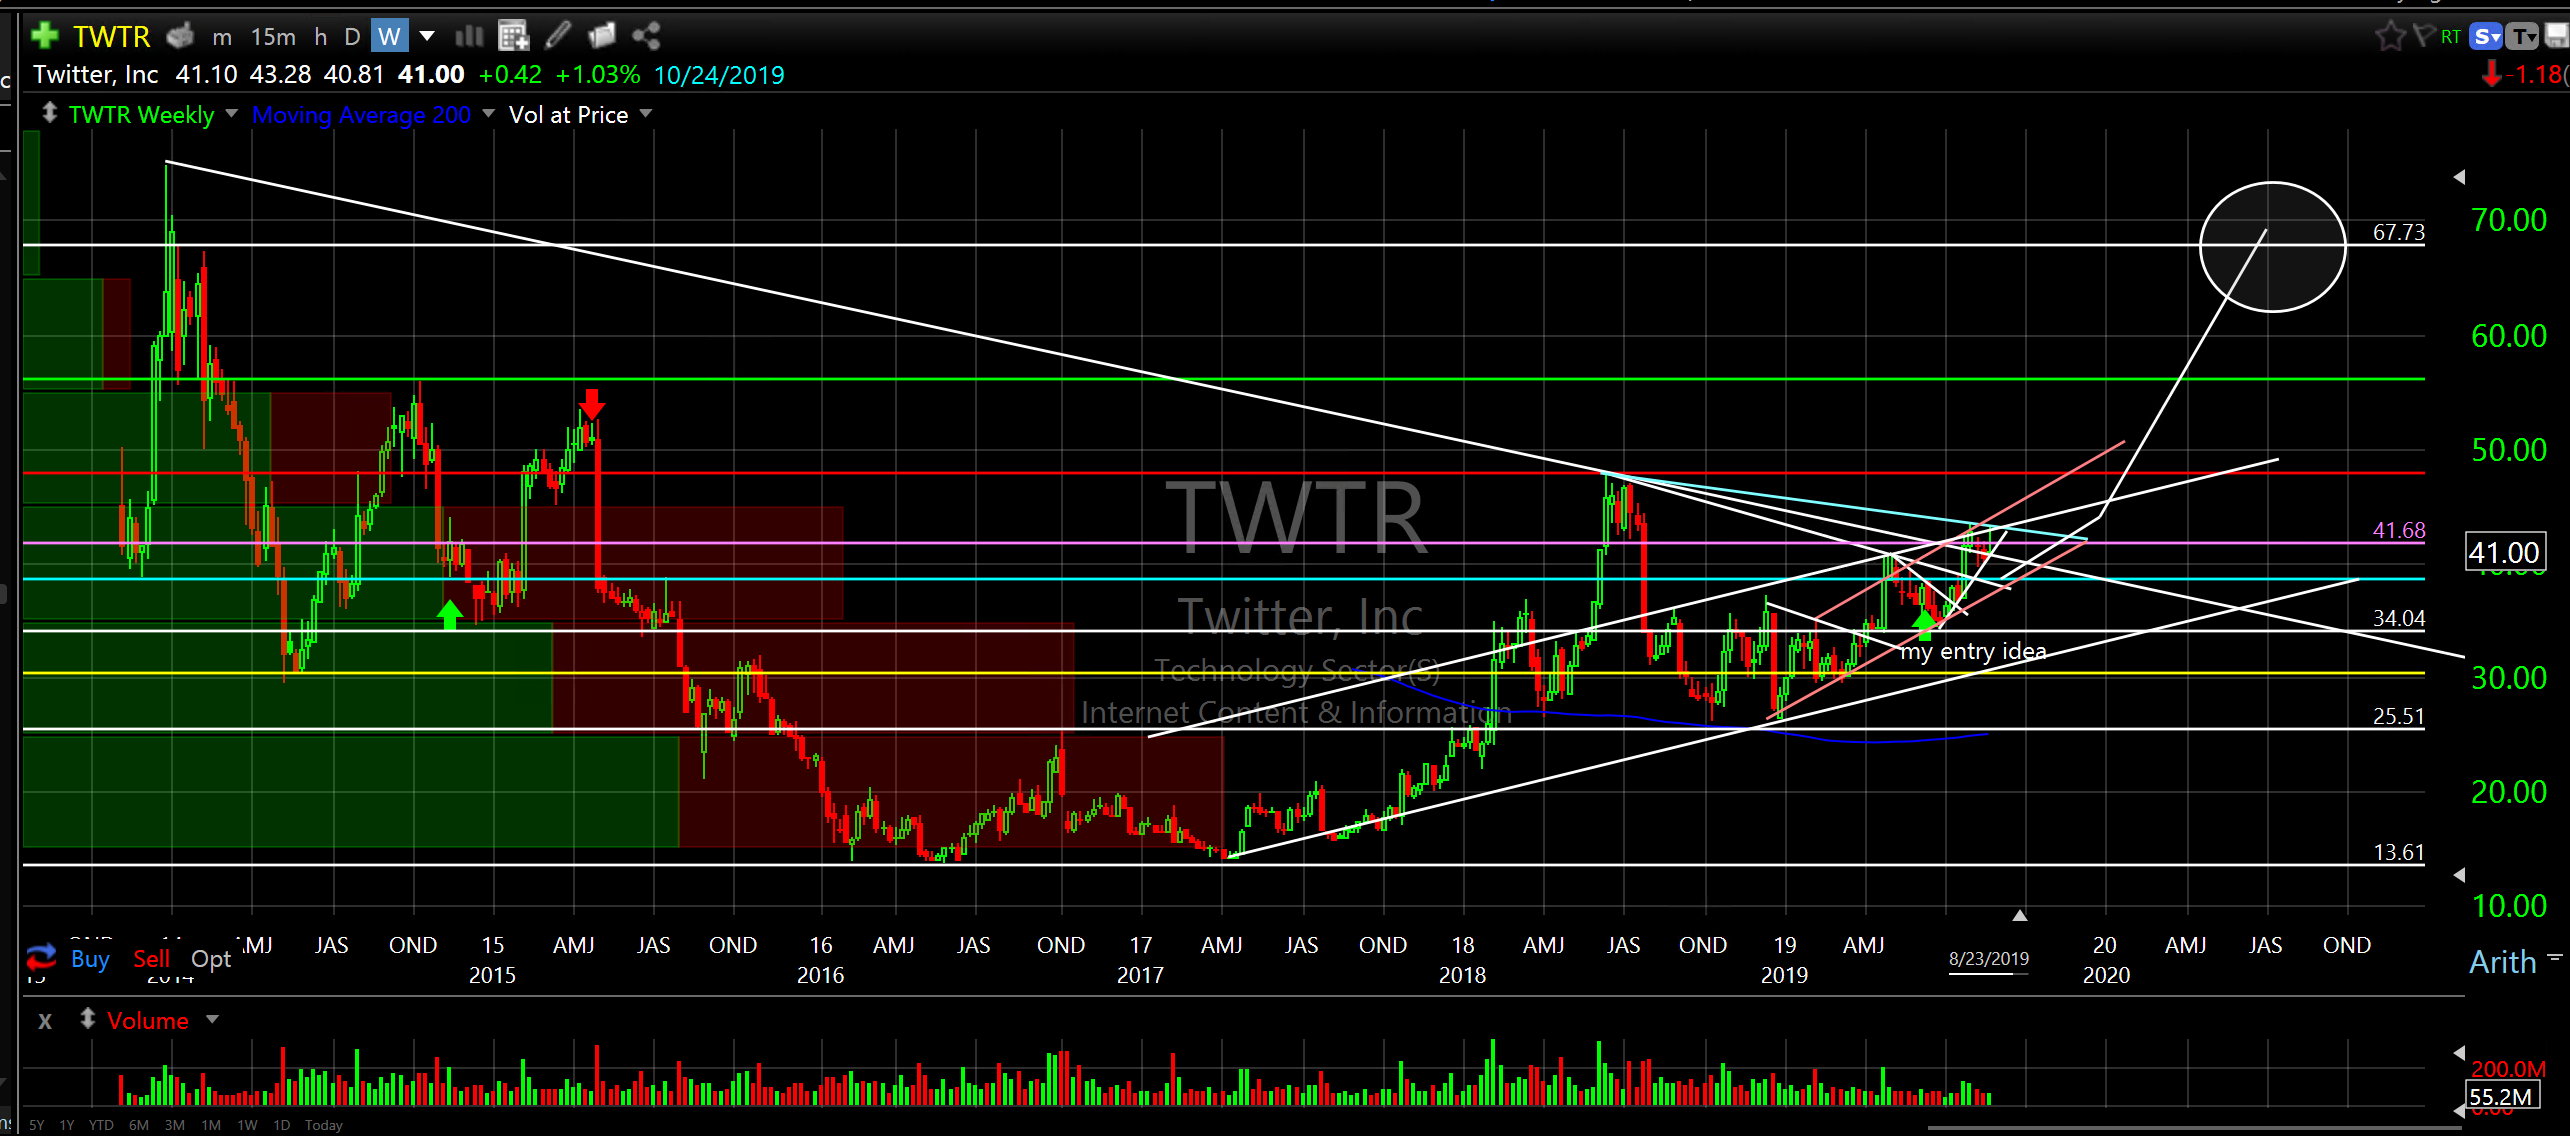
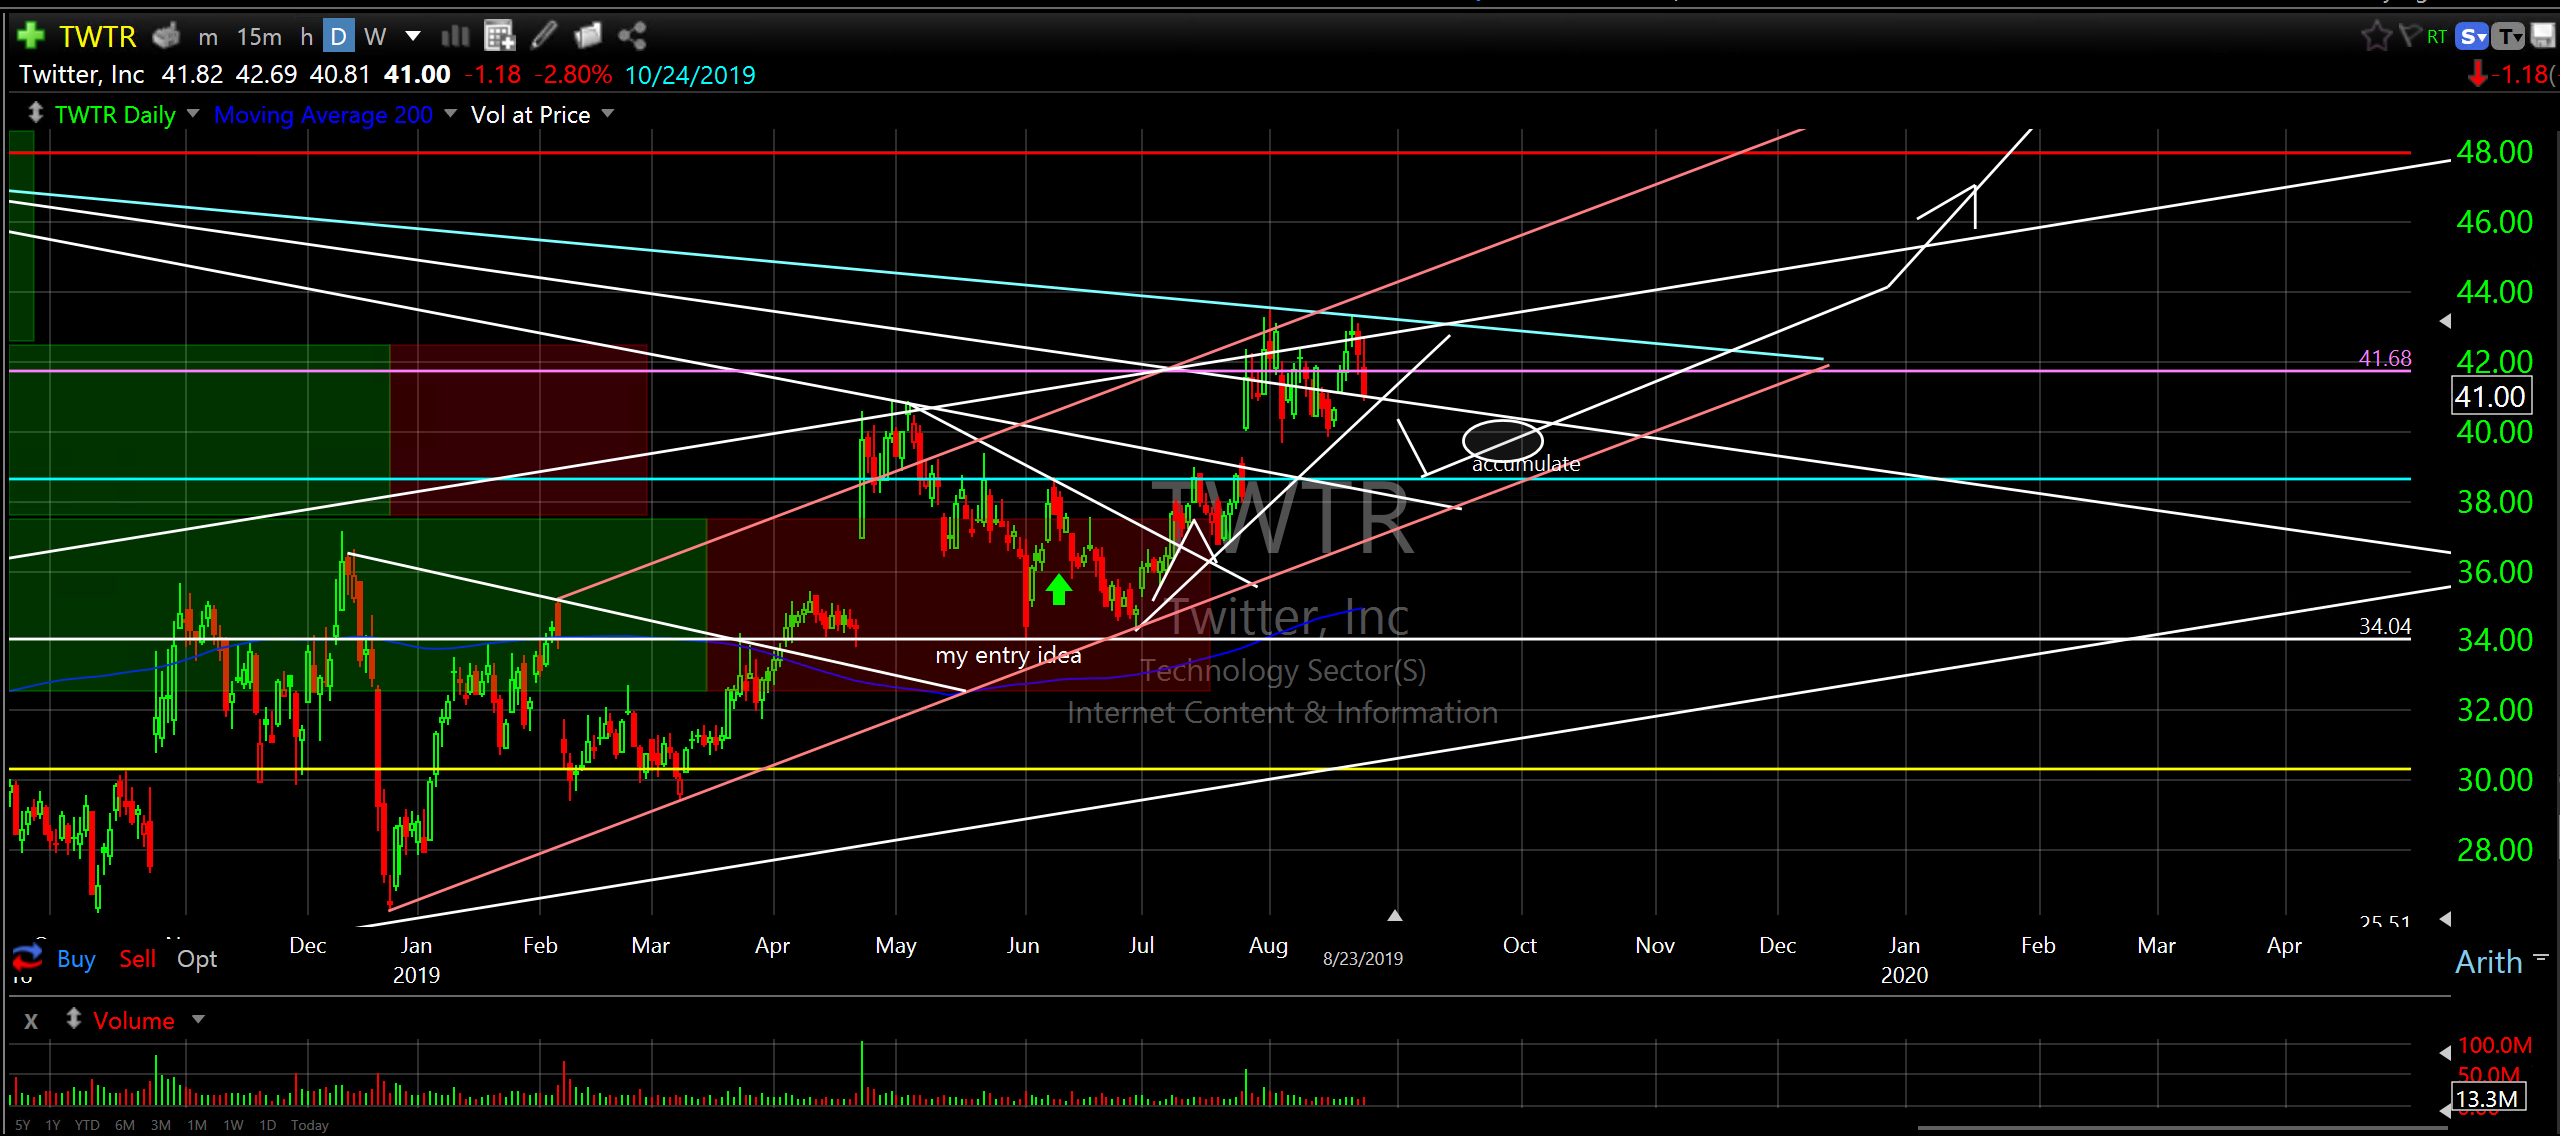
I must say, however, I think we are in “uncharted” territory with Trump’s market moving tweets. Sorry, I couldn’t resist. At least Twitter, Inc (TWTR) has done well from my entry idea in June. hehe.
Twitter, Inc (TWTR) weekly and daily
If we do get down to the reversal zones I drew in and get bid up I think the market can rocket higher for most of 2020. Last week I shared the 10 Yr Treasury Yield chart which shows that when yields get down into current levels the broader market has gone into expansion mode. This week we look to the 20+ Year Treasury Bond Fund chart (TLT).
20+ Year Treasury Bond Fund (TLT) weekly
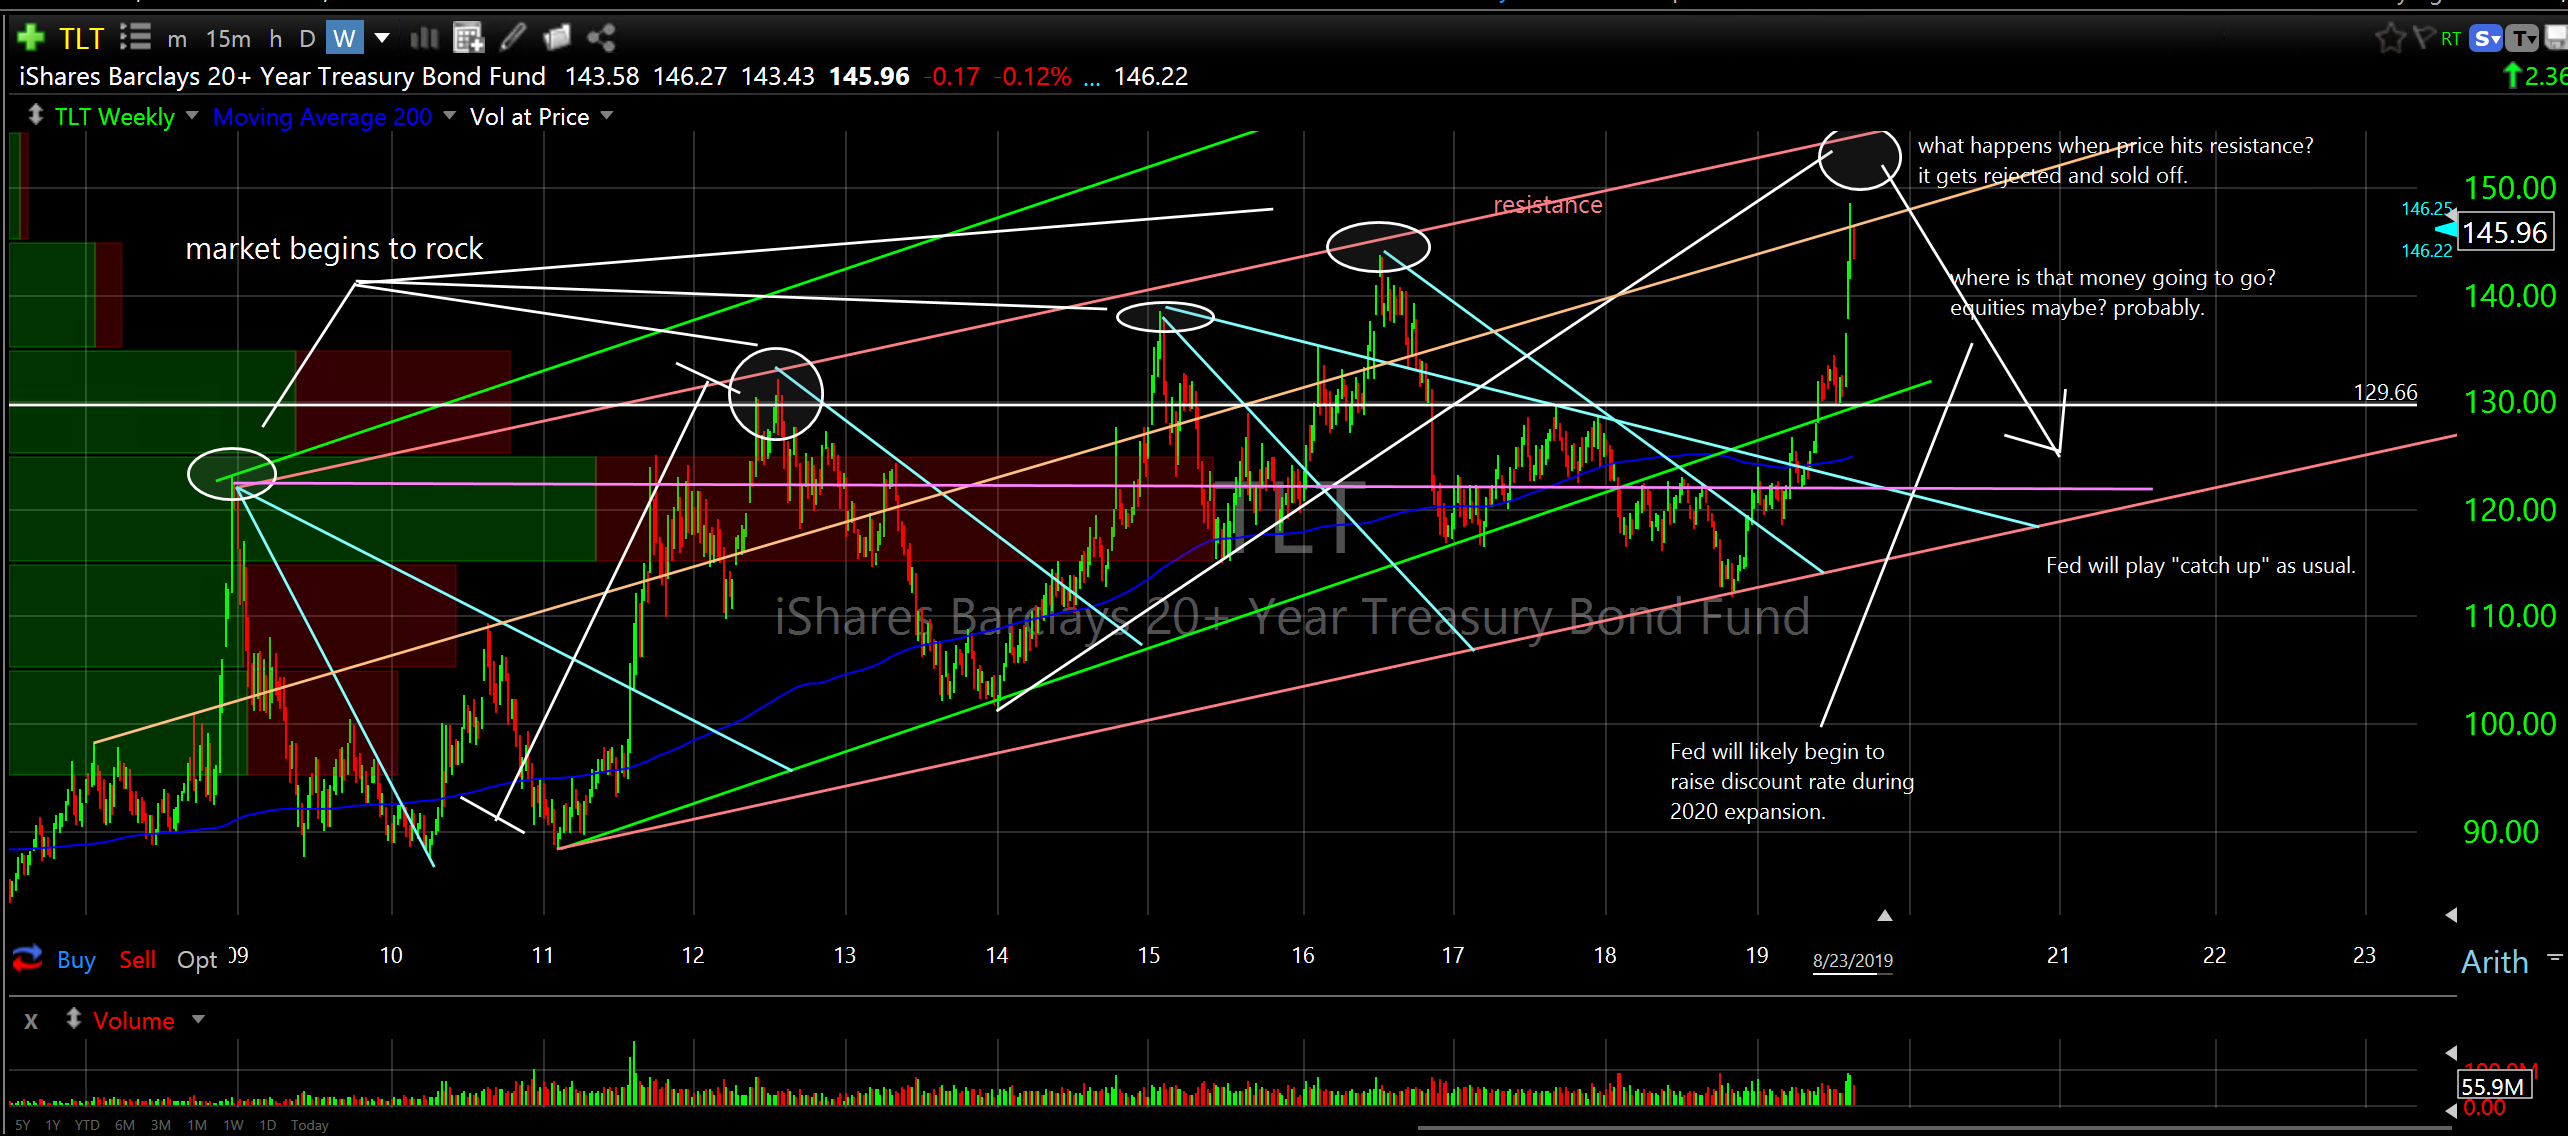
TLT has a history of reversing lower at resistance over and over and over beginning in 2009…and…the broader market has a history of expanding when TLT hits this ascending resistance. Price is very close to resistance as yields are very close to support. So, my thinking is, if the broader market can go deeper into stronger support which would be at the lower end of the large consolidation band we have been in since 2018 and coincide with bonds hitting resistance and reversing and yields reversing higher off support we have the ingredients of another 2017. Yummy. Boing. Zoom. Zing…technical jargon.
I apologize for the messy charts as these are my work charts and you can see how confused I am. I have a few potential reversal zones drawn in but uncertainty reigns as volatility is robust. Hopefully, as we go forward with more data the reversal zone higher might become clearer. We really want to be prepared for this, in my opinion. Remember all of the entry ideas I had in the first few weeks of 2019? This could be better.
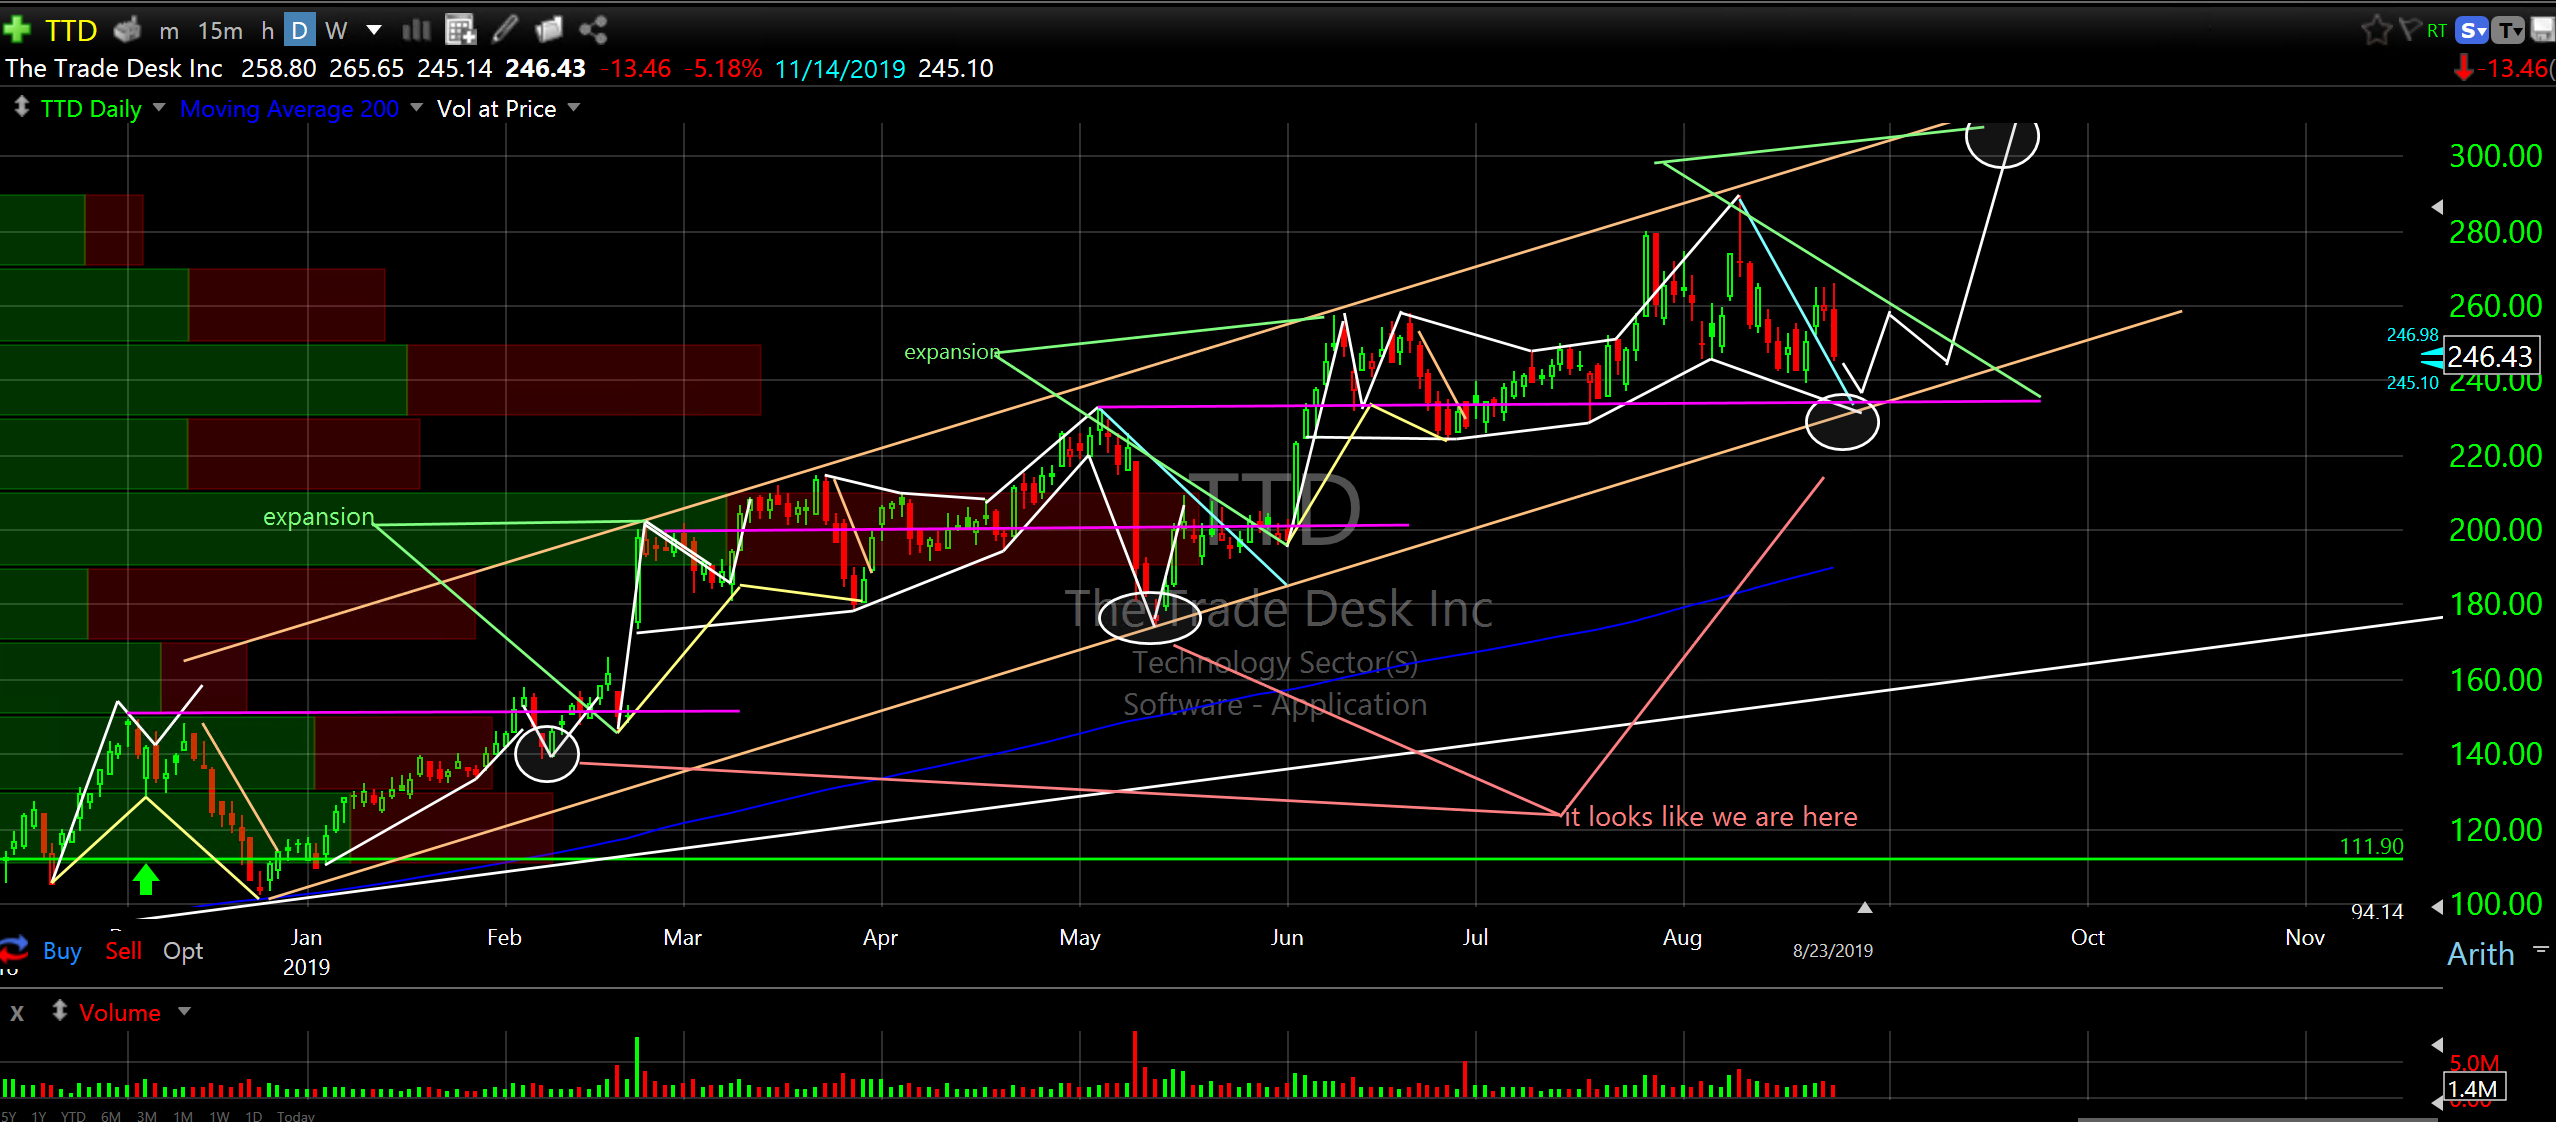
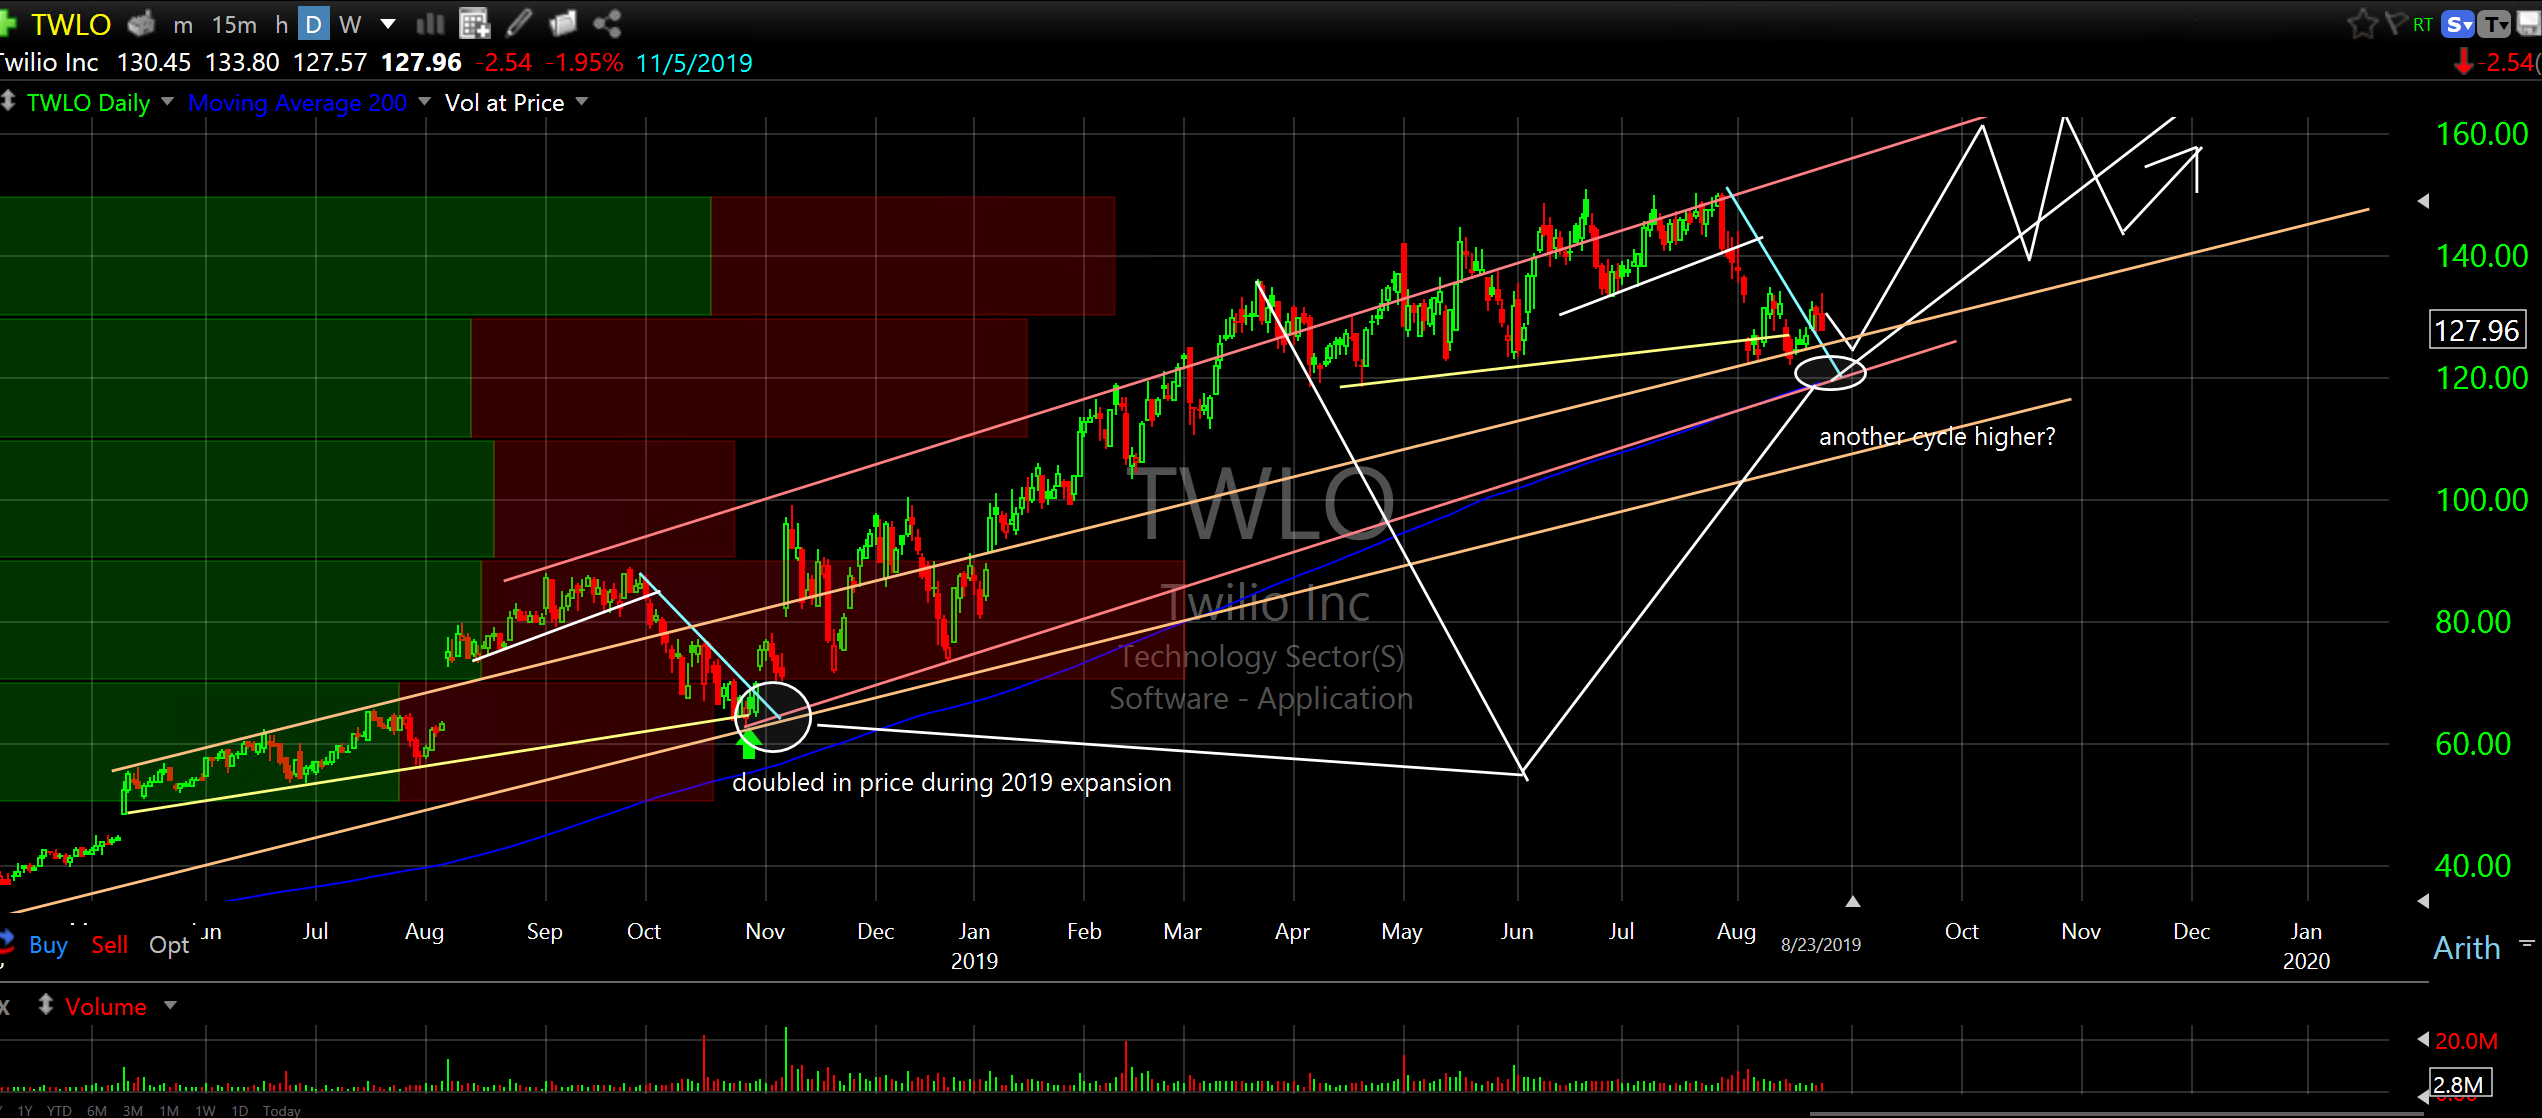
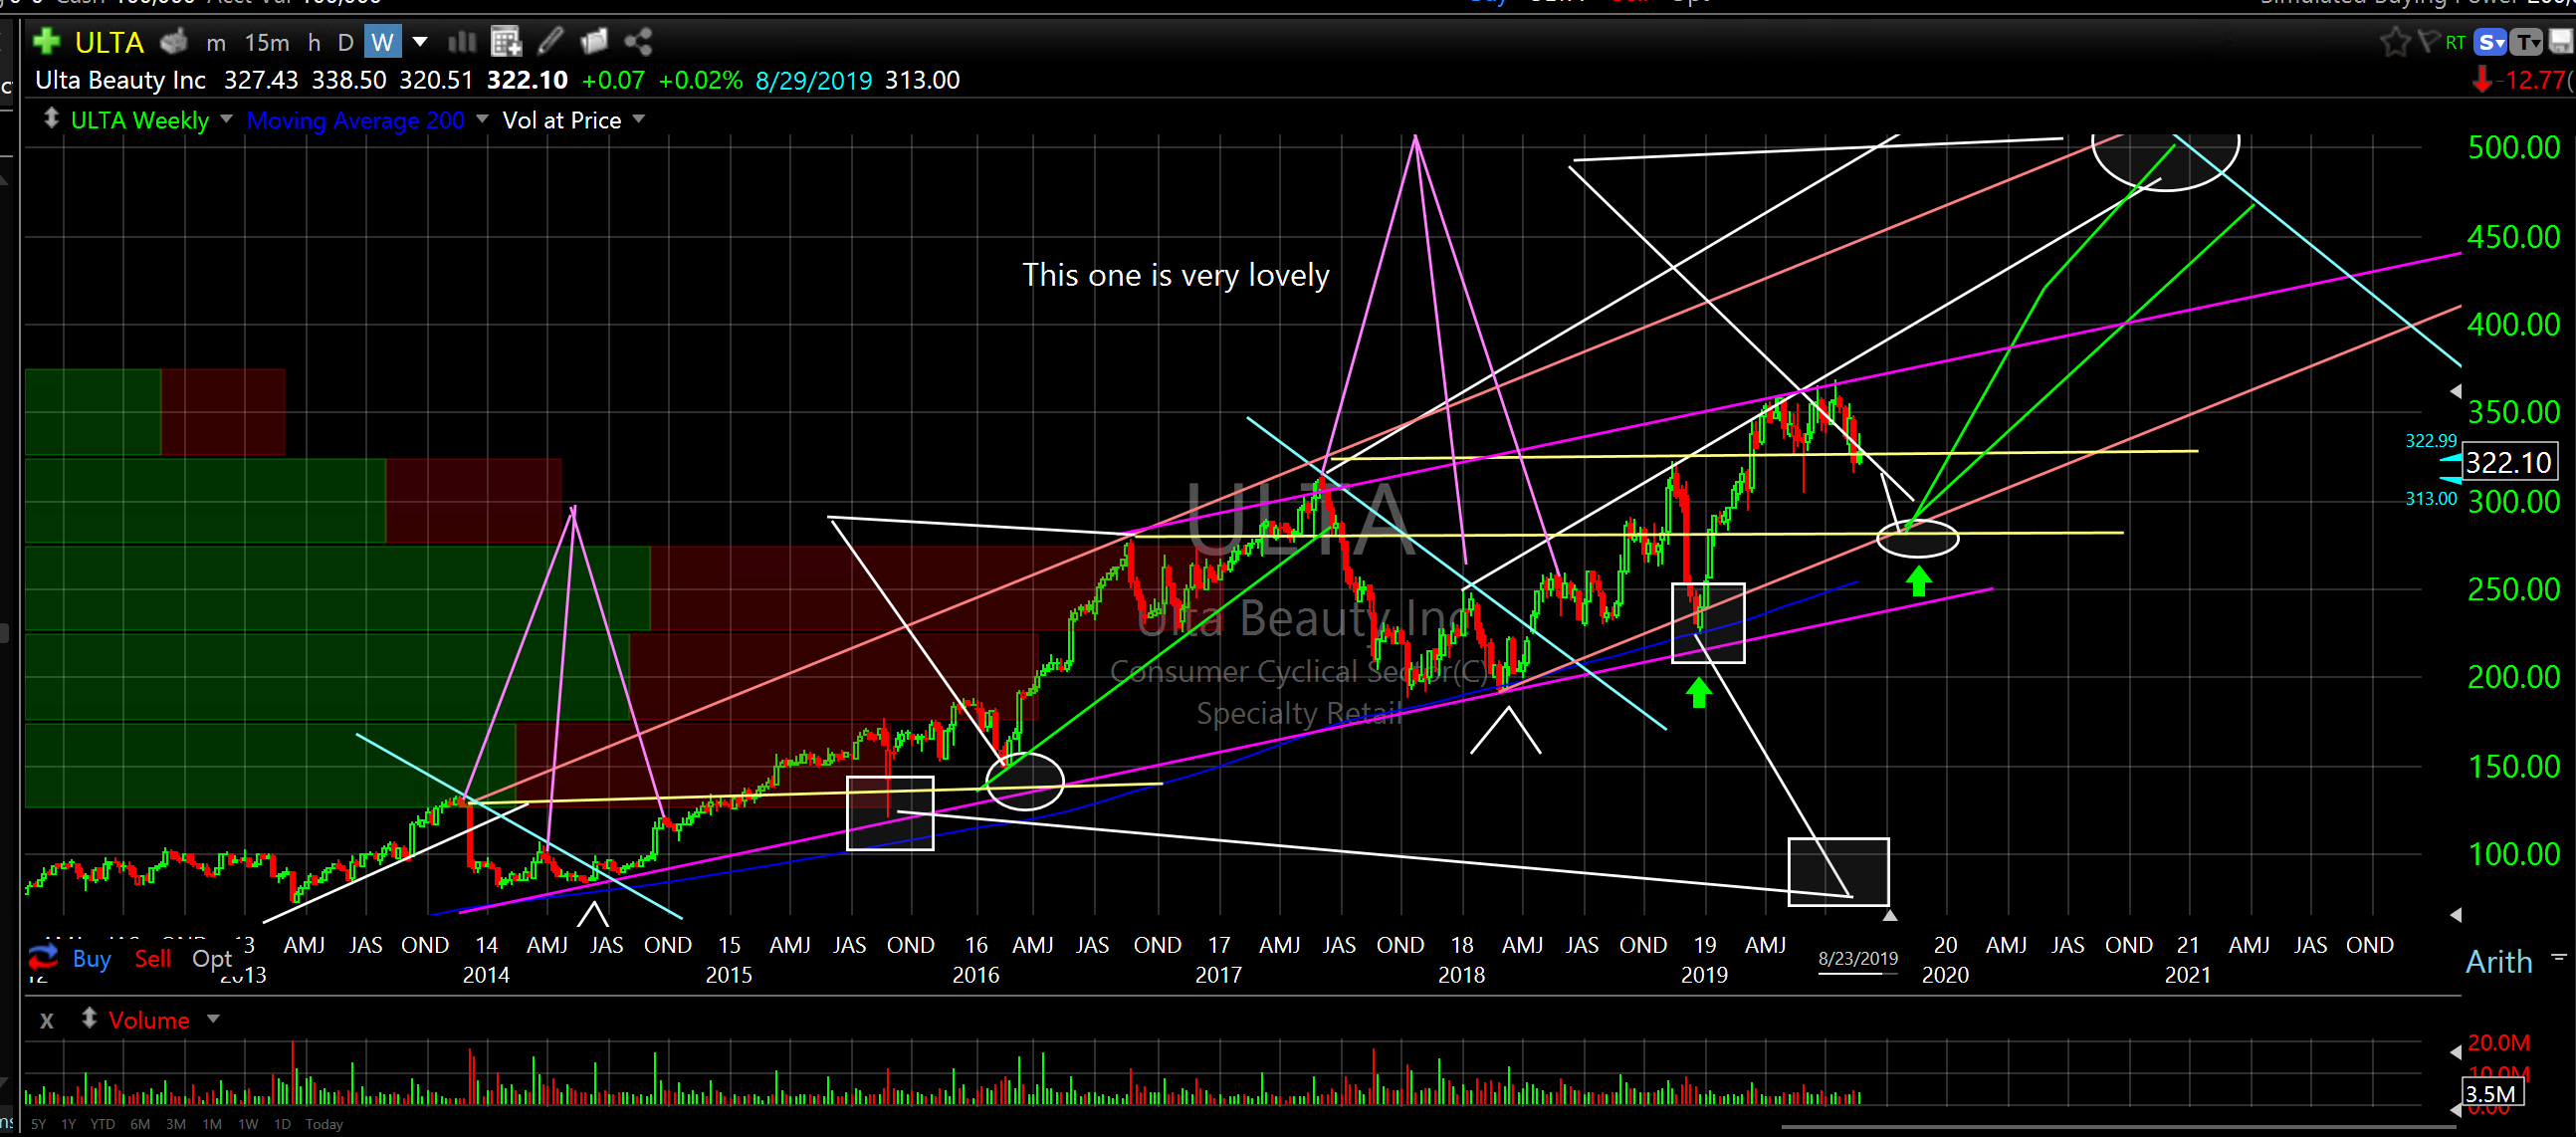
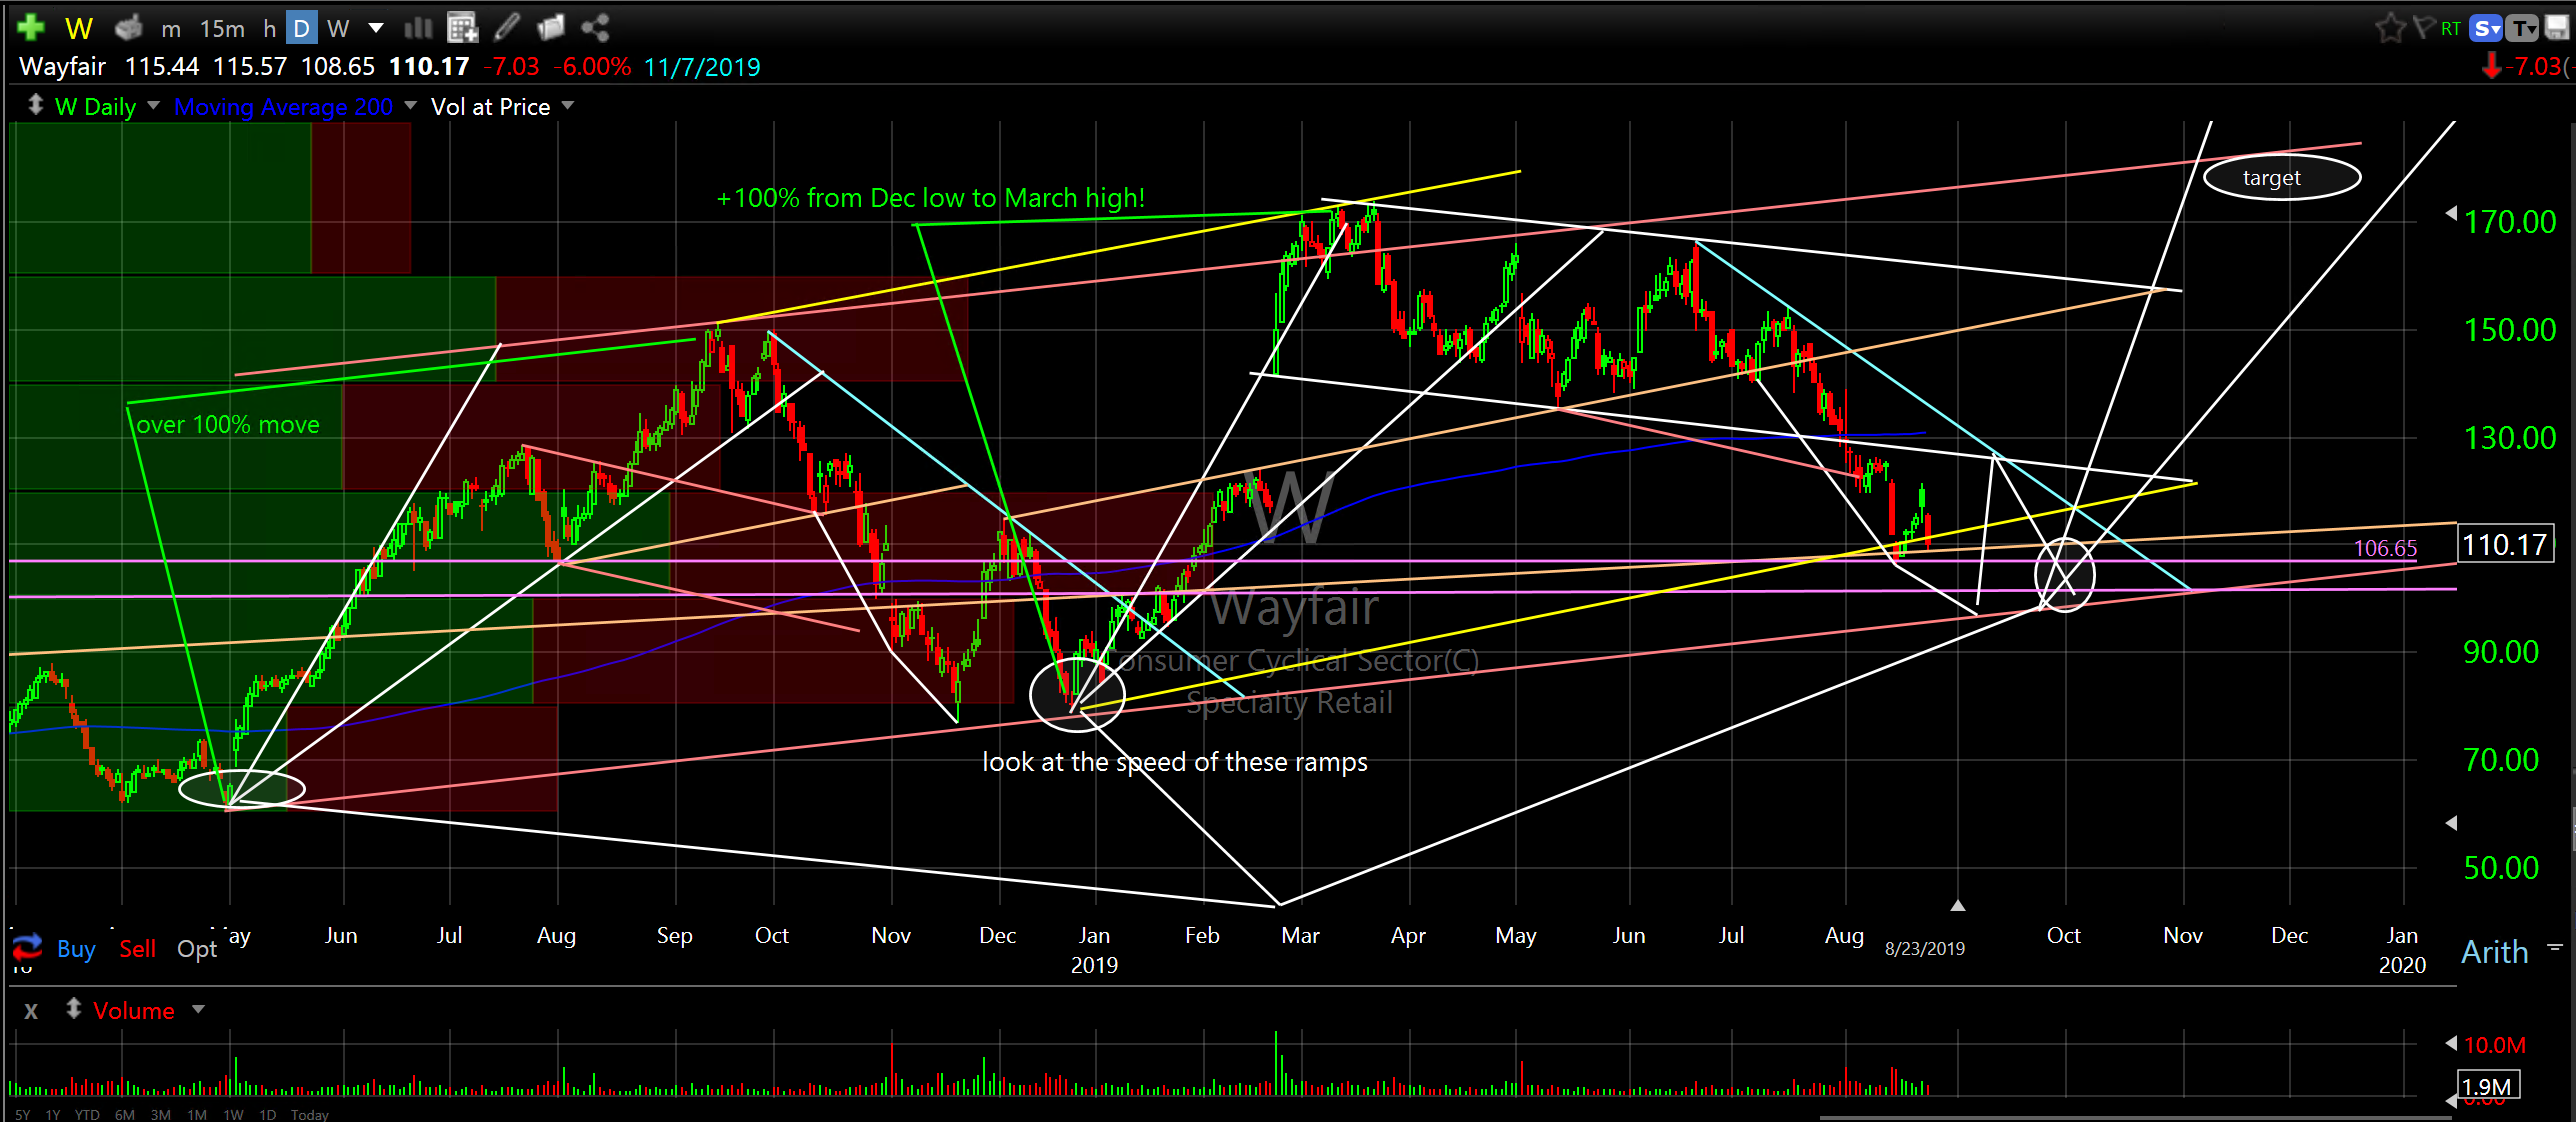
Let’s look at a few that currently appear like they are setting up for good low risk/high reward entries. I would wait on any entries until it looks like this current “dip” has come to a halt and a reversal higher is more clear. These may or may not look good then but they are sure setting up well. I’ve got about 30 more that look good as well…mostly large caps.
The Trade Desk Inc (TTD) daily
Twilio Inc (TWLO) daily
Ulta Beauty Inc (ULTA) weekly
Wayfair (W) daily
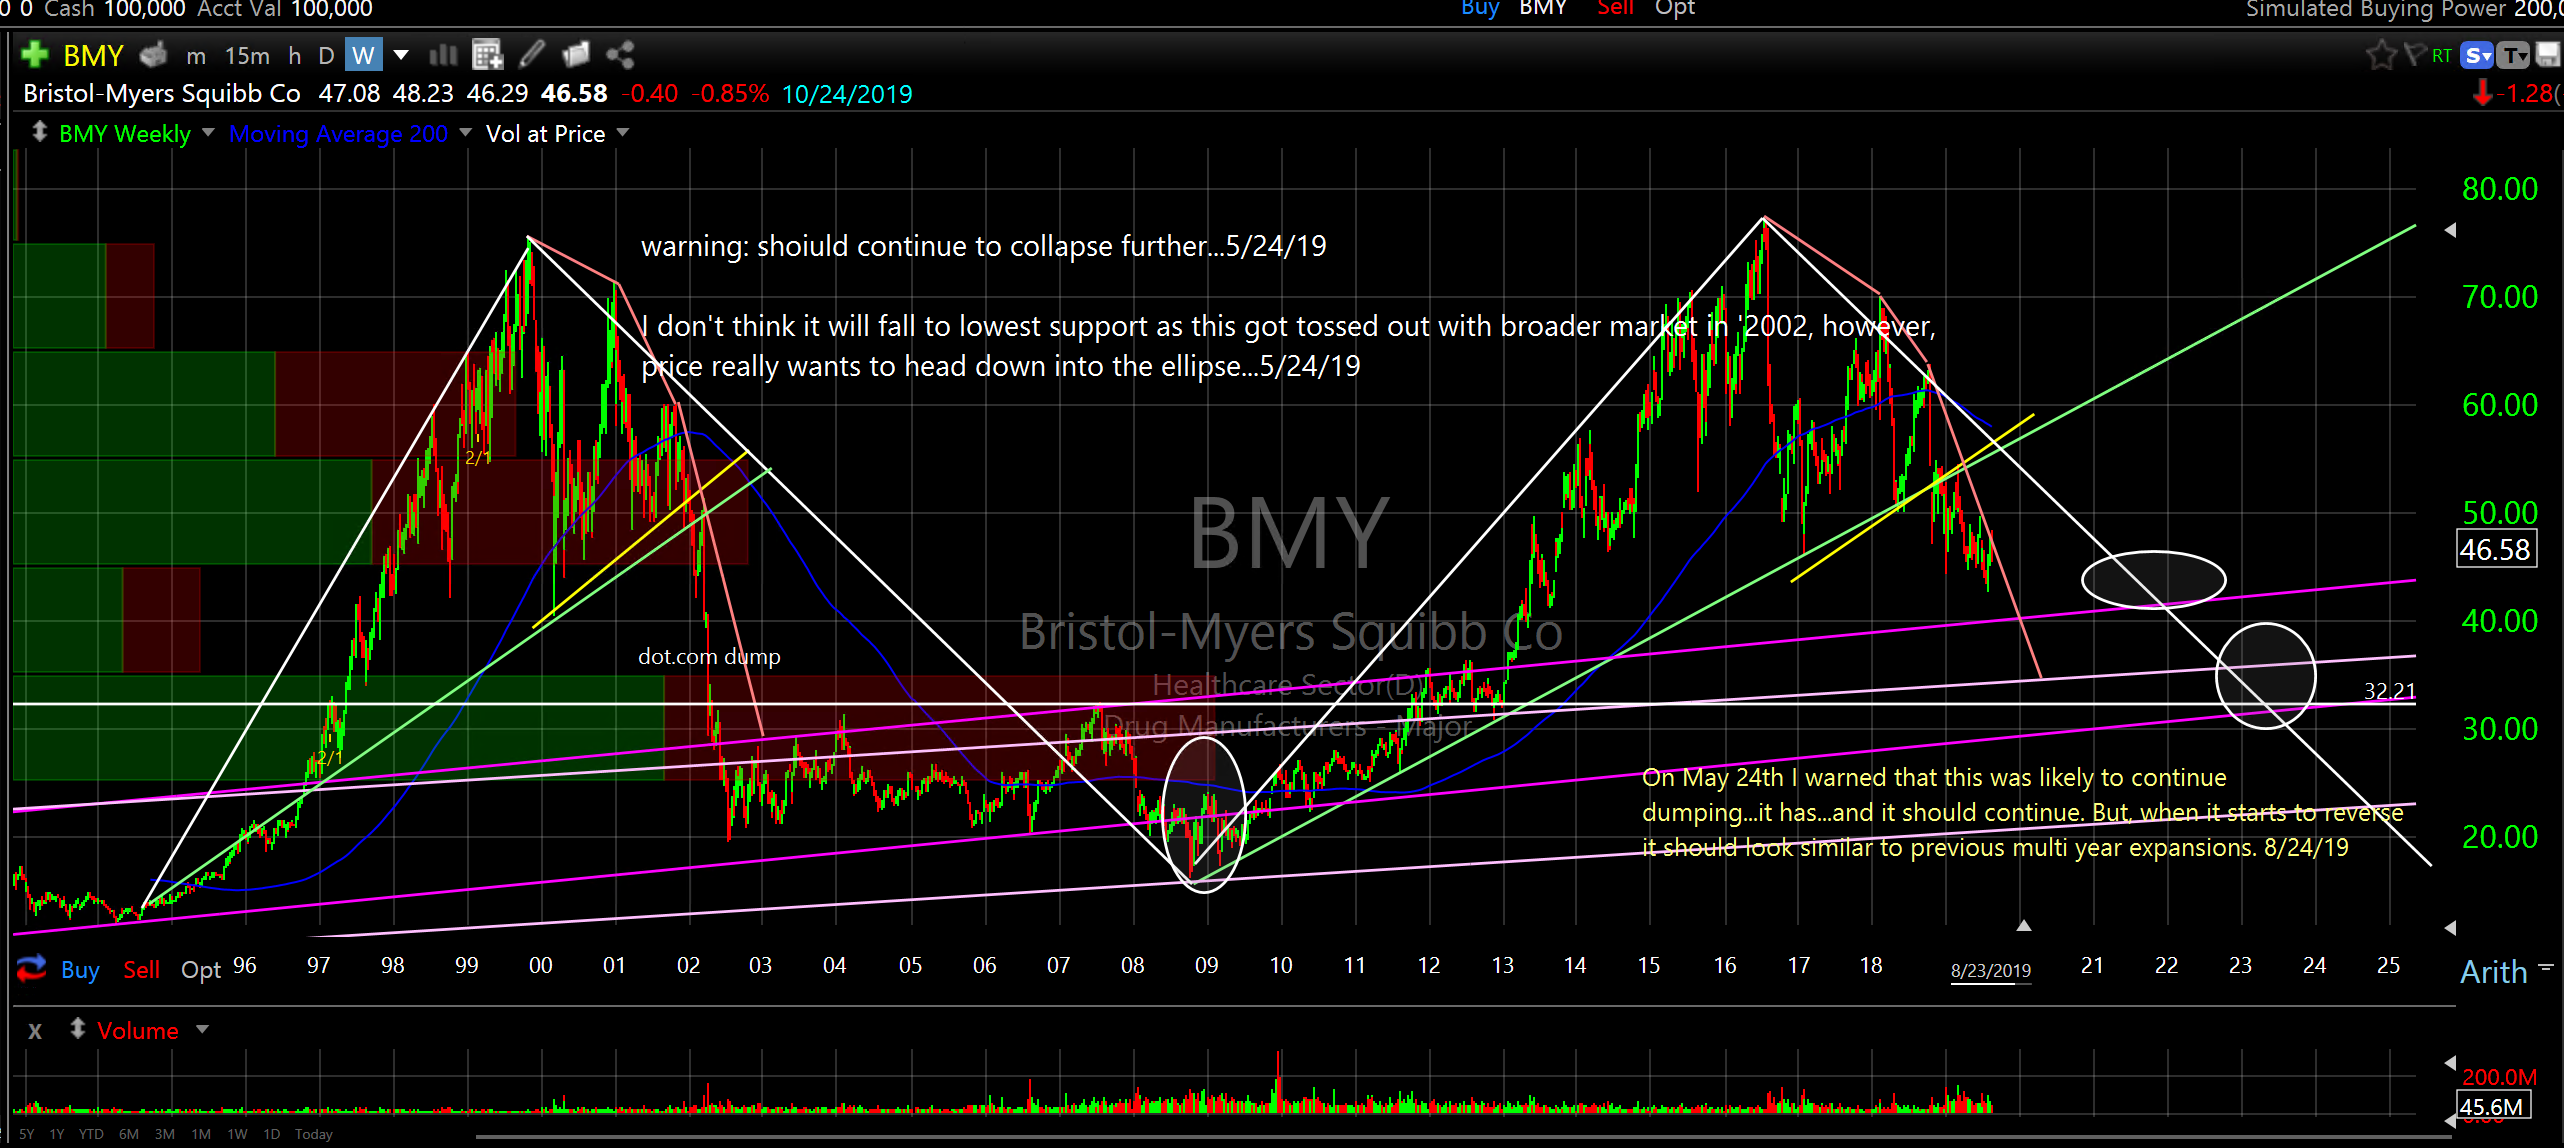
Now let’s look at some really ugly charts just for fun…
Bristol-Meyers Squibb Co (BMY) weekly
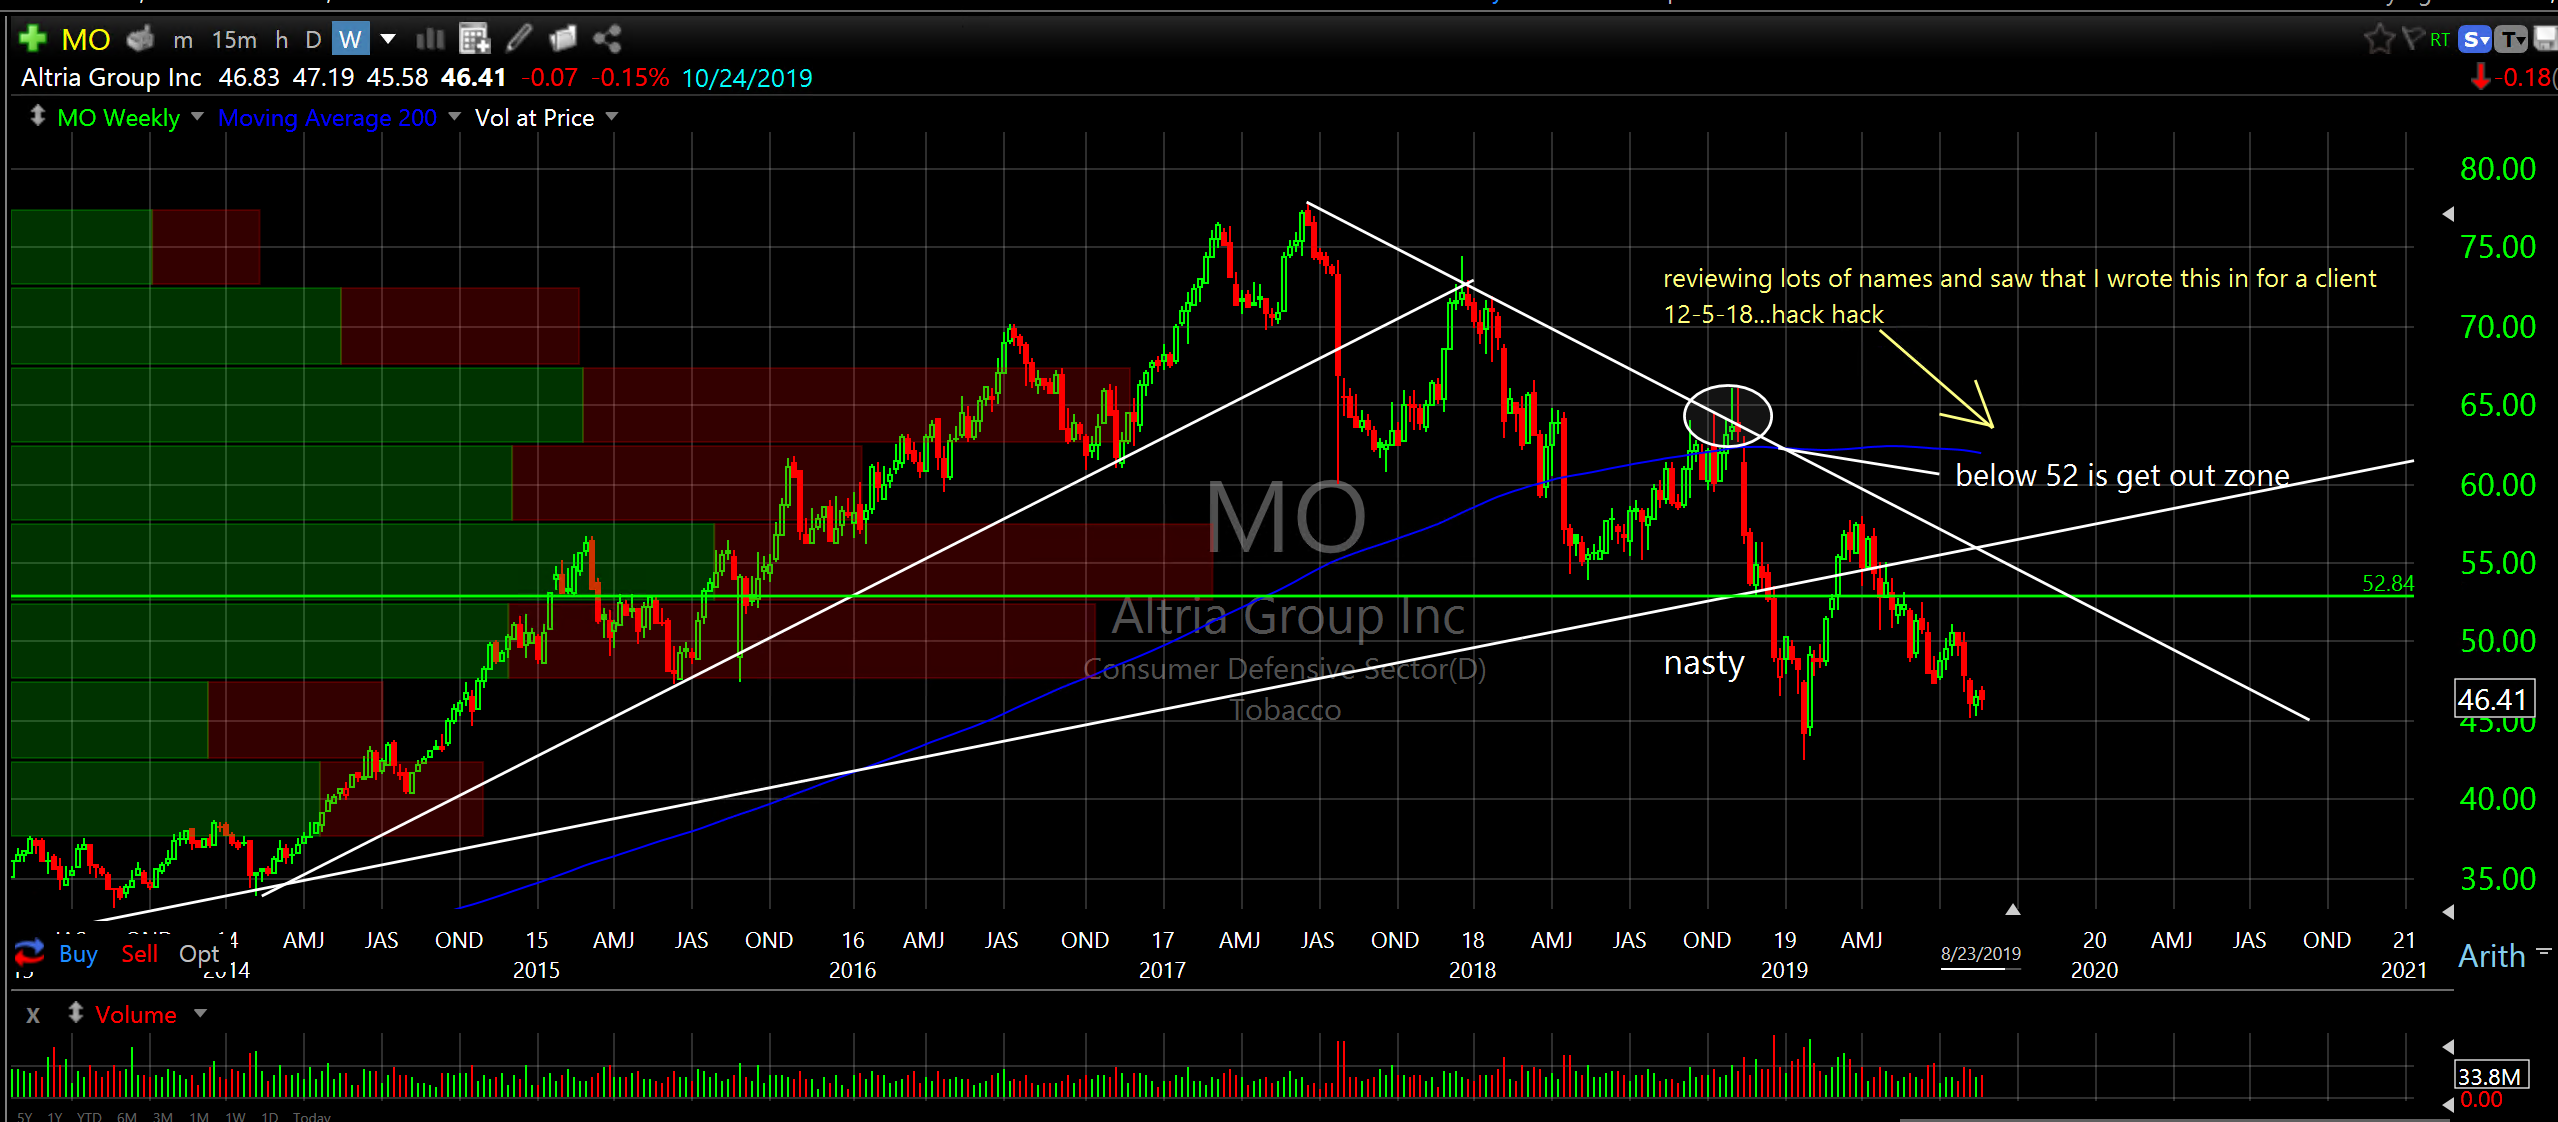
Altria Group Inc (MO) weekly
Remember, these are just my thoughts, due your own due diligence and I could be totally wrong but, if you “see” what is in the charts then that should give you a much clearer vision and a confidence that I have found to be totally and 100% unavailable with traditional fundamental analysis.
I am dumbfounded most days by the group think that CNBC parades around. It sure seems that when the market is up they are all spouting how great everything is and when the market is dumping they are claiming we are on the verge of a recession. Yield curve this and trade wars that and everything in between. What a racket. Not that there aren’t very smart people out there…there are…but it sure seems most of them are reading the same playbook and it’s just plain wrong…imho.
Sorry for the rant. I won’t even mention the investment professionals that just plain ignore risk management. This is the most important concept yet not practiced by most. Huh? How is this possible? They have consumed the Kool-Aid. If your investment professional doesn’t understand/utilize charting…Run!
Reminders:
1. You can put any symbol in the search bar on the web site and look at all the posted charts for that symbol.
2. Every email/post I have made is archived on the web site.
3. Every entry/exit idea I have made is on the web site.
Have a wonderful week,
Don