I hate selling. It feels like being wrong even when you are right.
Who ever sells anyway?
Someone must be selling.
Damn I hate selling.
I’m recommending exiting the following open positions.
iShares Latin America 40 Index fund ETF (ILF) daily
+15%
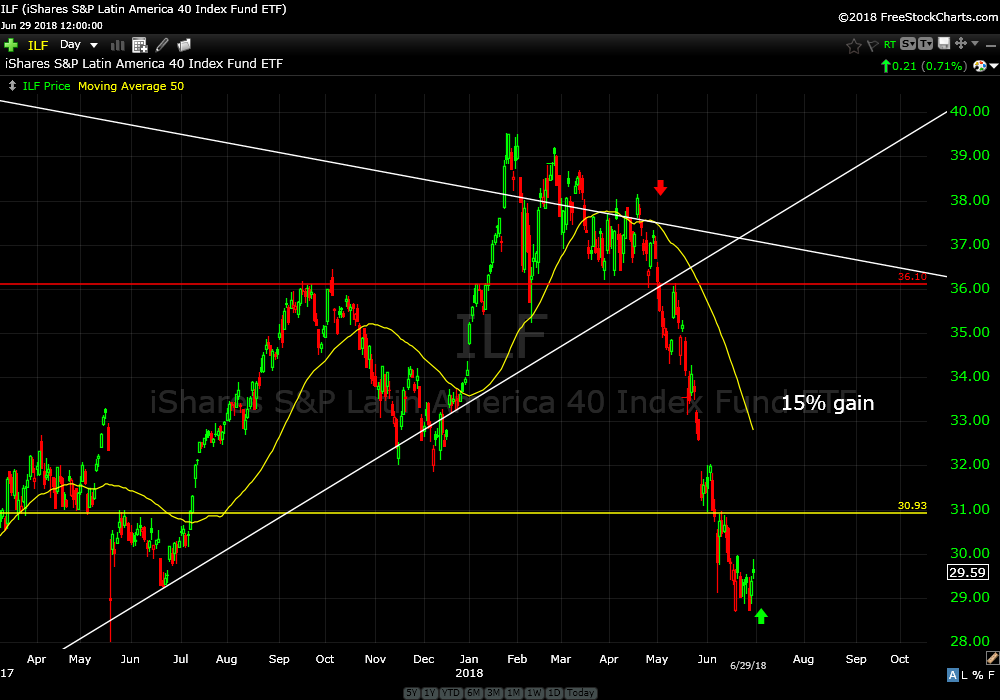
This was about as perfect a trade as they come. Cover the short sell and collect 15% in five weeks. This chart is just beautiful. Selling is beautiful.
SPDR S&P Retail ETF (XRT) daily
+3%
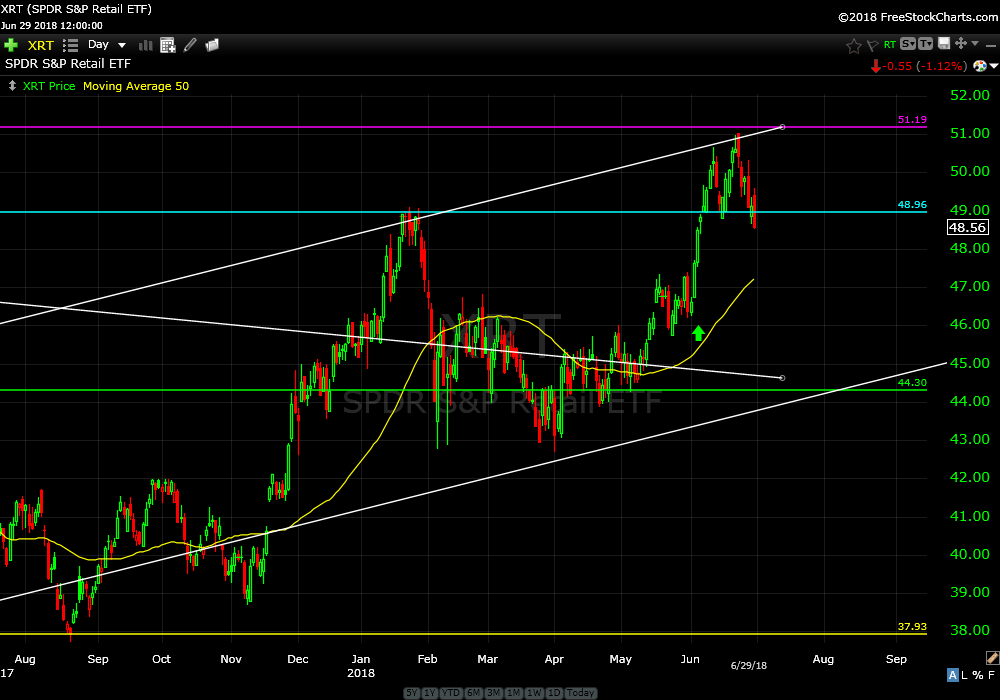
Retail popped nicely after I recommended this last month. It’s up about 3% after being unable to absorb the overhead supply from 2015. Sell and book a small profit as price is likely to go lower before attempting another run at taking out the highs from 2015. Trade smart and we’ll look for a better entry.
Schwab International Equity ETF (SCHF) daily
+11%

I think it’s time to lock in profits and be a little defensive. Price closed Friday at 33.05. I recommended this on March 19, 2017 at 29.8 ( 11% gain ). The risk is price goes to 30.00 before it goes back above 34.00…and…if 30.00 doesn’t hold there is much more demand around 27.00.
iShares MSCI Mexico Index Fund ETF (EWW) weekly
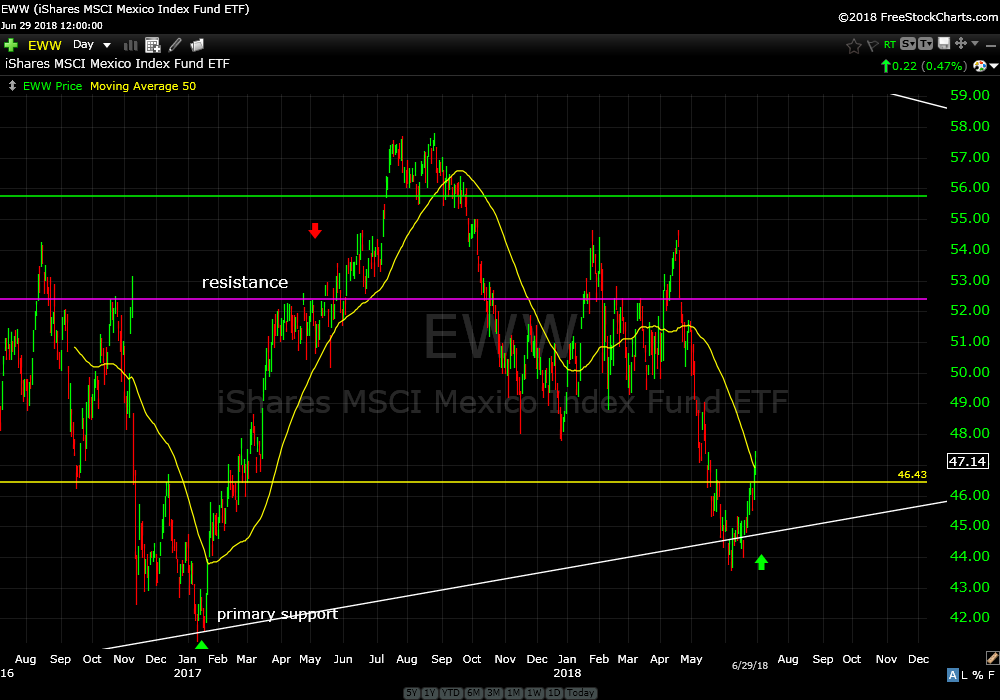
Where is there demand right now I hear you ask. Think tortillas and tequila. Yes, Mexico. Redeploy those international dollars and buy some EWW. Price has reverted down into a long term mean where there is rising demand. This correlates well with taking profits on the Latin America short sell.
Intel Corp (INTC) daily
+25%
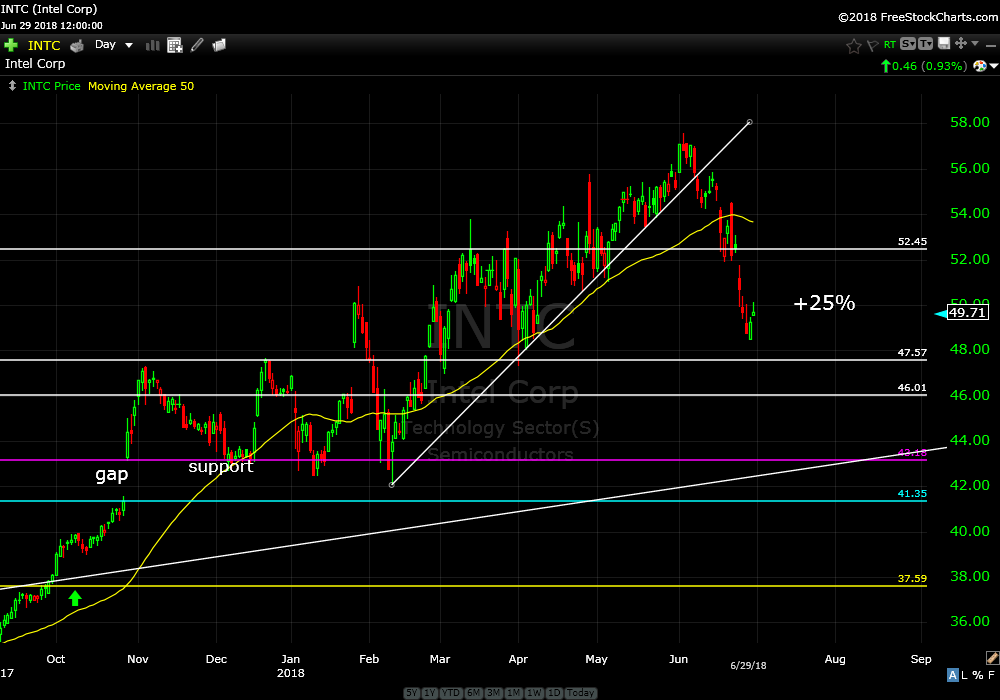
I really hate selling INTC. It’s been such a good performer from my October 9, 2017 recommendation until the last two weeks. We are up 25% in about 9 months. Book it Dano. This doesn’t look like it’s going straight back up any time soon. Long term looks good but I would prefer to take profits for now and avoid any possibility of further decay. Remember, you can always leg in and leg out.
SPDR EURO STOXX 50 ETF (FEZ) daily
+5%
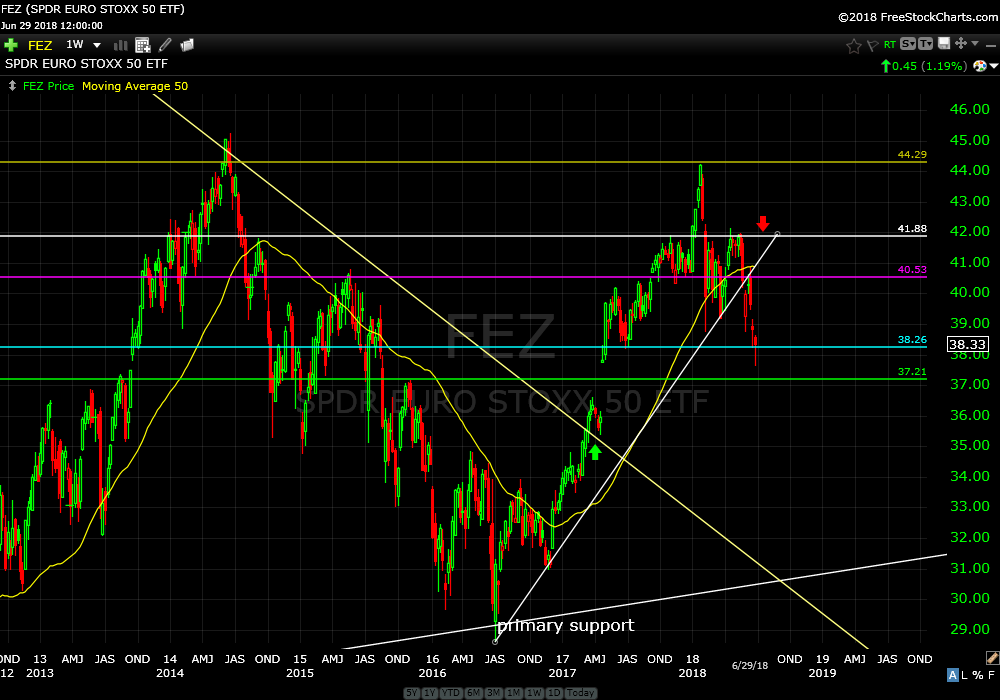
There is just too much overhead resistance to absorb and therefore failure to clear the high from 2014. Price made a nice run from my March 29, 2017 recommendation but it’s time to collect 5% and move on. There is nothing wrong with being a little defensive by reducing exposure.
So, no wholesale selling. Just a little mid year exposure adjustment.
Have a great week!
Trade Smart,
Don