Hey Folks,
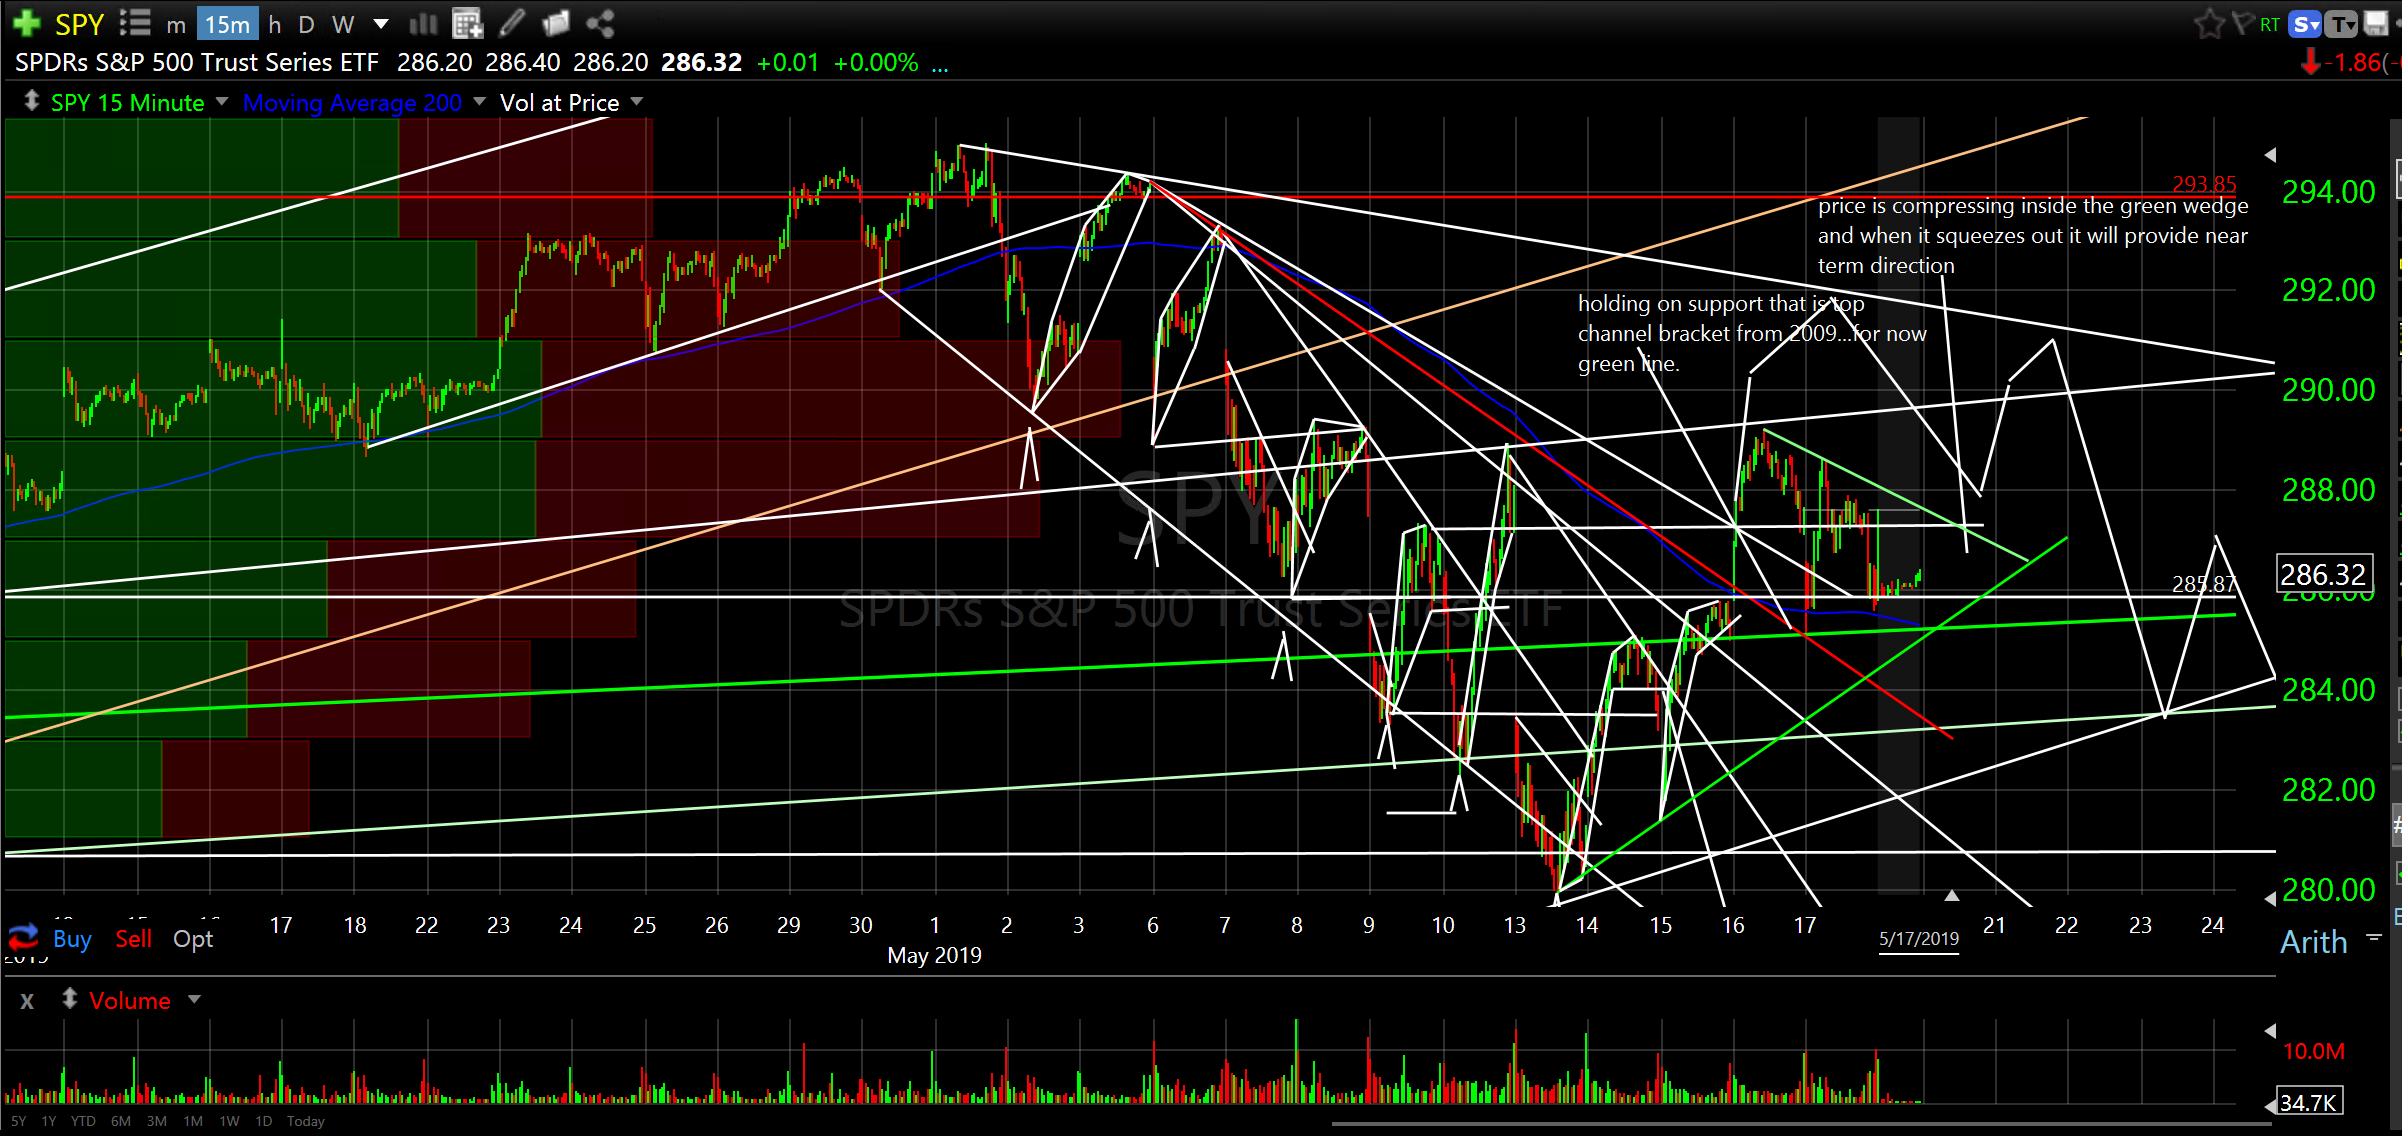
SPY, the S&P 500 Index ETF, was all over the map this week. It broke above the top of the descending channel from the downward reversal that began at the beginning of the month and went half way up to the highest descending resistance before the slow collapse began Friday morning. Price also retraced about 60% of the dip from the last two weeks. This is a normal retracement and if the descending green line gets taken out price is likely to continue sliding. I still like the broader market longer term but we might get a bit choppy during the summer months. I’m still thinking SPY 265/270 is a likely place to bottom for a robust expansion into late 2020. See 15min chart below for a closer look at price action in SPY.
S&P 500 Index ETF (SPY) 15-minute
In my quest to provide technical guidance on low risk entries and strategic exits check out the following. There are many more entries setting up but let’s not rush. Slow is steady, steady is smooth, smooth is fast.
Now it’s time for Exits and Entries…
Exits First…
Baozun Inc (BZUN) daily
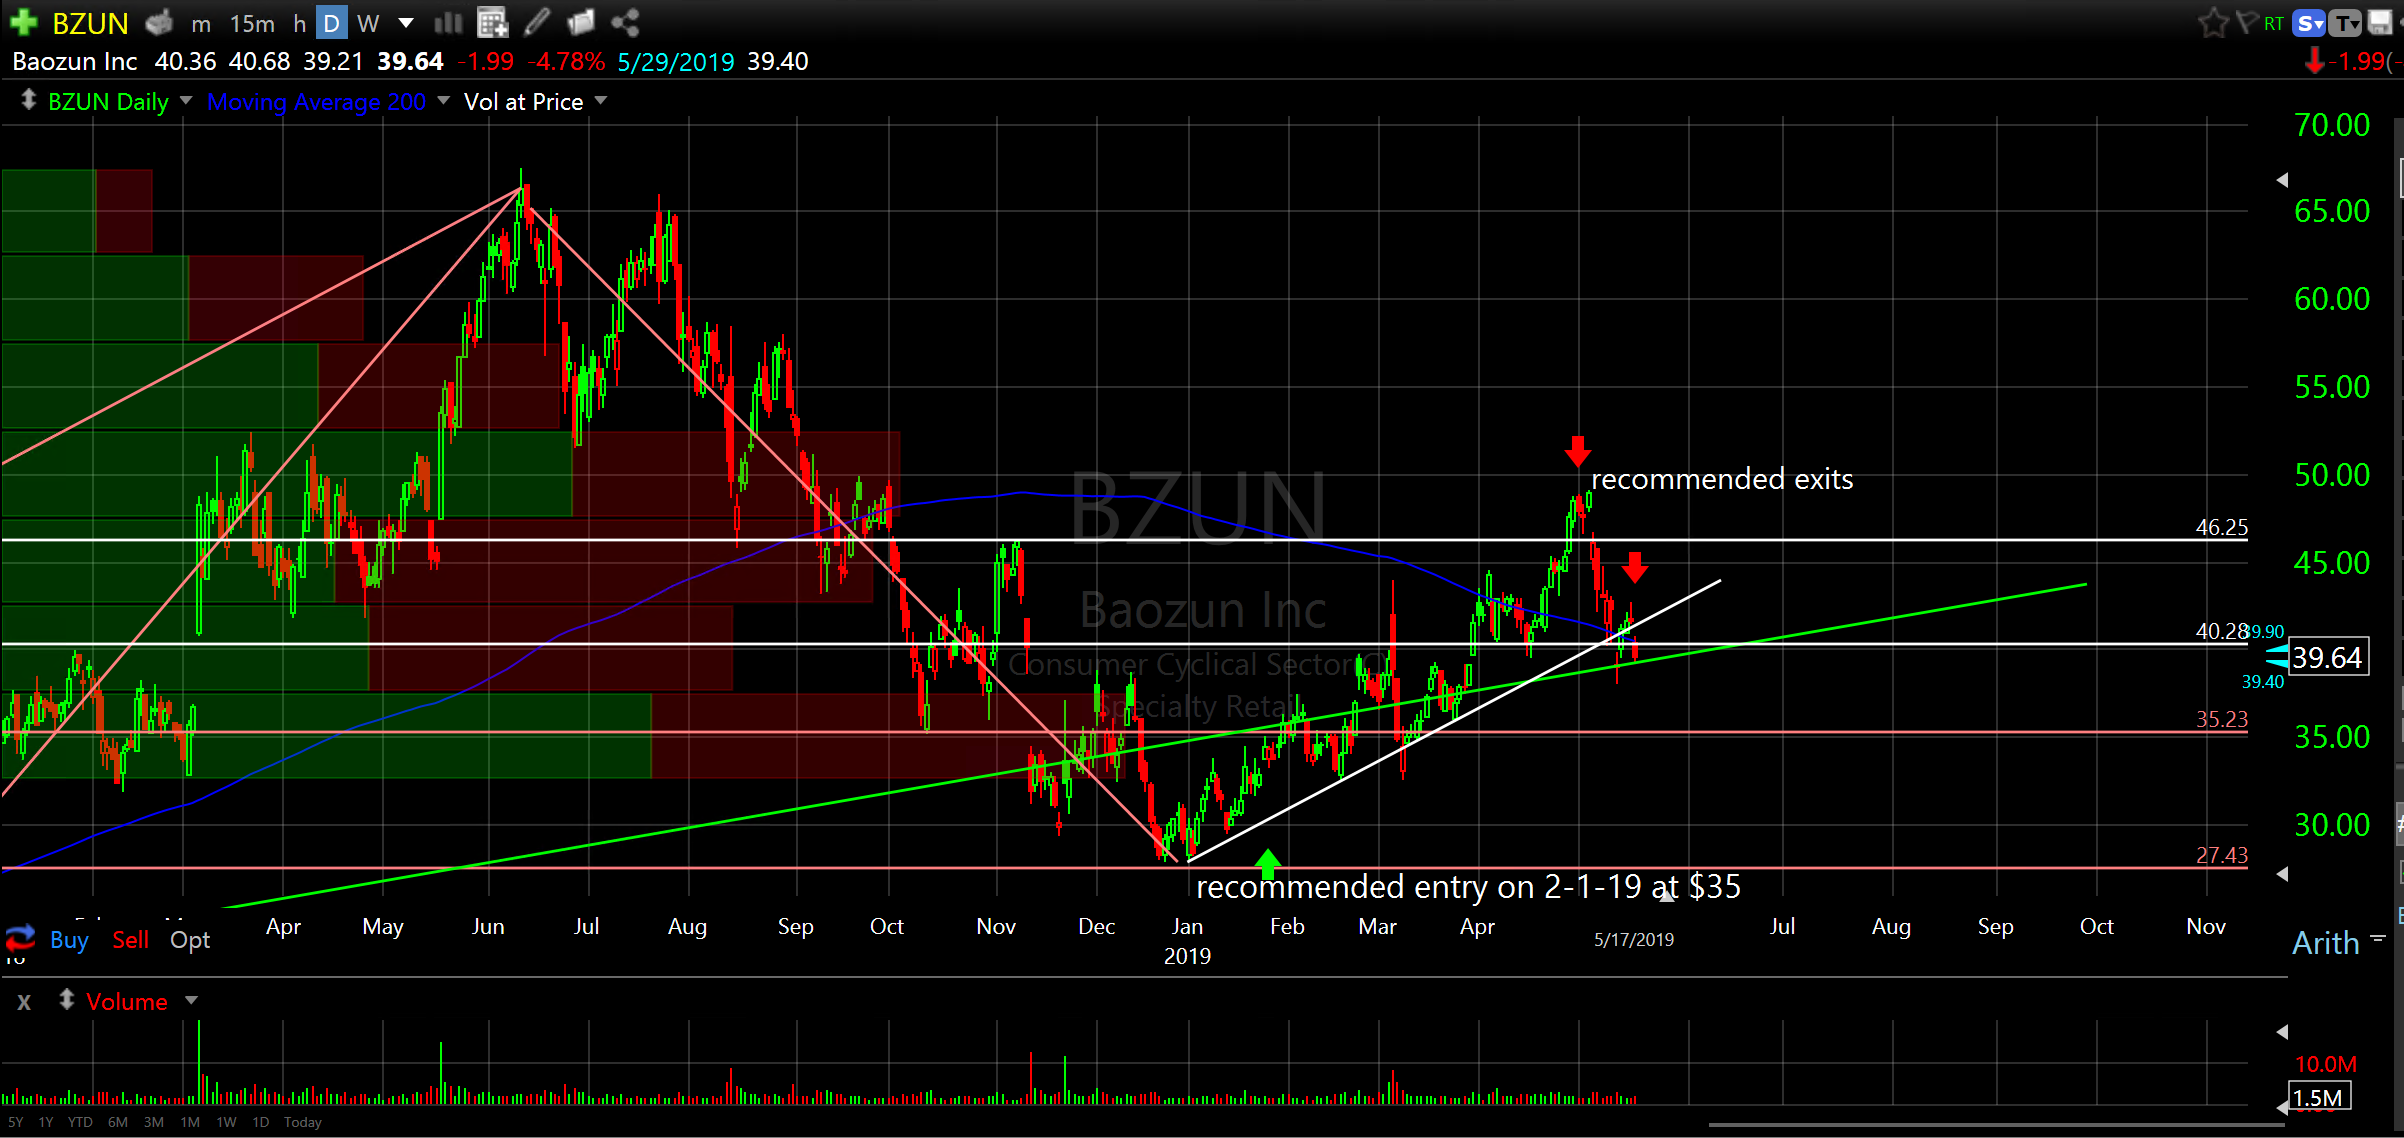
Baozun Inc (BZUN)… exit for a 13% gain. I recommended partial profits on May 6th for a gain of 31% as well. We can reenter later. I still love China. Remember, you can always hold a little. I’m not negative longer term on this but it looks like it wants to give back about 10% soon. Side rant…I don’t want to sell it either. I just want it to keep running. I don’t want to give back gains either. The dilemma continues…thus the charting.
AXT Inc (AXTI) daily
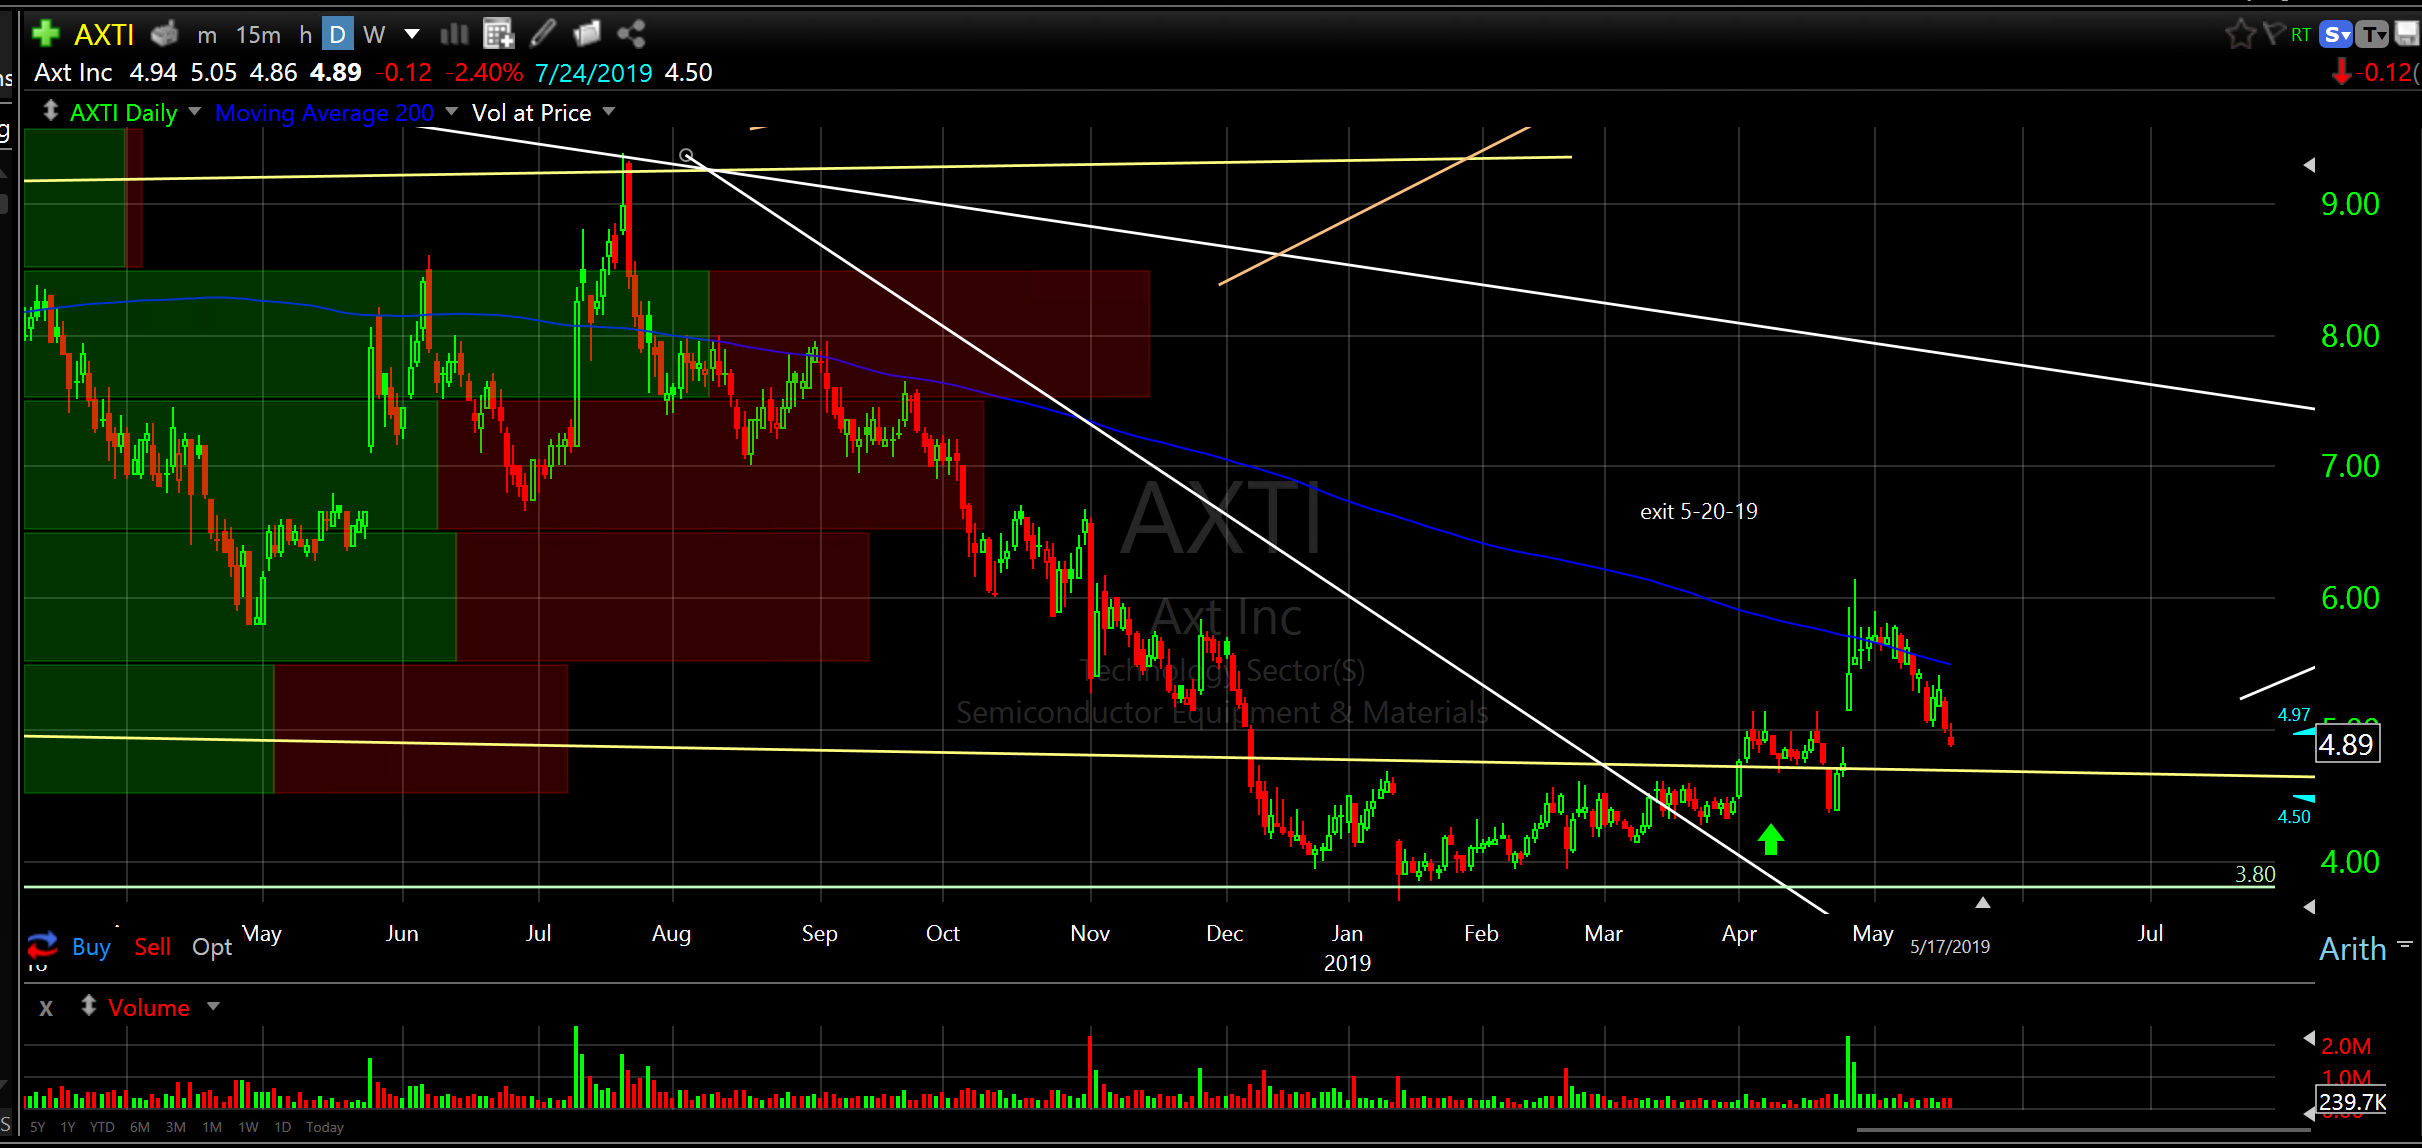
AXT Inc (AXTI)… exit for a very slight gain. I don’t like recent price action and I think it might just slog down for awhile before resuming expansion. I think a better entry awaits in the future. I think I was wrong on the timing of the entry on this one. Sorry.
Entries
California Resources Corporation (CRC) daily
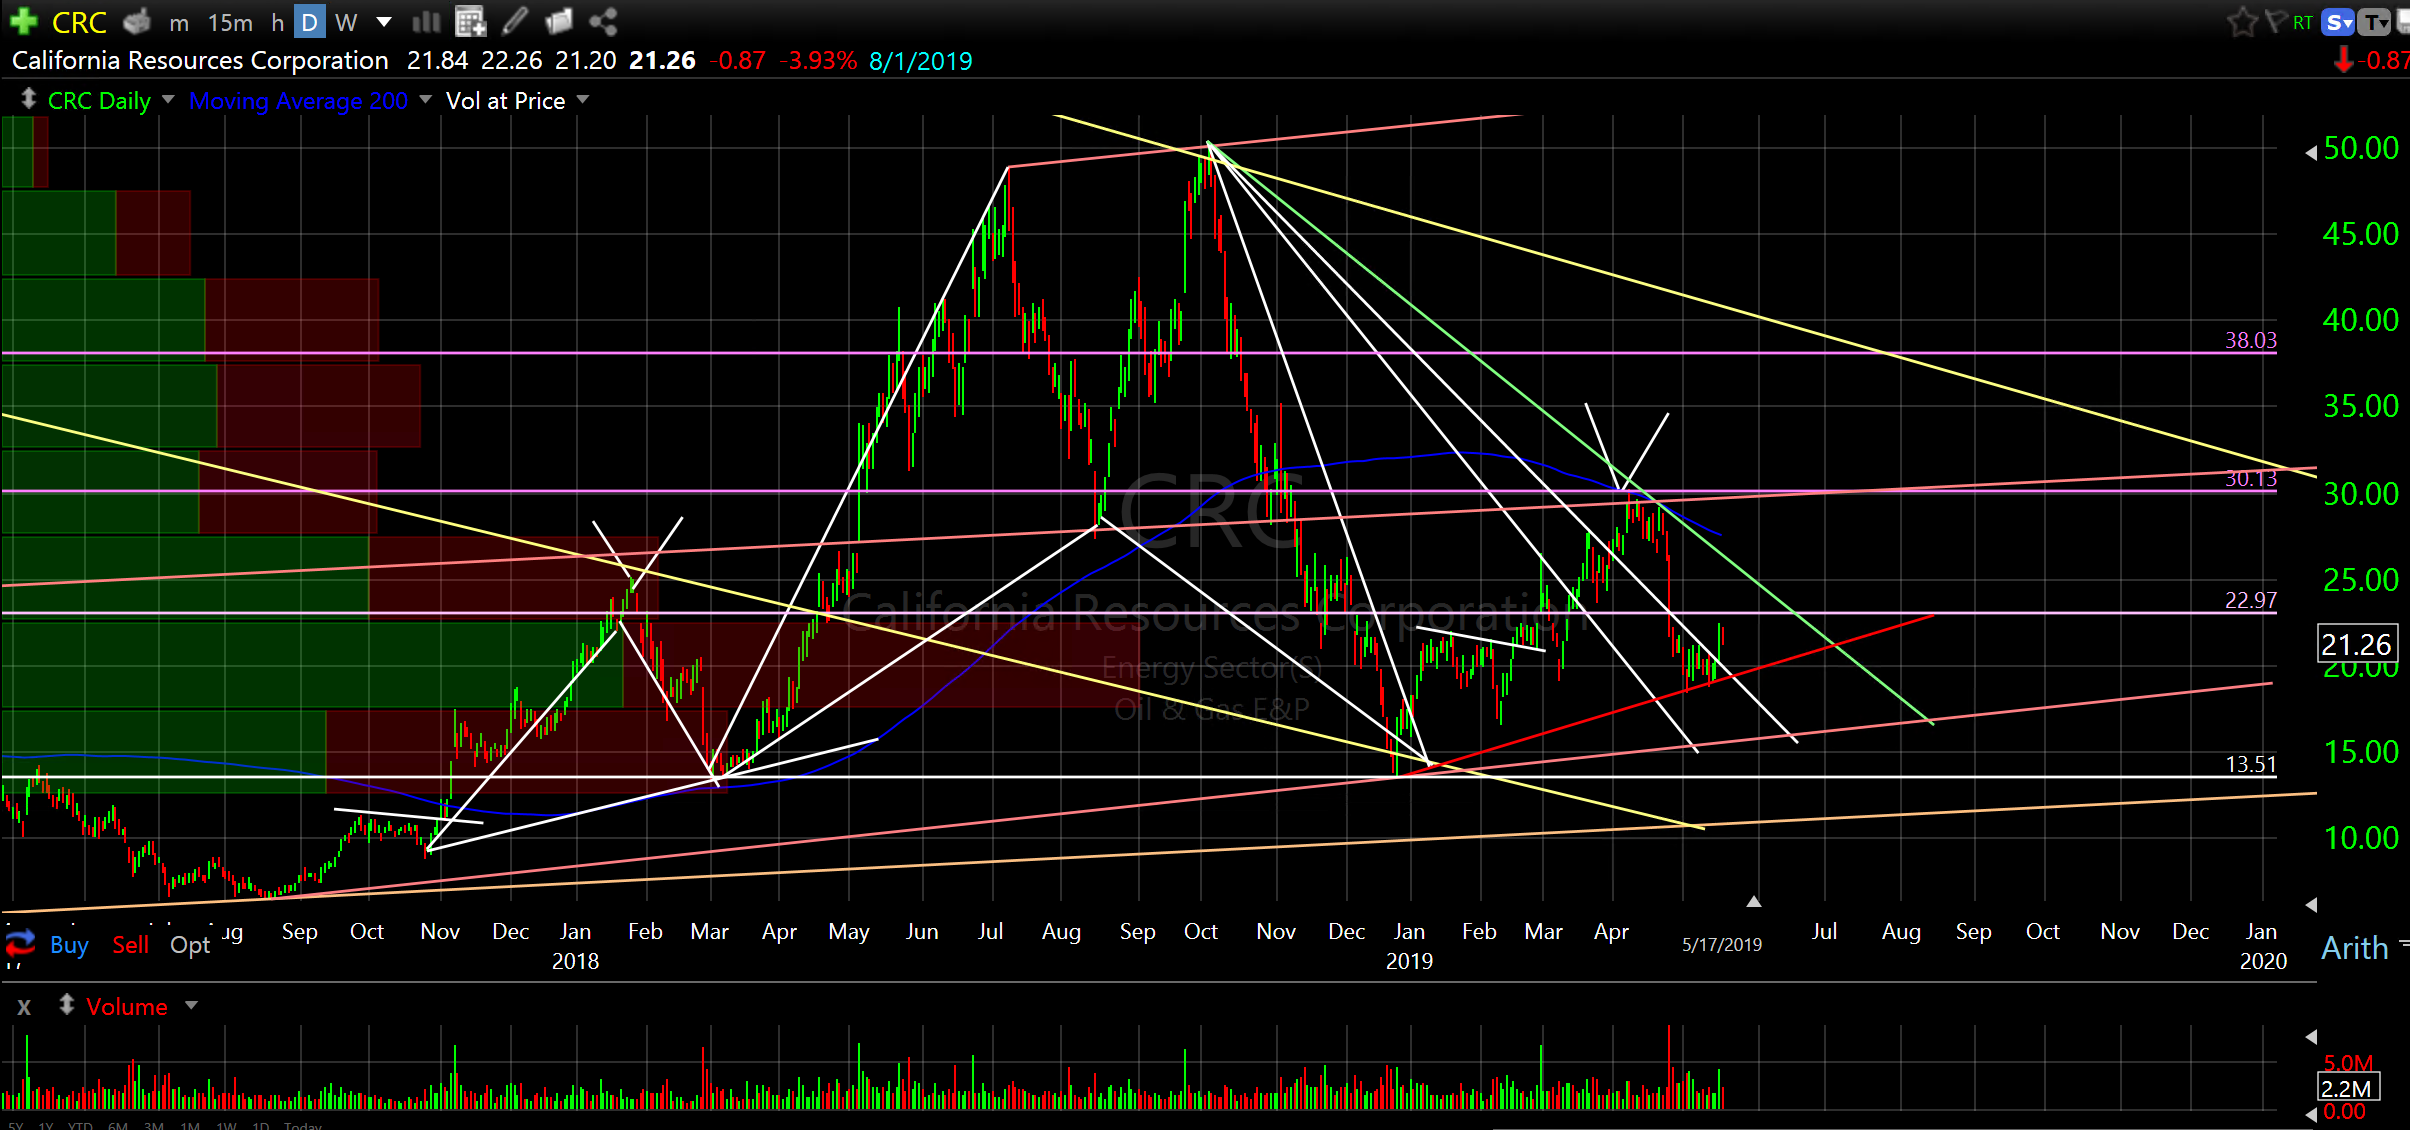
California Resources Corporation (CRC)…This one is high risk/wide range. Please note correction late last year, $50 to $15, bottomed at $15 then doubled to $30 just this year. Now it’s back to $20ish and trying to base. Use ascending red line as support. If it breaks below red line it will seek lower support (ascending pink line). This is one where I would leg in slowly.
I don’t really talk about position size because we each have our own risk tolerance. I generally don’t exceed 3% in any one position and this one would be much less than that. This one is risky…treat it as such. Speculative.
American Airlines Group Inc (AAL) daily
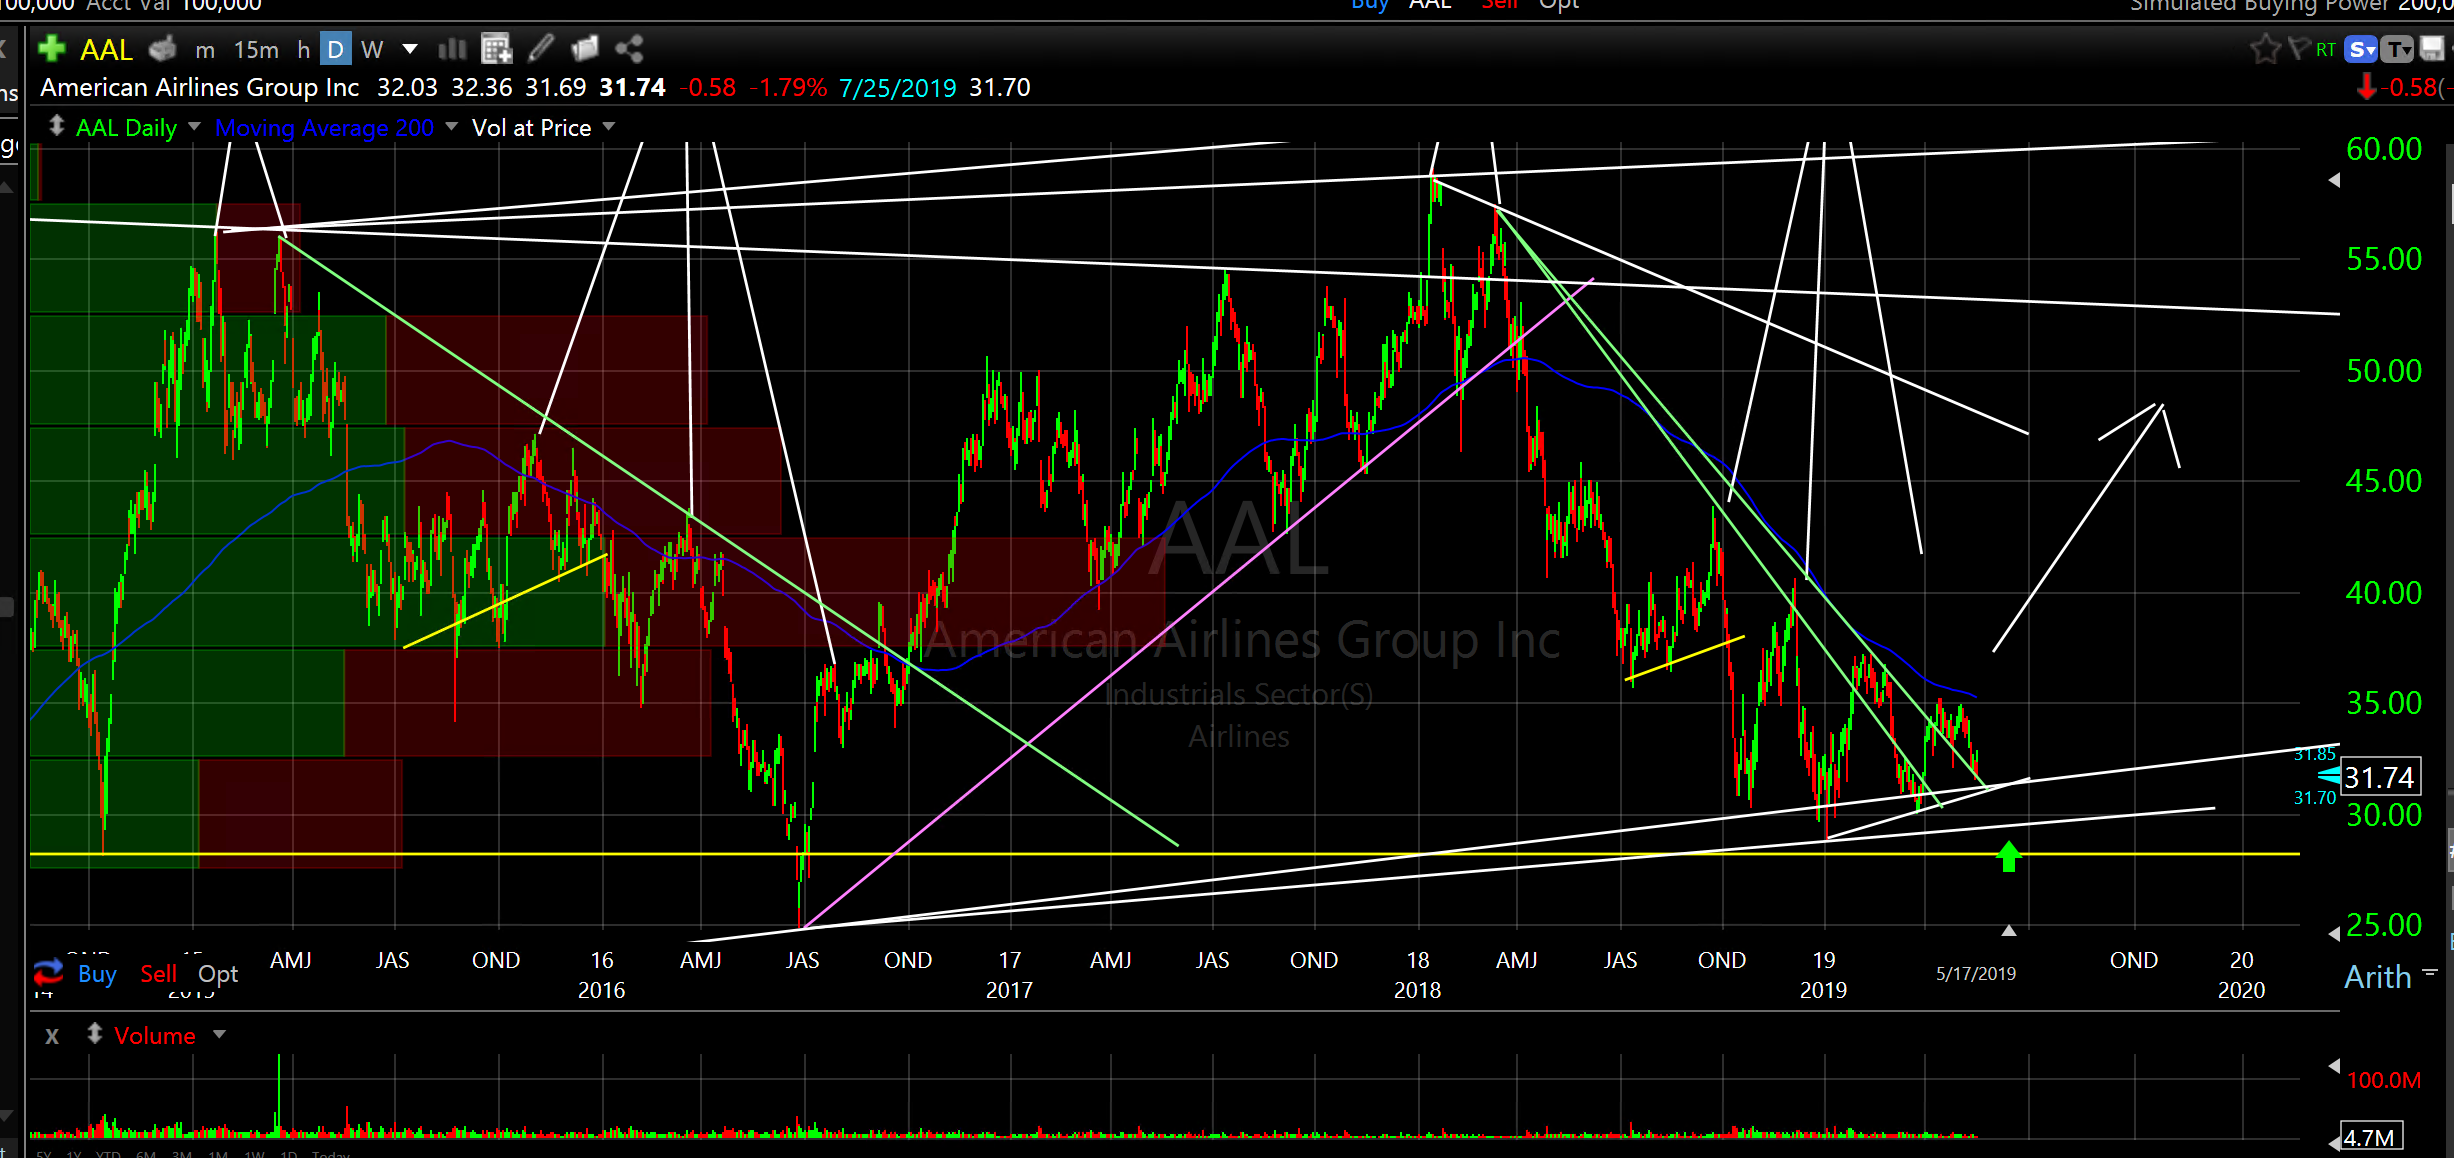
American Airlines Group Inc (AAL). I love this chart. Long multi year support with consistent, historical expansion from high 20’s. Good shorter term bottoming formation since free fall in October. Multiple breaks up through descending resistance (green lines). Classic low risk/high reward entry. Pays a dividend of 1.26%.
Canopy Growth Corporation (CGC) daily
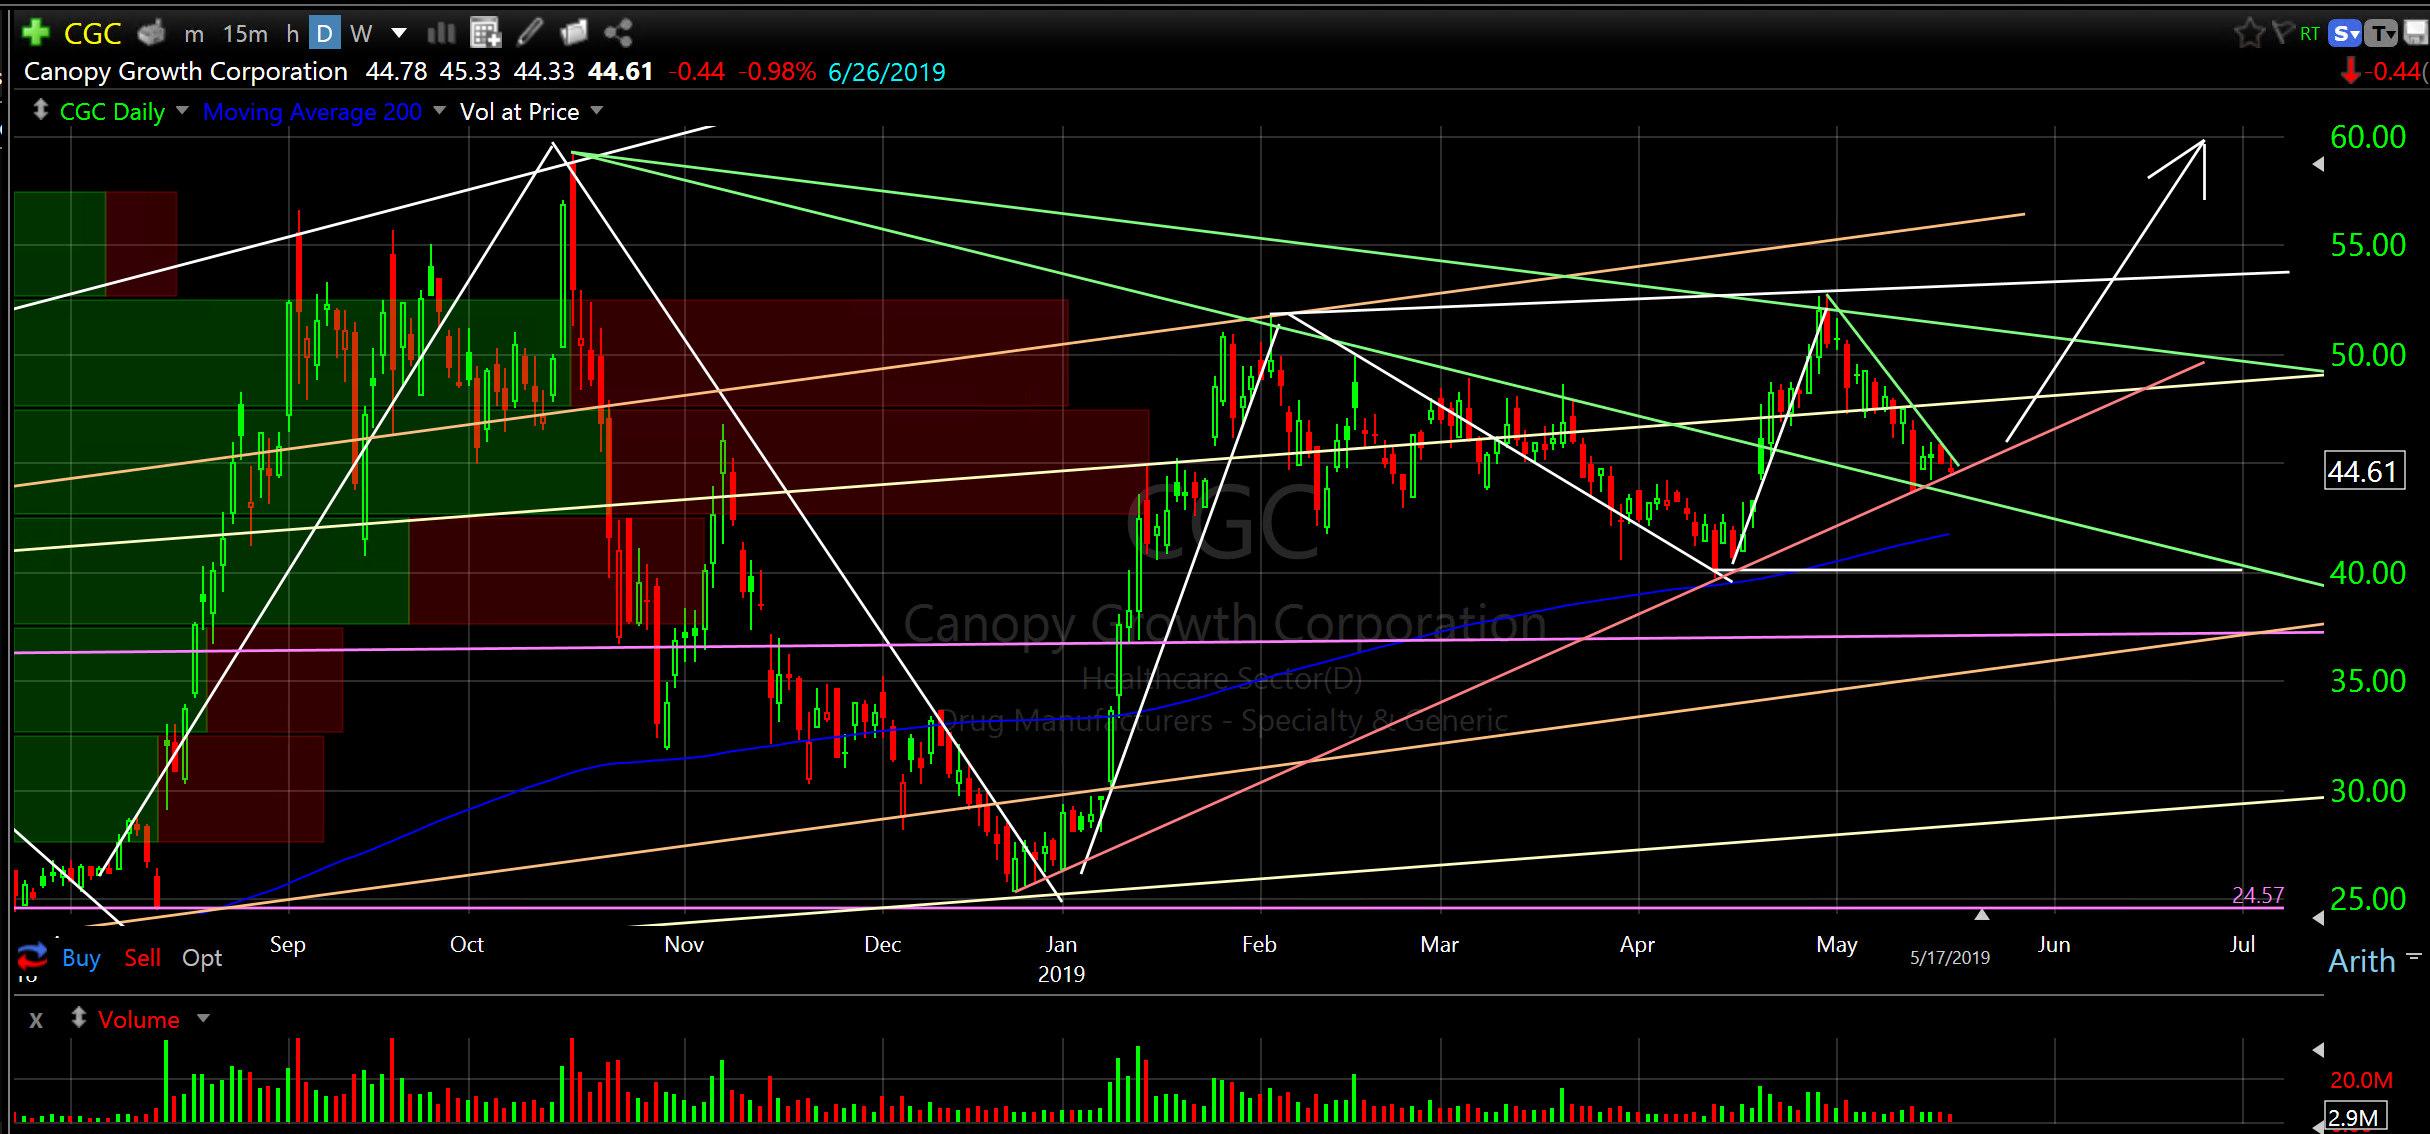
Canopy Growth Corporation (CGC)…Classic rotation from Basic Materials to Weed. Maybe Weed is a Basic Material…joke…sorry… couldn’t resist. But, who knows, you’ve got to own a little cannabis and a little crypto (GBTC) these days. In all seriousness CGC is also speculative. Corrected from 60 to 25 late last year, however, longer term rising support (lows). Price is currently squeezing into the corner of multiple wedges and if it doesn’t break below ascending bottom of wedge (pink line) and if it breaks up and through descending top of wedge (1st then 2nd green lines) it has a chance to expand to new highs. Monday should help tell the tale. If it gets a bid Monday I will send out an alert. Wait for my alert or cross of 1st green line.
I’ve got more but I think it’s smarter to remain pay-tient.
Also, I’m trying to get these out on Sunday so you have more time to plan your Monday.
Have a good week and remember I am more than happy to answer any questions you might have. Really…I love this stuff. I live and breathe it. I can’t get enough. Well, except for now. done
OohRah,
Don