Friday, June 19, 2020
I read this week that 20% of investors sold ALL of their stock holdings during the Corona Crash! OUCH!! Can you imagine? Now they have 20%-30% less money than they had, they missed the recovery and they are unlikely to re-enter any time soon and when they do it will probably be right before the next big correction. Unfortunately, that’s just the way the market works to fool people.
I didn’t sell one share during any of it. I did trim a very tiny bit of underperforming ETF’s last week but otherwise my portfolio looks the same as it did in February before the Corona Crash except for a few additions along the way. I don’t think I ever even suggested selling anything during the whole fiasco. I was as concerned as the next guy but I am 100% positive that my experiences of living through previous crashes and my understanding of how the market works saved my arse and helped me understand how to identify the reversal bottom.
This is the reason I write; to share what works for me and share what I have learned over my 35 years of research and experience. Hopefully, it helps you as well.
Broader Market Review
The Nasdaq closed the week slightly higher making a new weekly closing high but failed to close above the daily high made the previous week. So, the bad news is it didn’t take out the high from the prior week but it did make another all time weekly close high which is encouraging. I would, however, remain cautious at current levels as most technology stocks are at resistance and highly vulnerable to a short term reversal lower.
The Dow closed slightly lower on the week and the S&P 500 closed slightly higher. They are both rolling over, stuck under Major Resistance and have broken high trajectory (unsustainable long term) support from the Corona Crash bottom. If the Nasdaq pulls back expect these indexes to pull back as well.
So, short term, the broader market is still vulnerable and I would remain cautious. Intermediate term my outlook is pretty neutral and I would look for sideways chop into the election with a possible deeper reset sometime in August. Beyond the election I will be looking for a Trump surge/expansion or a Biden collapse/contraction.
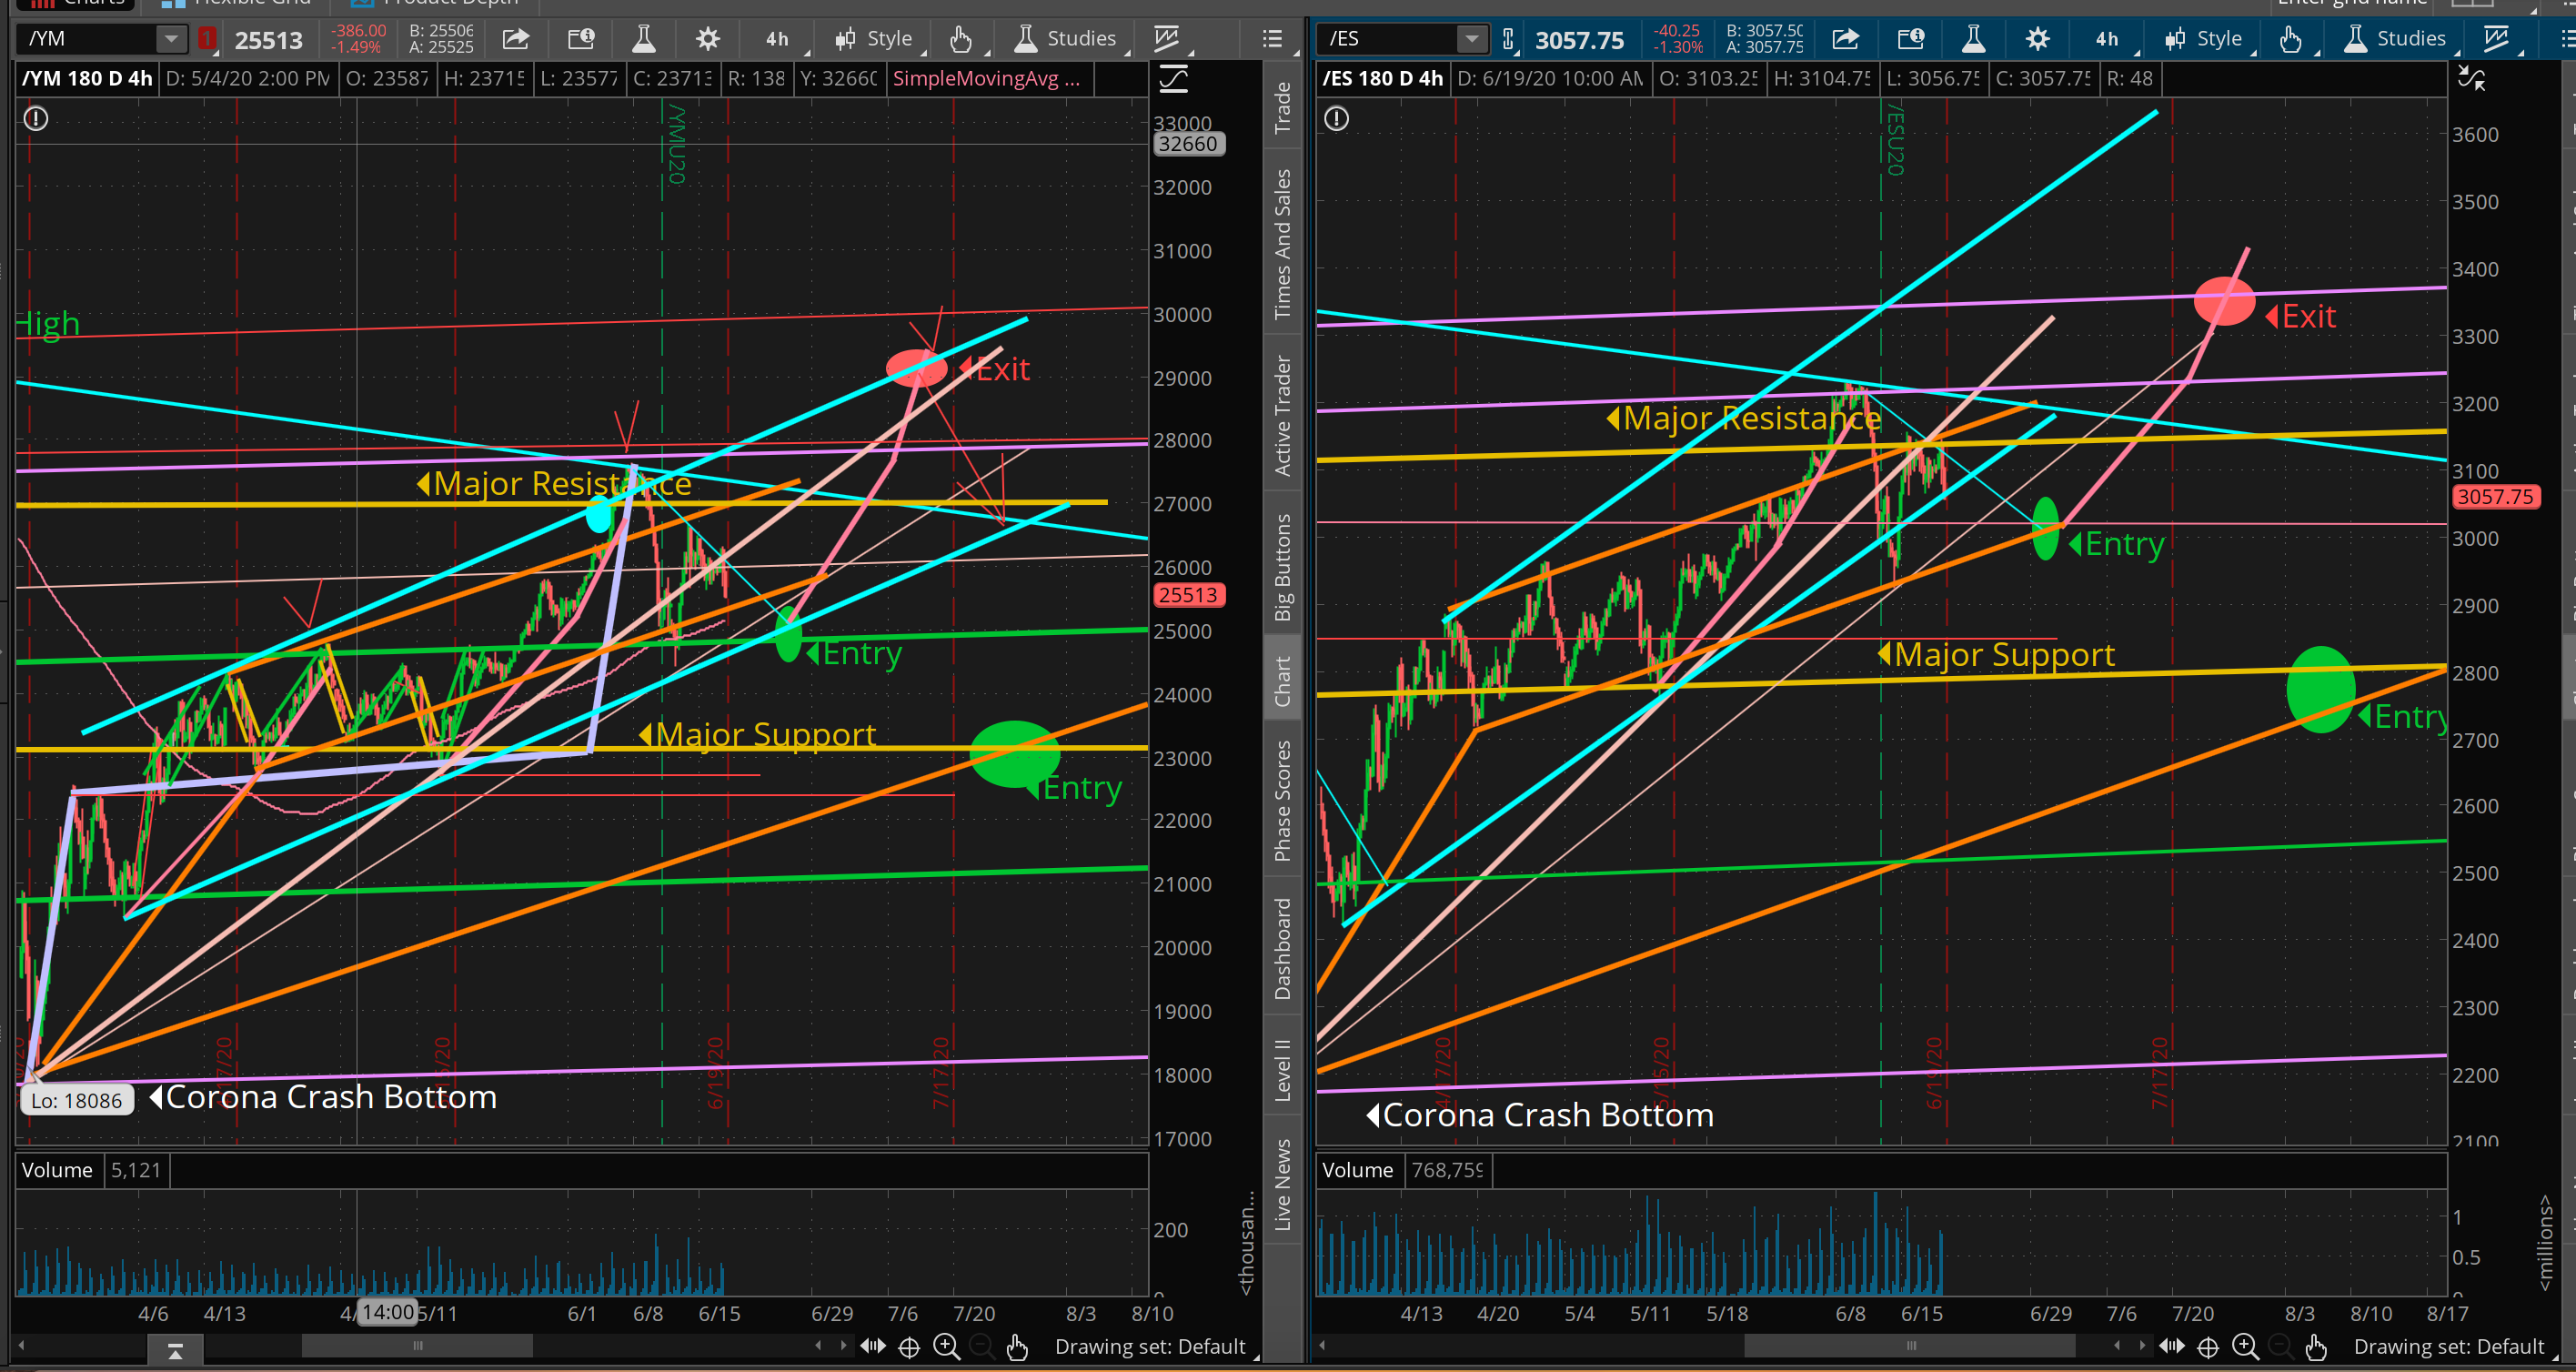
My actionable near term forecast is to treat lower support levels as buying opportunities. In the charts below of Nasdaq, the Dow and S&P 500 I have identified current projected low risk Entry Zones with green circles. Remember, the lower the entry the lower the risk. Currently, the most probable next reversal higher is the entry zone highlighted by the green circle at Dow 25,500 occurring near the end of June and a reversal higher there should ramp to near Dow 29,000 where another reversal lower is currently measured to occur.
See Dow, S&P 500 and Nasdaq charts below for Entry/Exit positioning and alignment forecasts.
Dow futures (/YM) and S&P 500 futures (/ES) Entry Zones
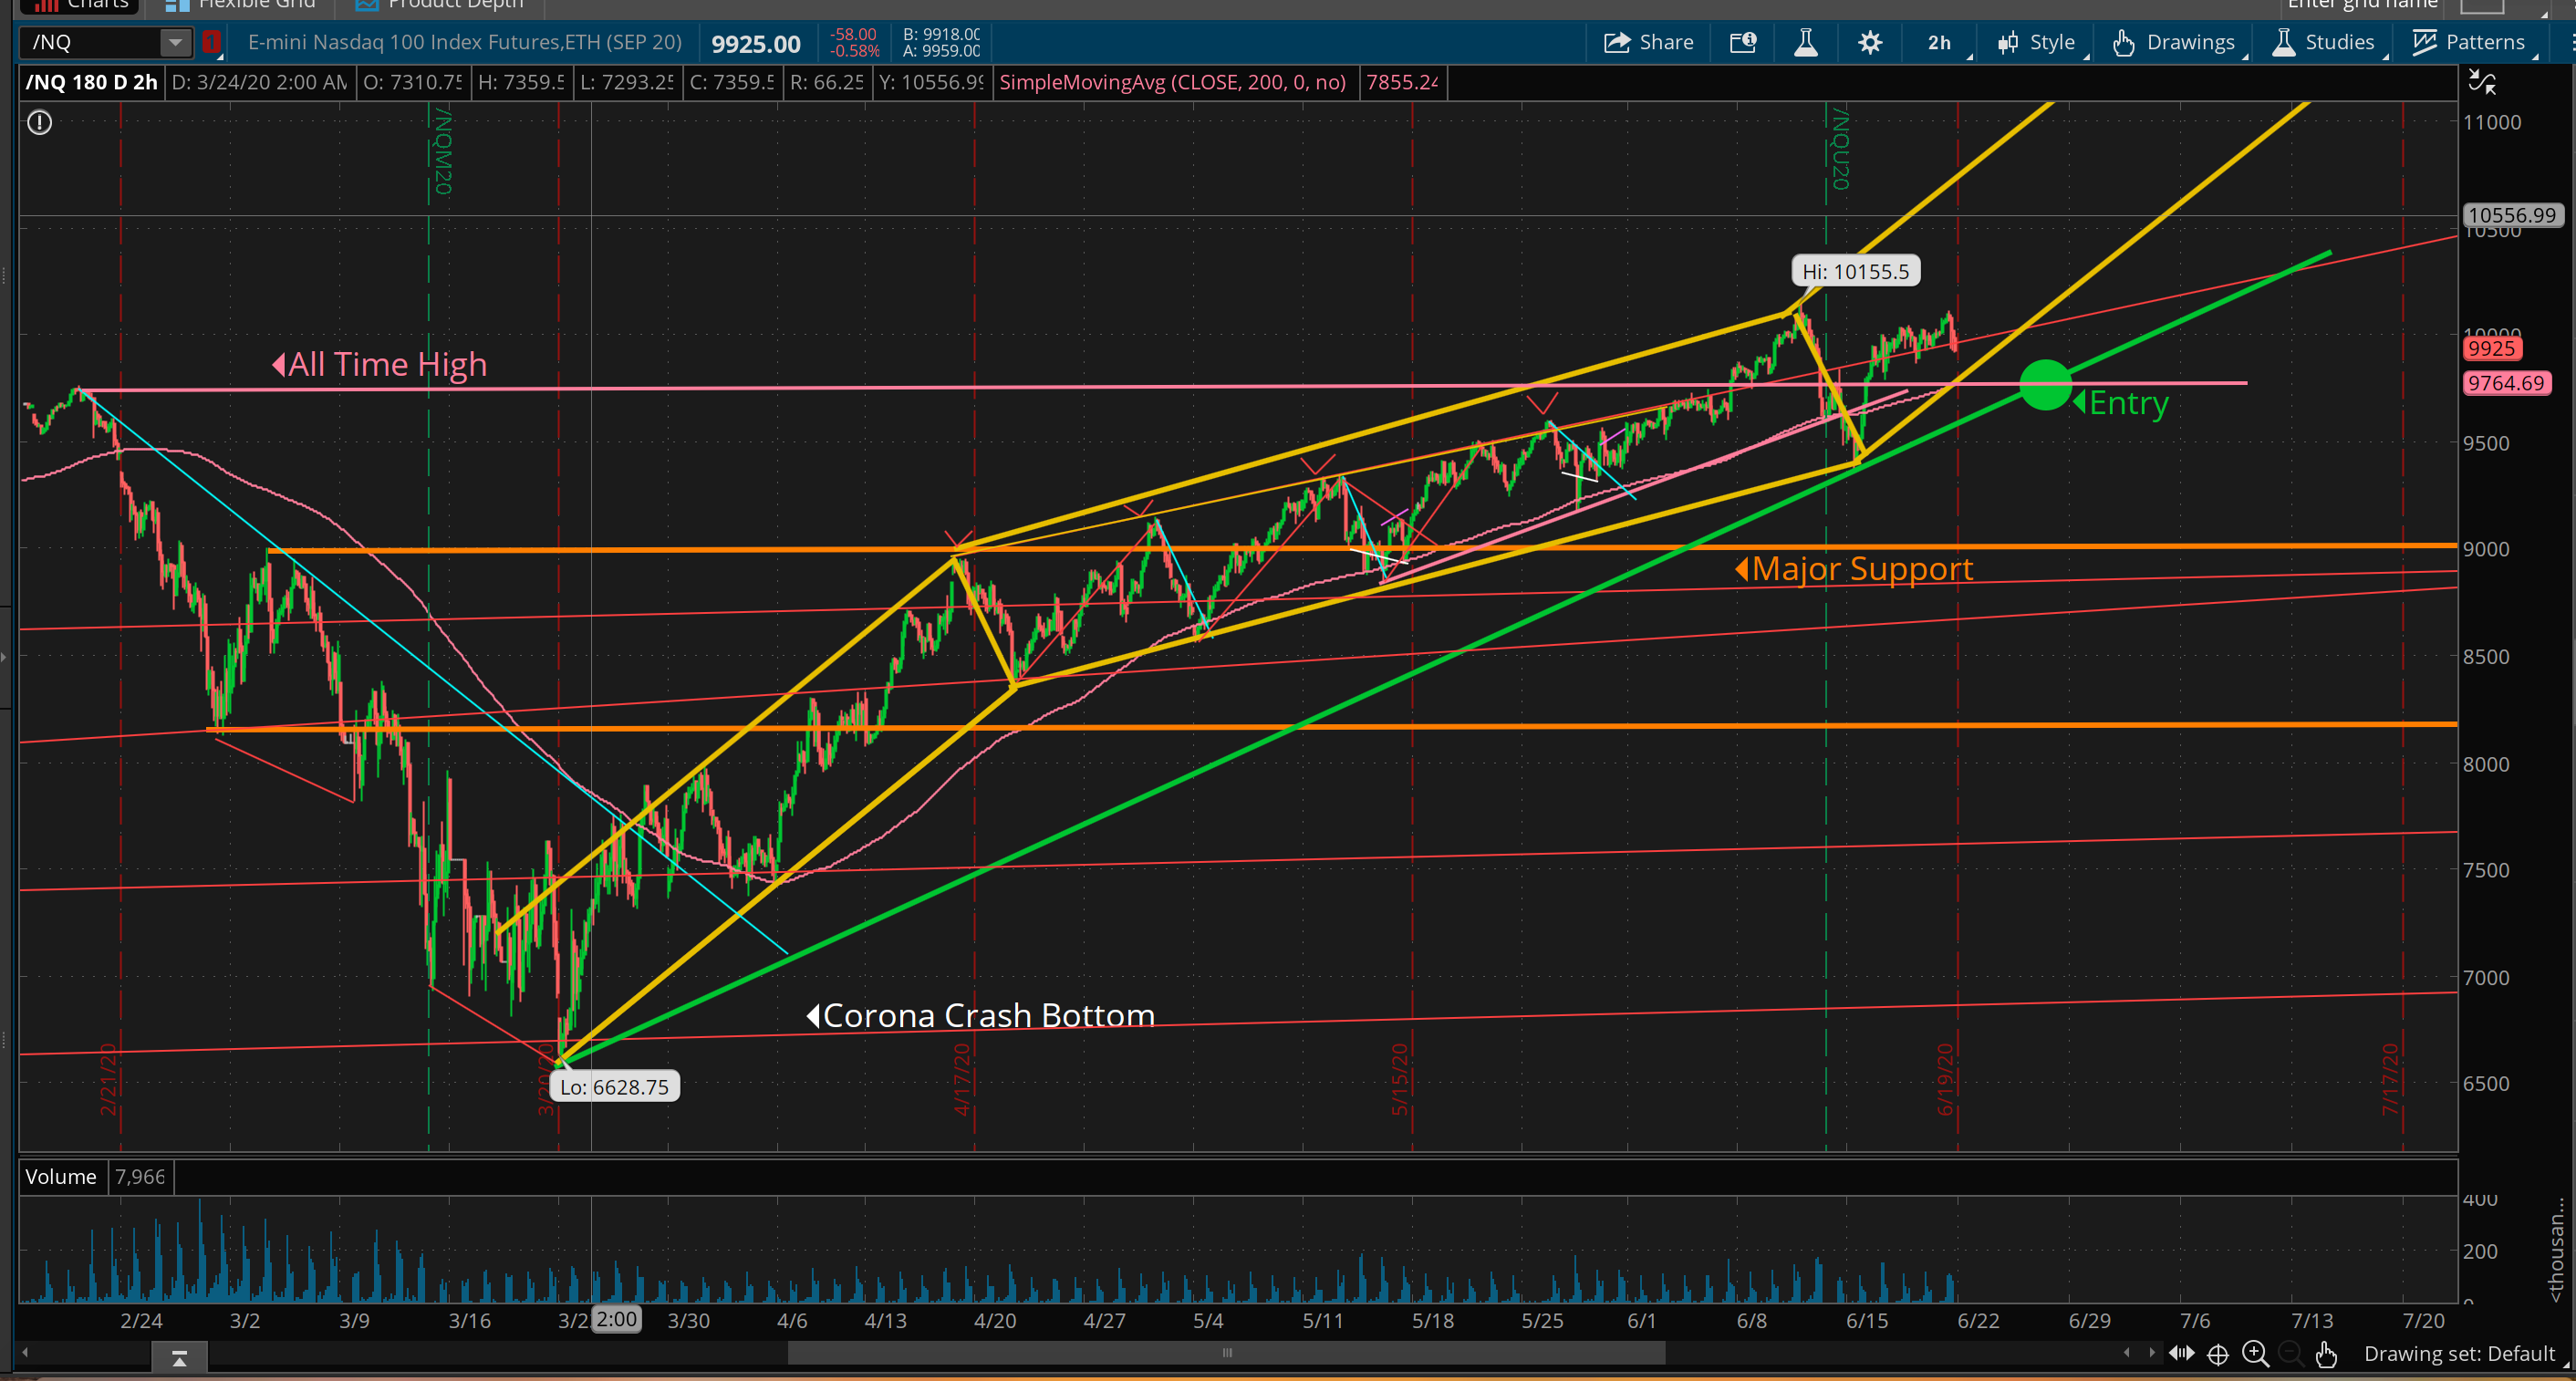
Nasdaq (/NQ) short term entry
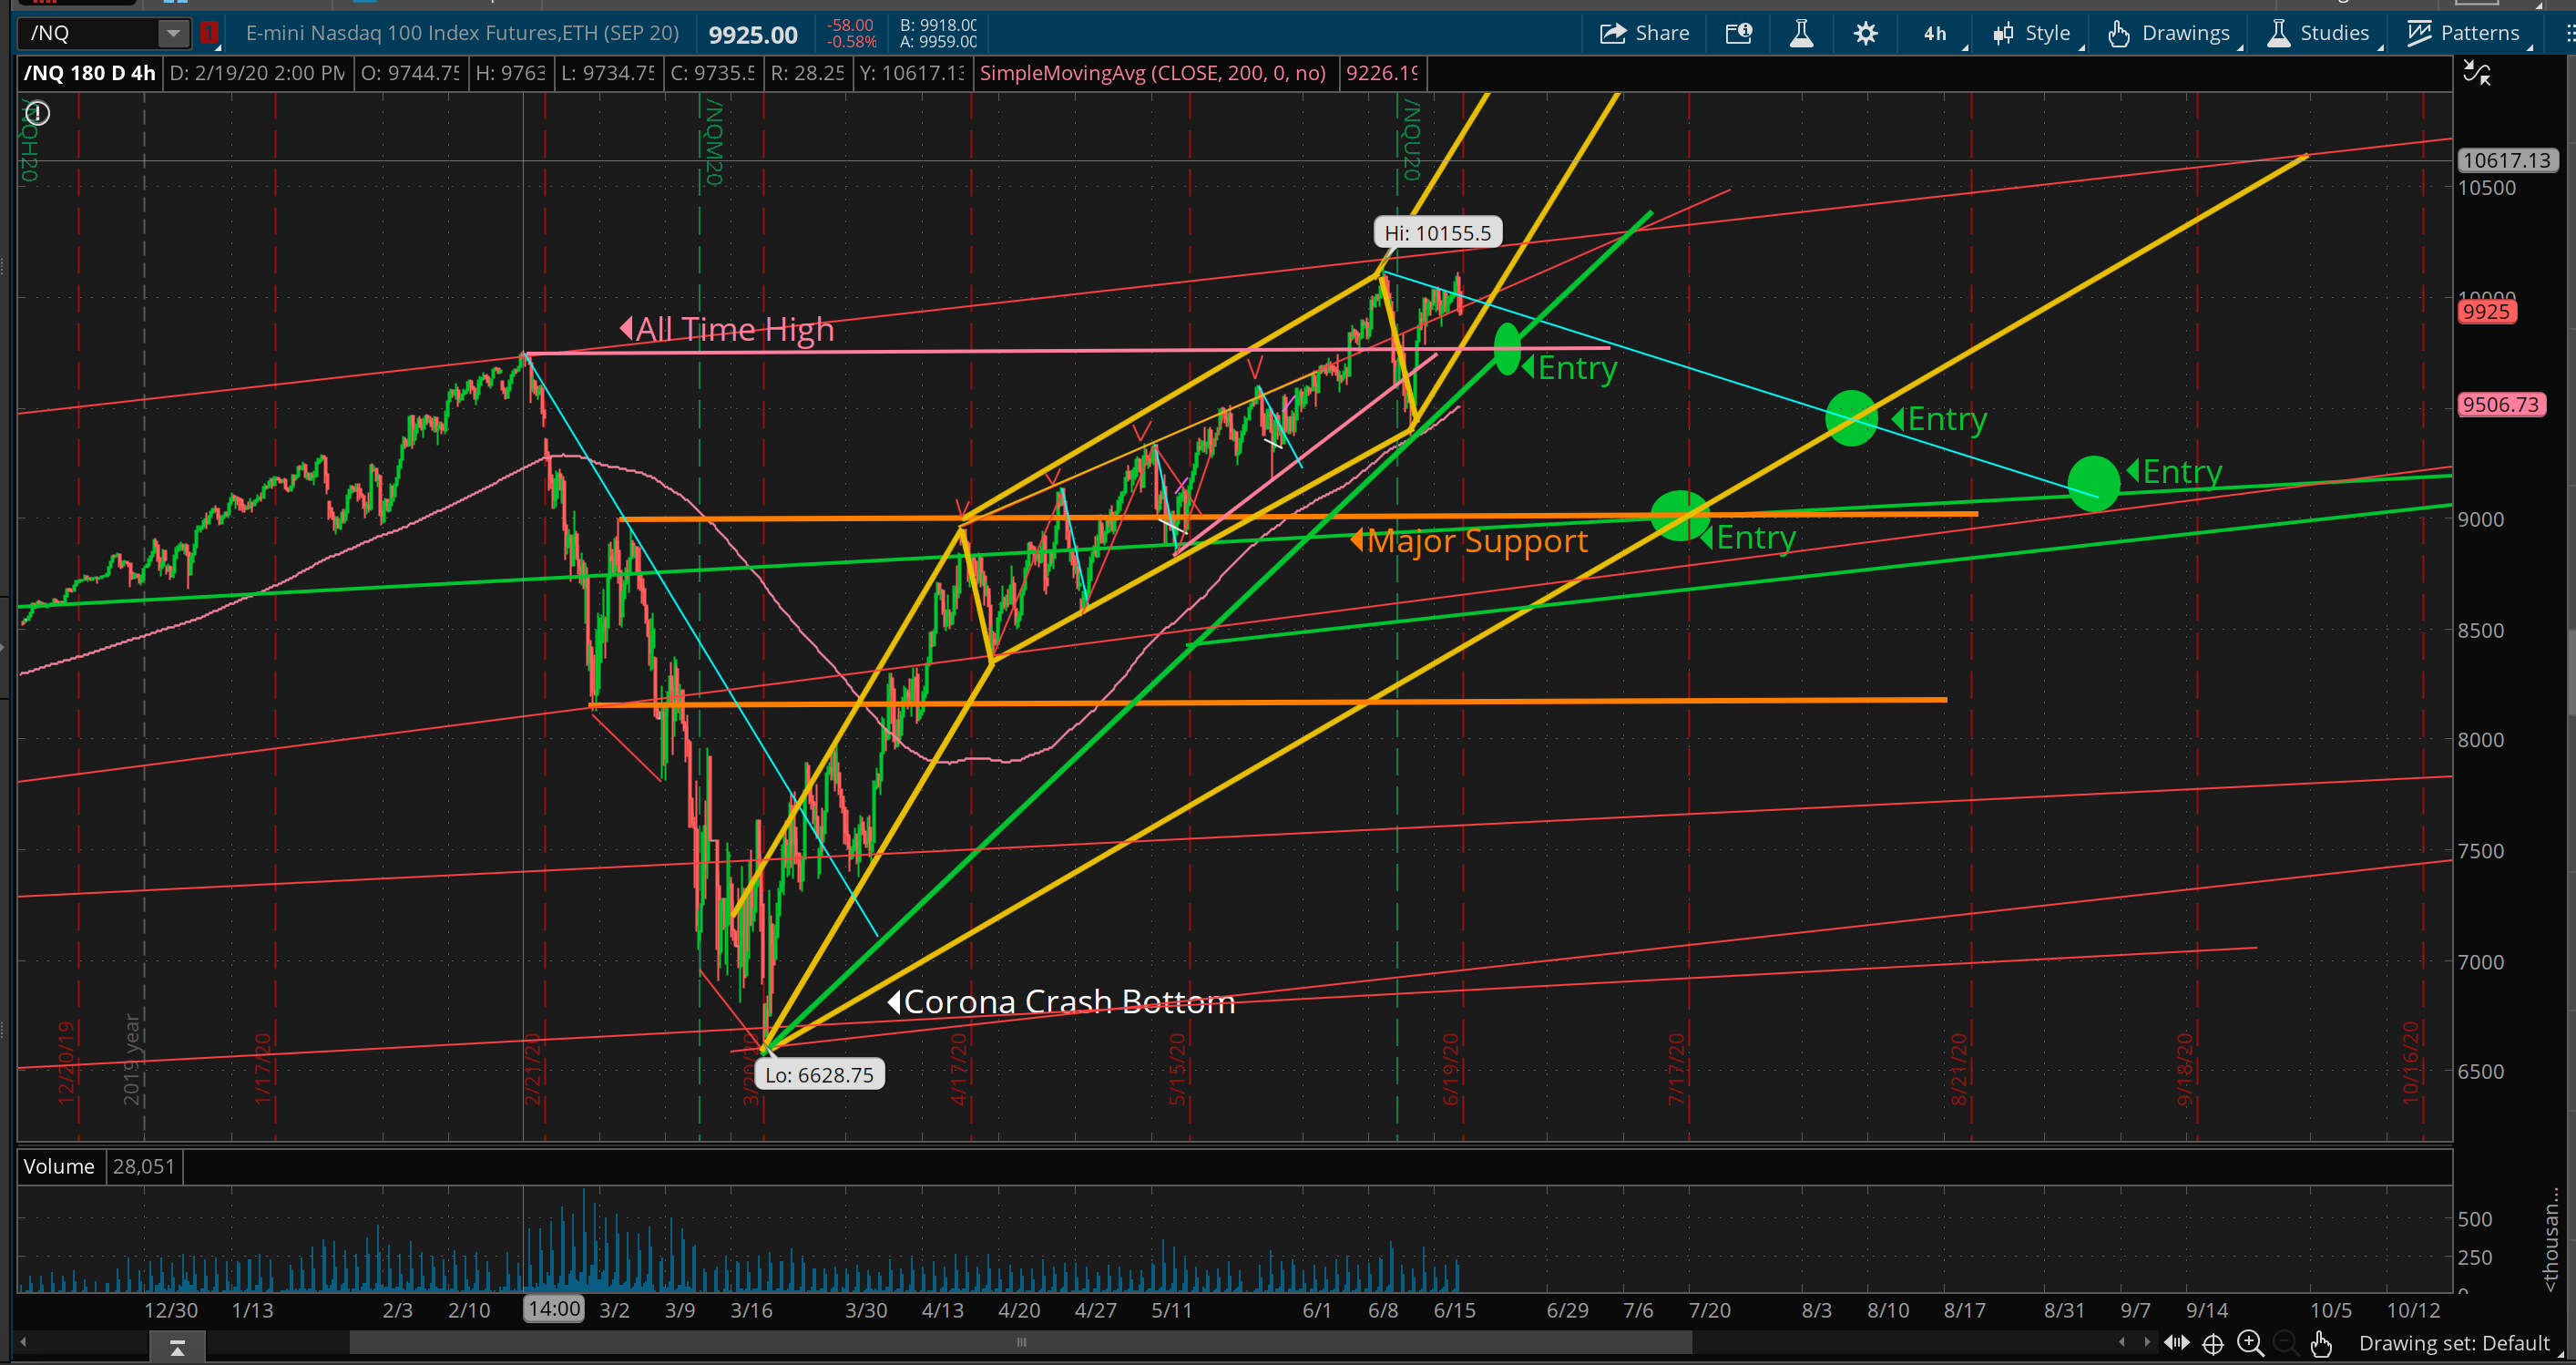
Nasdaq (/NQ) multiple entry zones
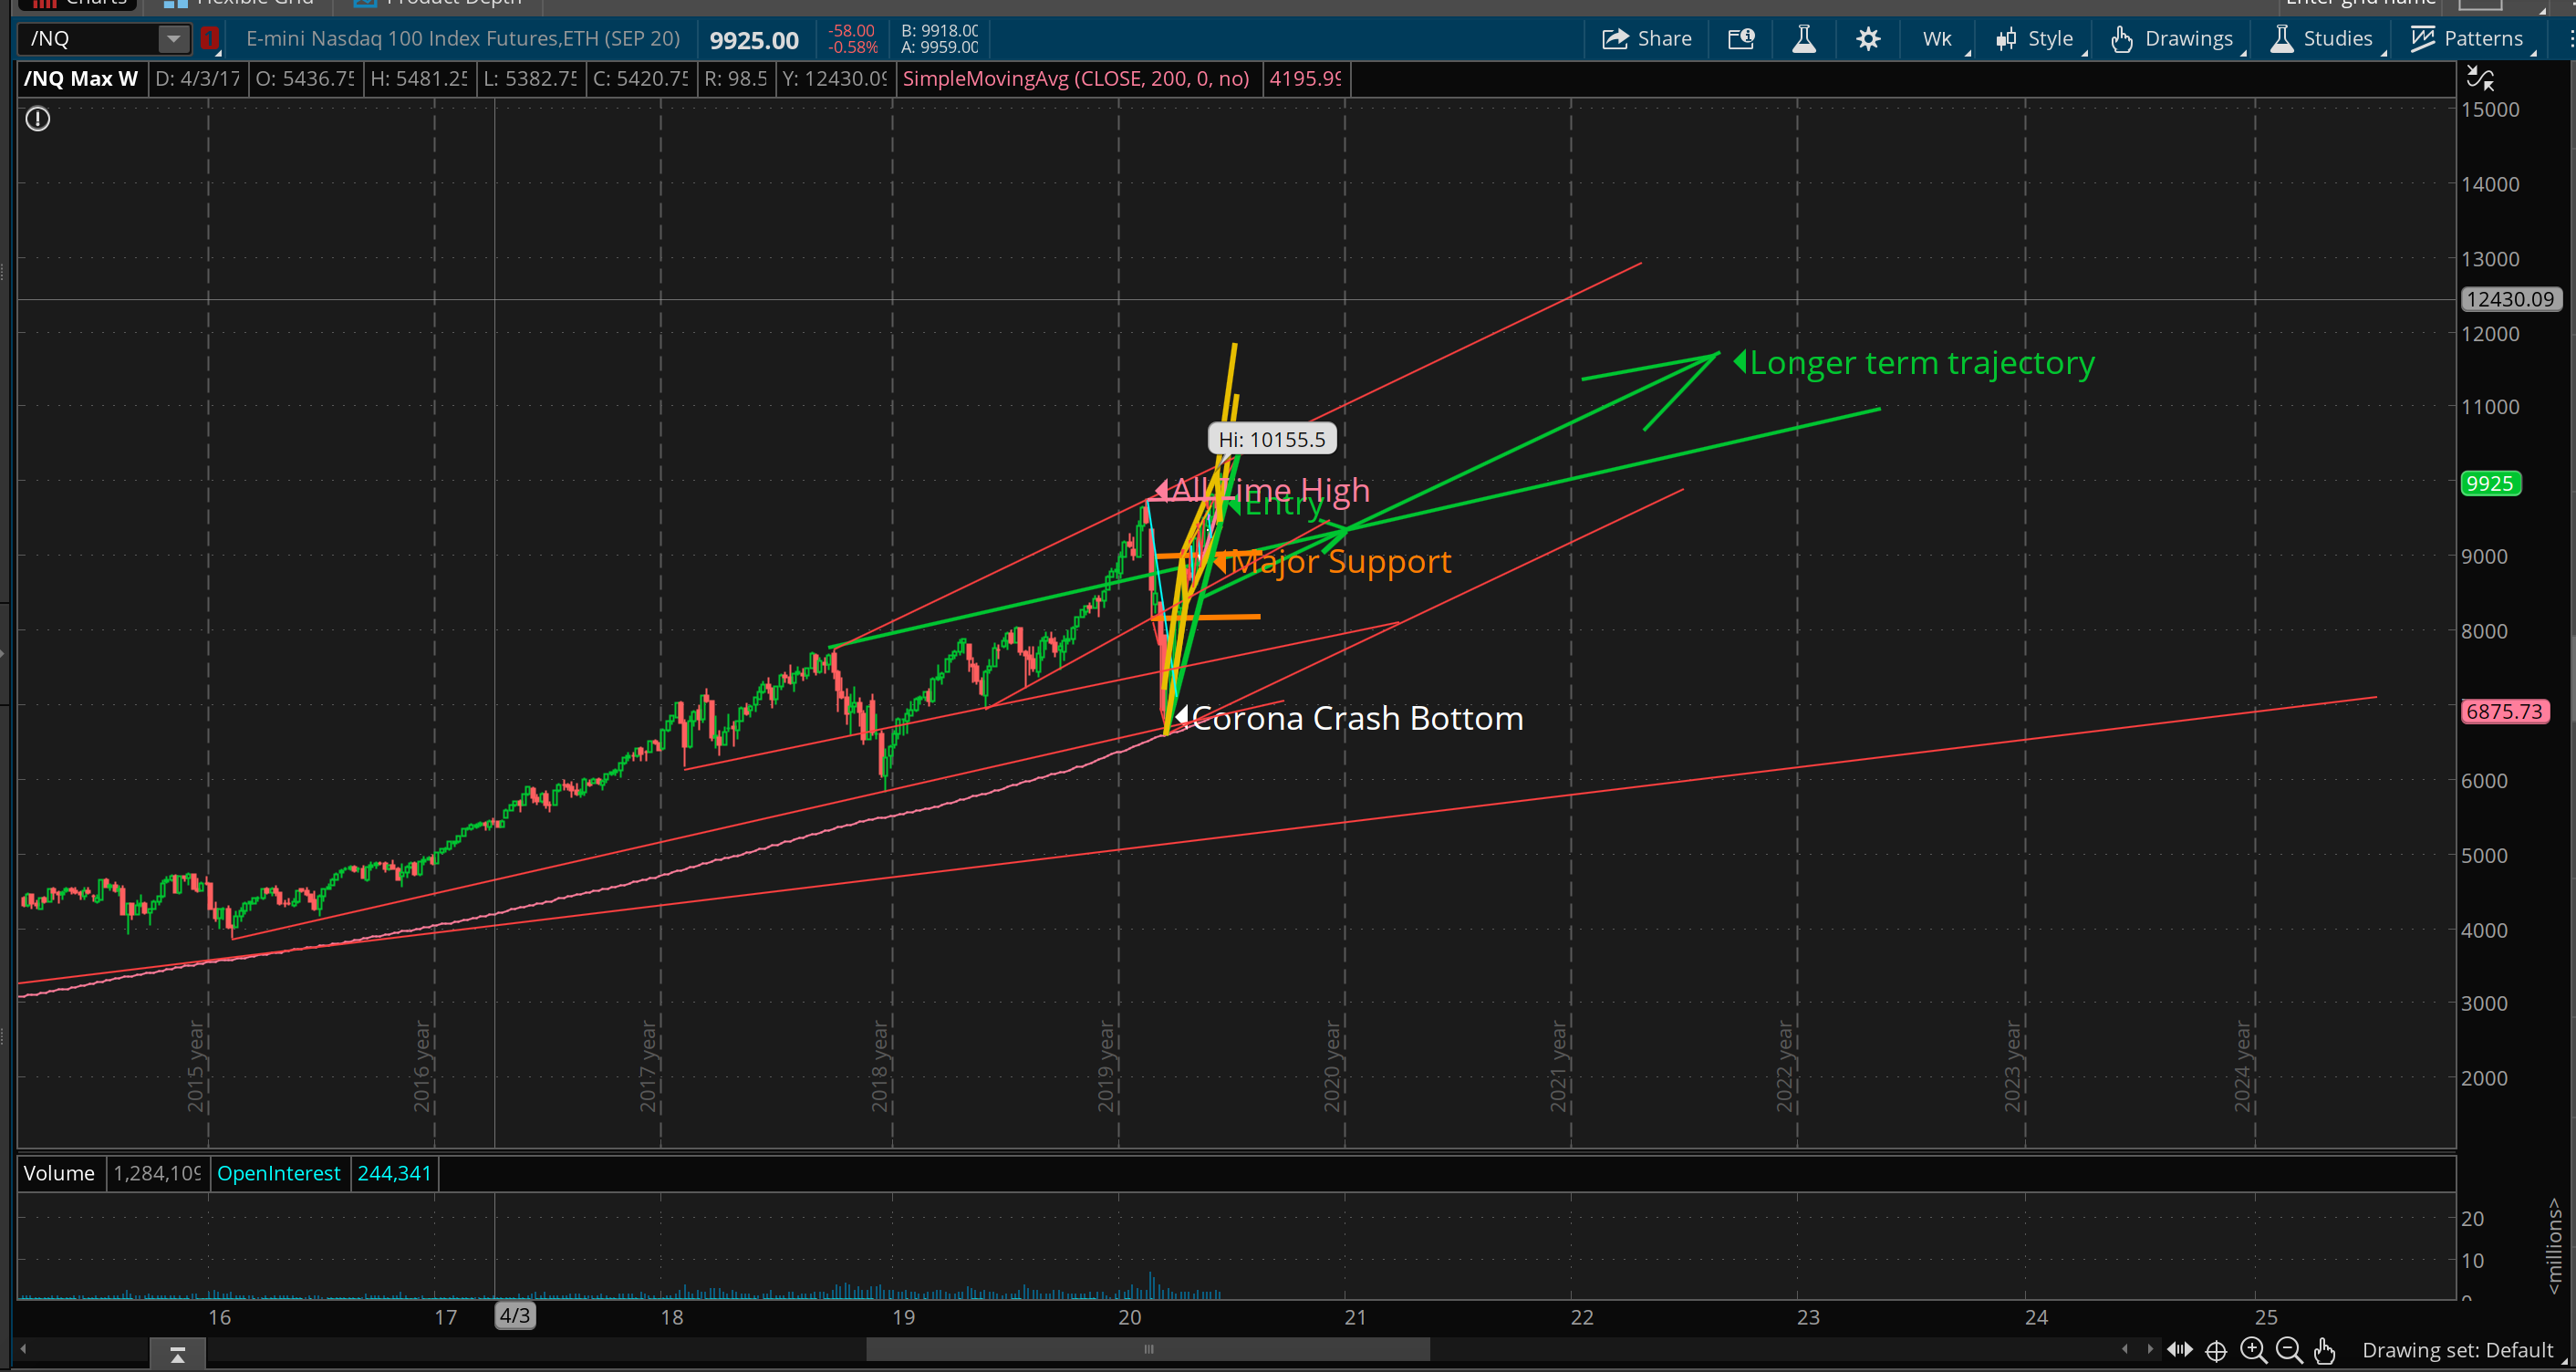
Nasdaq (/NQ) longer term price trajectory
My Favorite ETF’s and Individual Stocks
Last week I wrote about the importance of positioning and alignment..
“To increase our probability of buying individual stocks or ETF’s low and selling them high we want to identify those individual stocks or ETF’s that are also positioned at their unique support or resistance levels and align with not only the broader market but with their sectors and sub sector levels as well.”
Over the summer I will be highlighting those ETF’s and individual stocks that align well with the broader market support reversal zones I expect to get hit over the coming weeks and months. These will be low risk/high reward Entries for large cap companies that are at the top of the quality spectrum.
If you are not a premium member or charting client and would like to receive these alerts and the best stock picking research and forecasting on the planet just send me an email and I will get you set up.
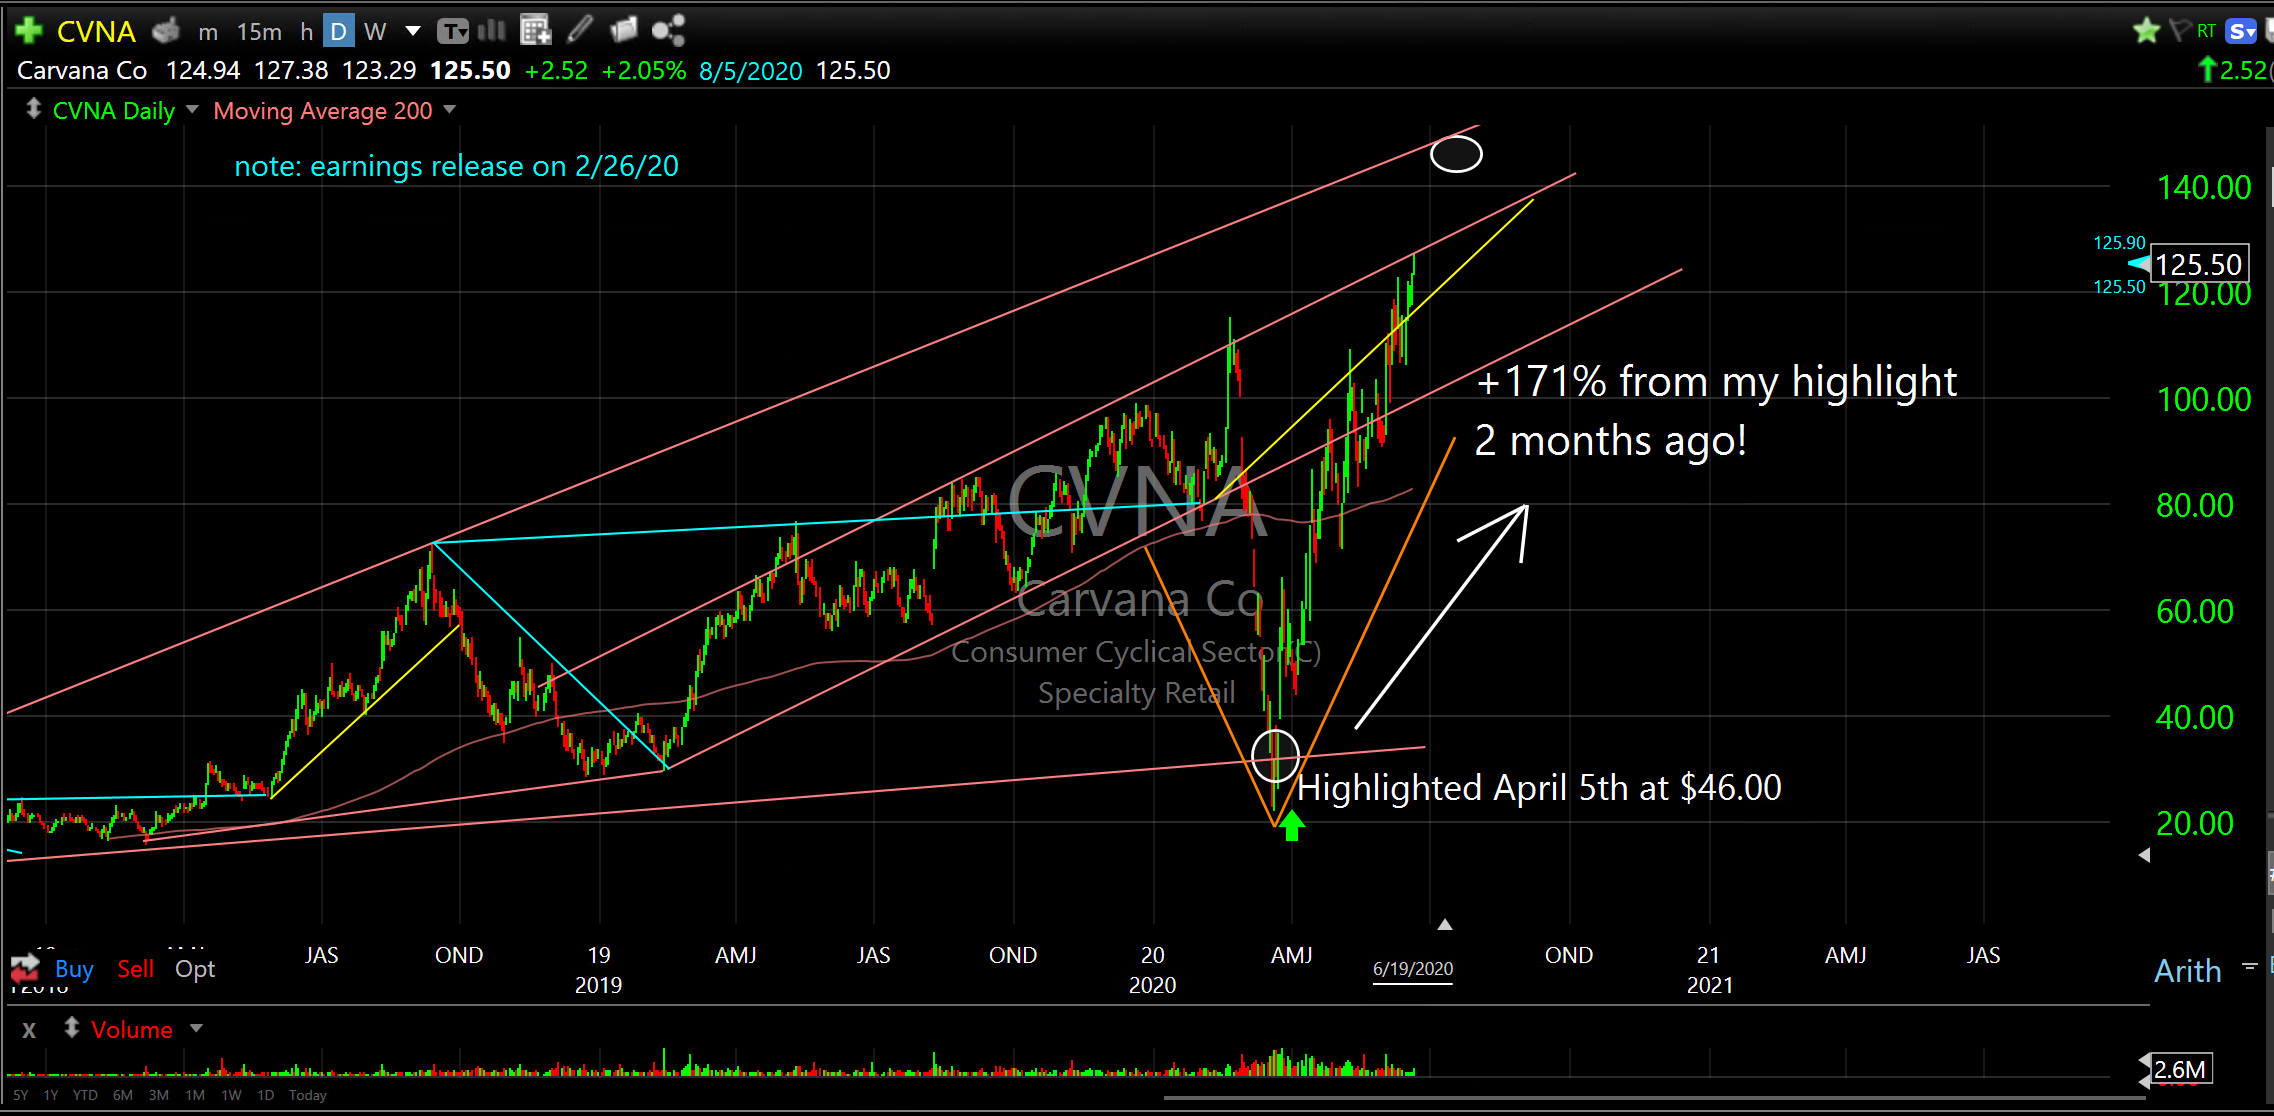
Did you buy Carvana Co (CVNA) when I alerted it 2 1/2 months ago on April 5th? It’s up 171% since then.
Carvana Co (CVNA)
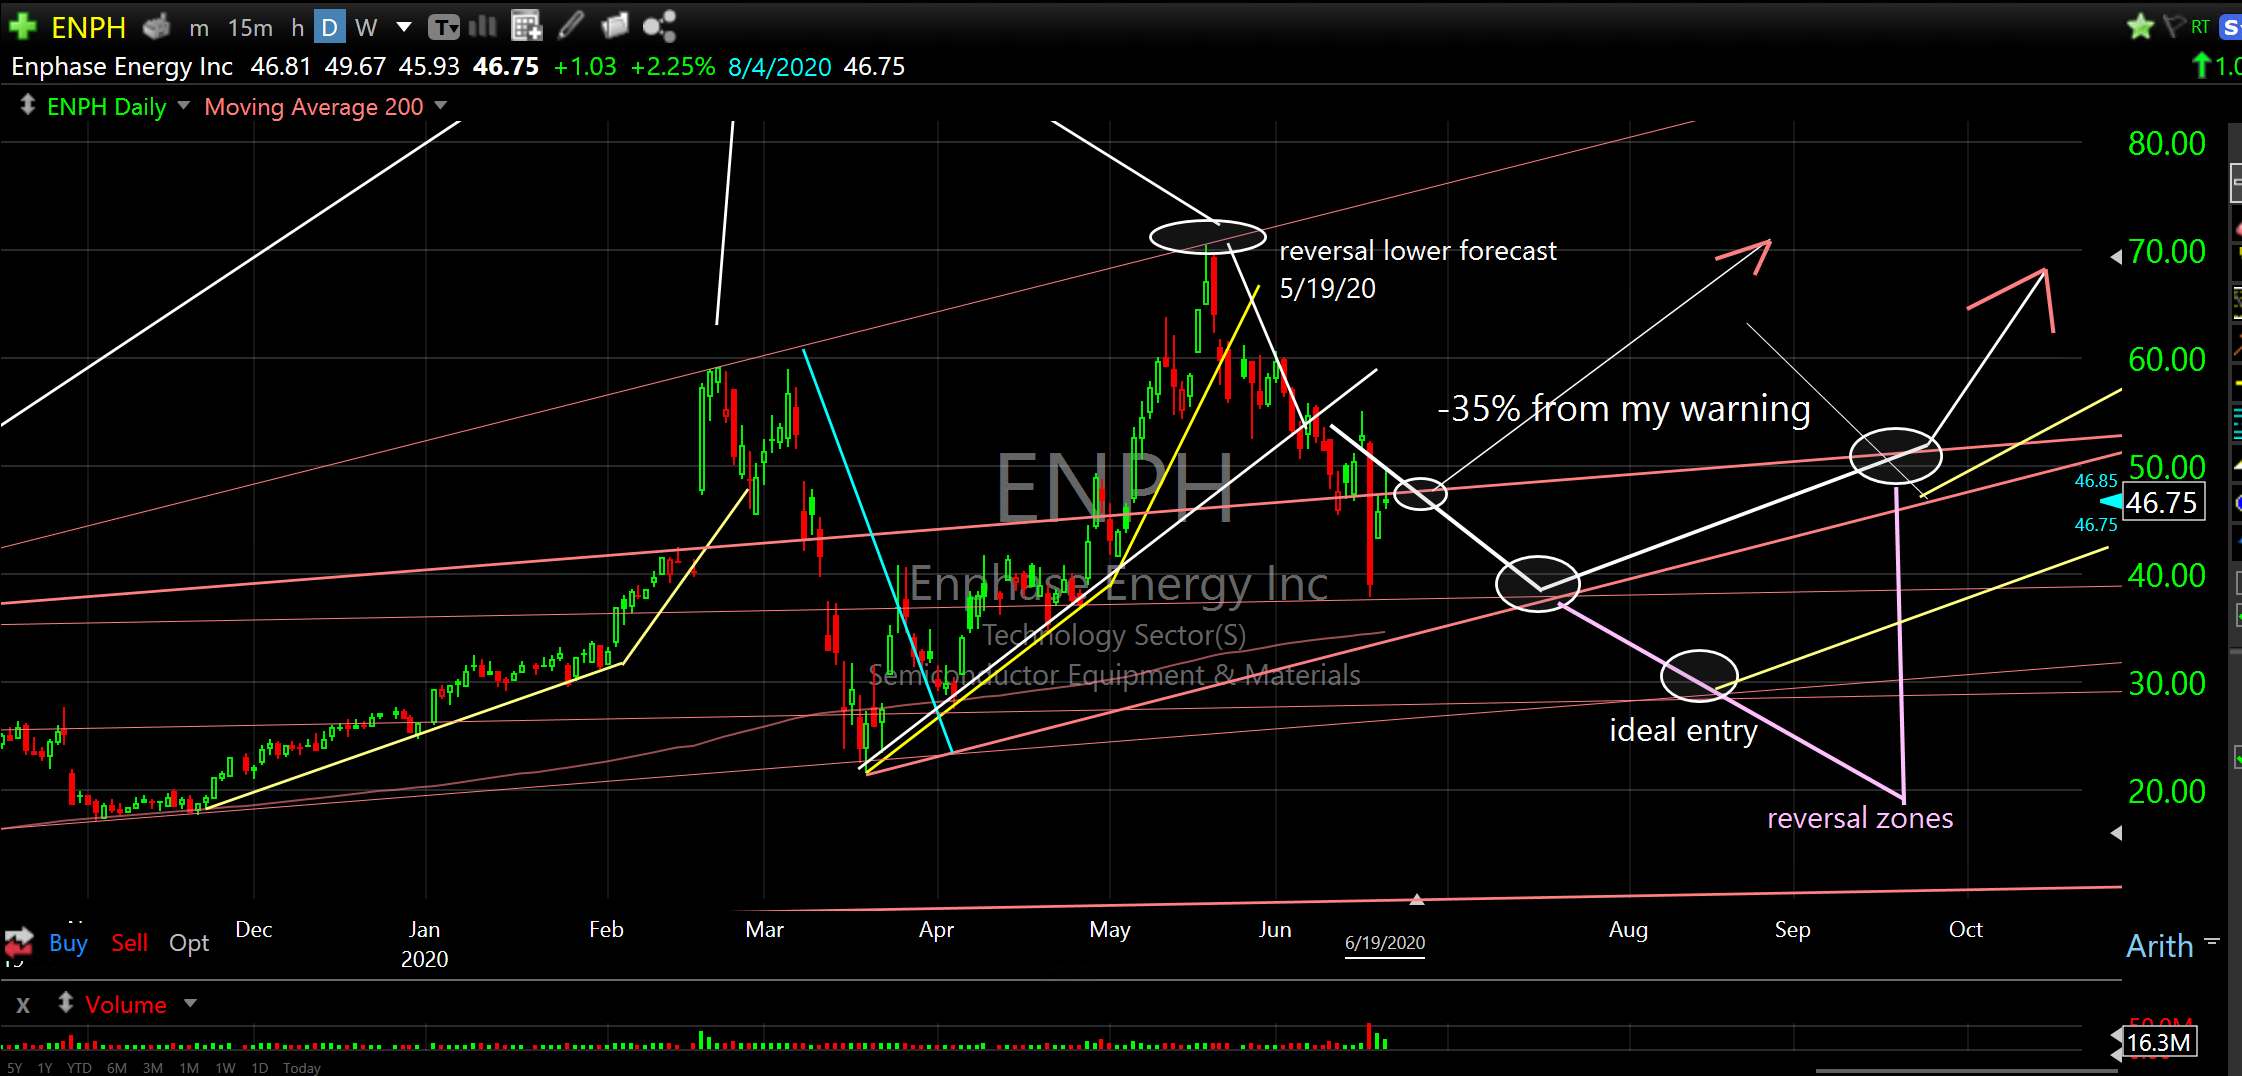
Check out the forecast I provided in May when a charting client was interested in buying Enphase Energy Inc (ENPH). On May 19th, the exact day it hit its $70.36 high, I forecasted it to reverse lower. It has followed my forecast perfectly and is now down over 35% from my warning.
Enphase Energy Inc (ENPH)
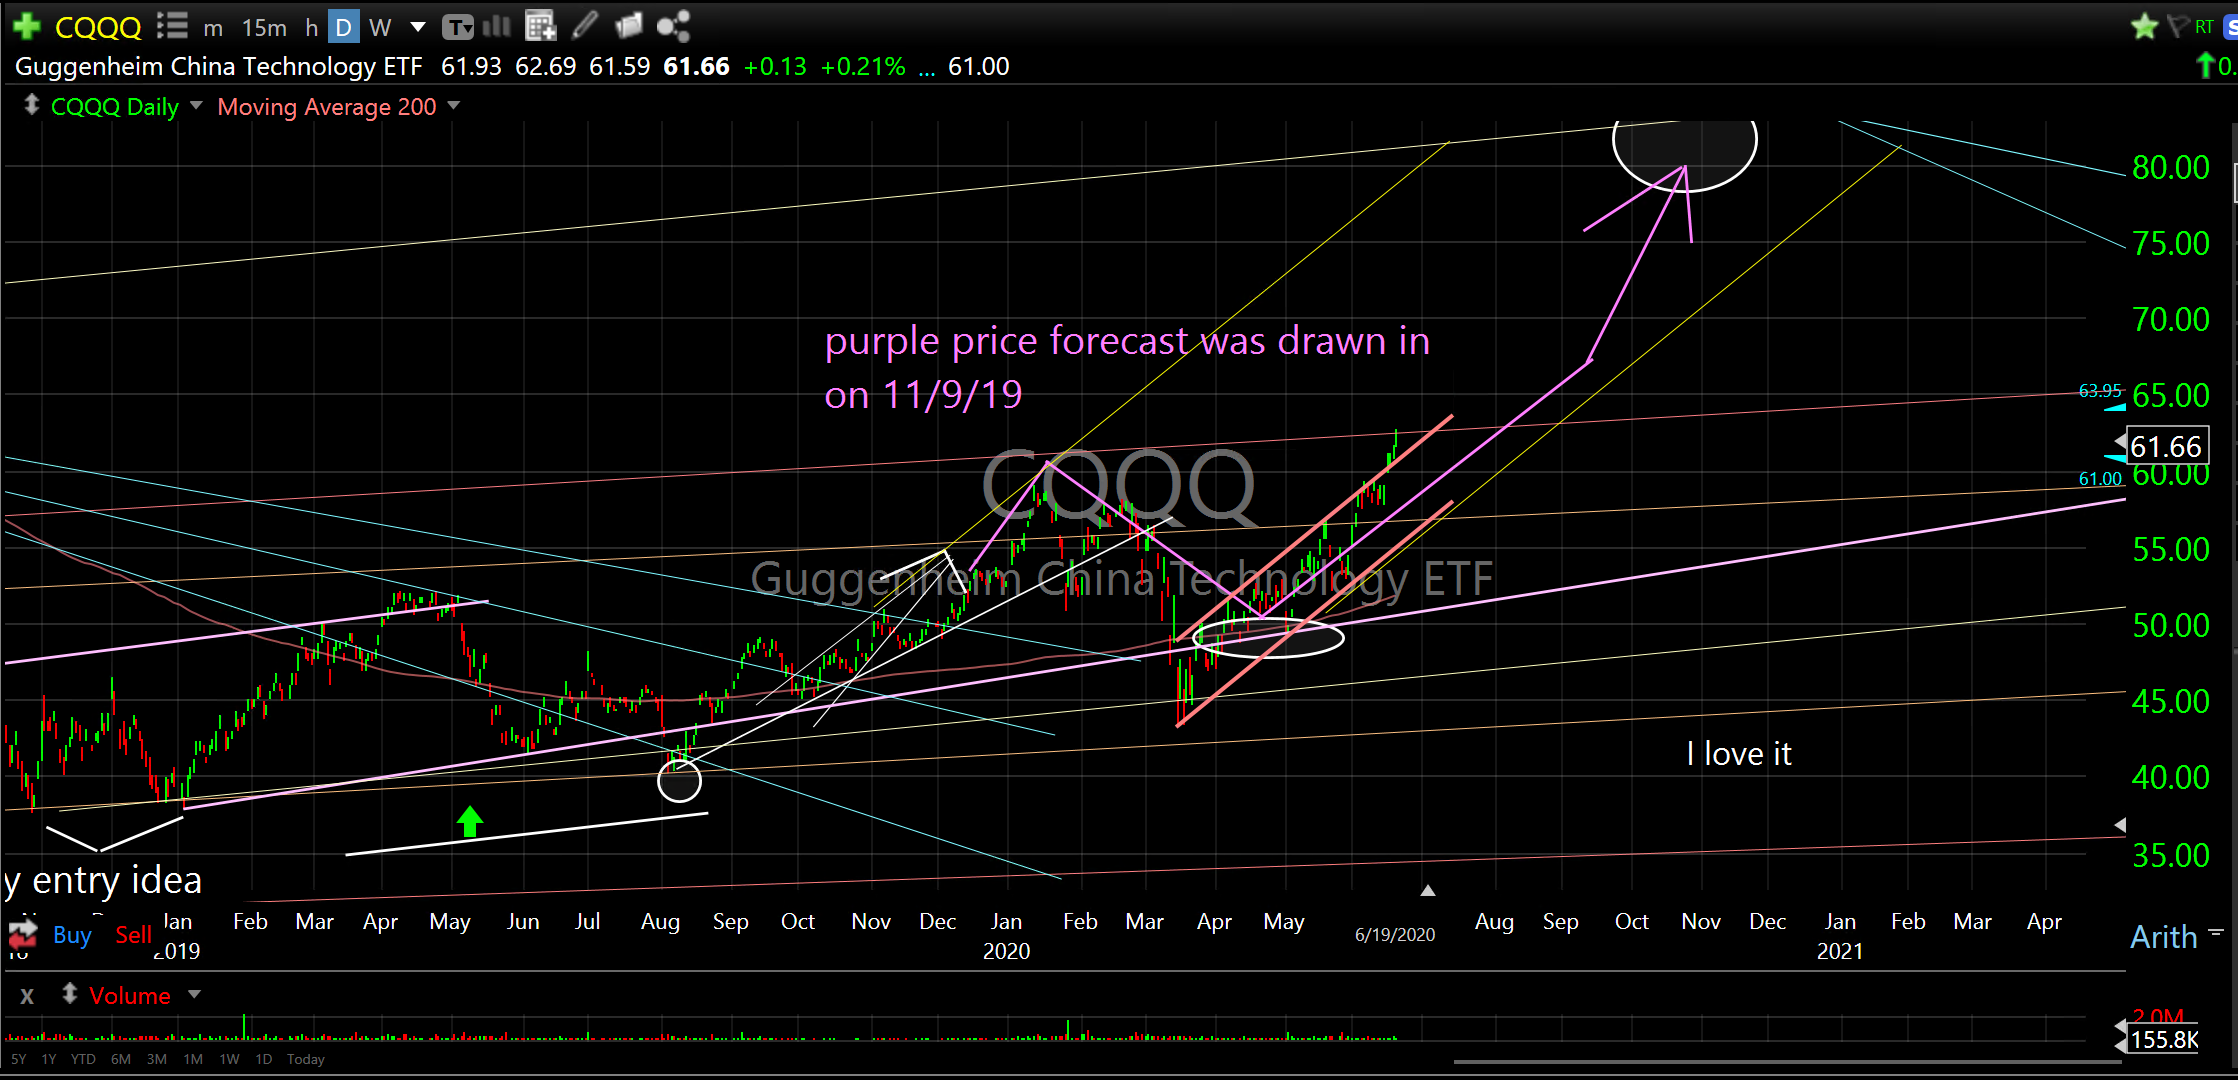
Look at the accuracy of the forecast for the Guggenheim China Technology ETF (CQQQ). I drew in the purple price forecast months before it occurred! You can’t do this with fundamental research. Sometimes it’s like printing money.
Guggenheim China Technology ETF (CQQQ)
If you are interested in knowing what good entries and exits look like you’ve come to the right place and if you are not a current premium member or charting client just email me and I will get you set up to learn how to solve for buying low and selling high.
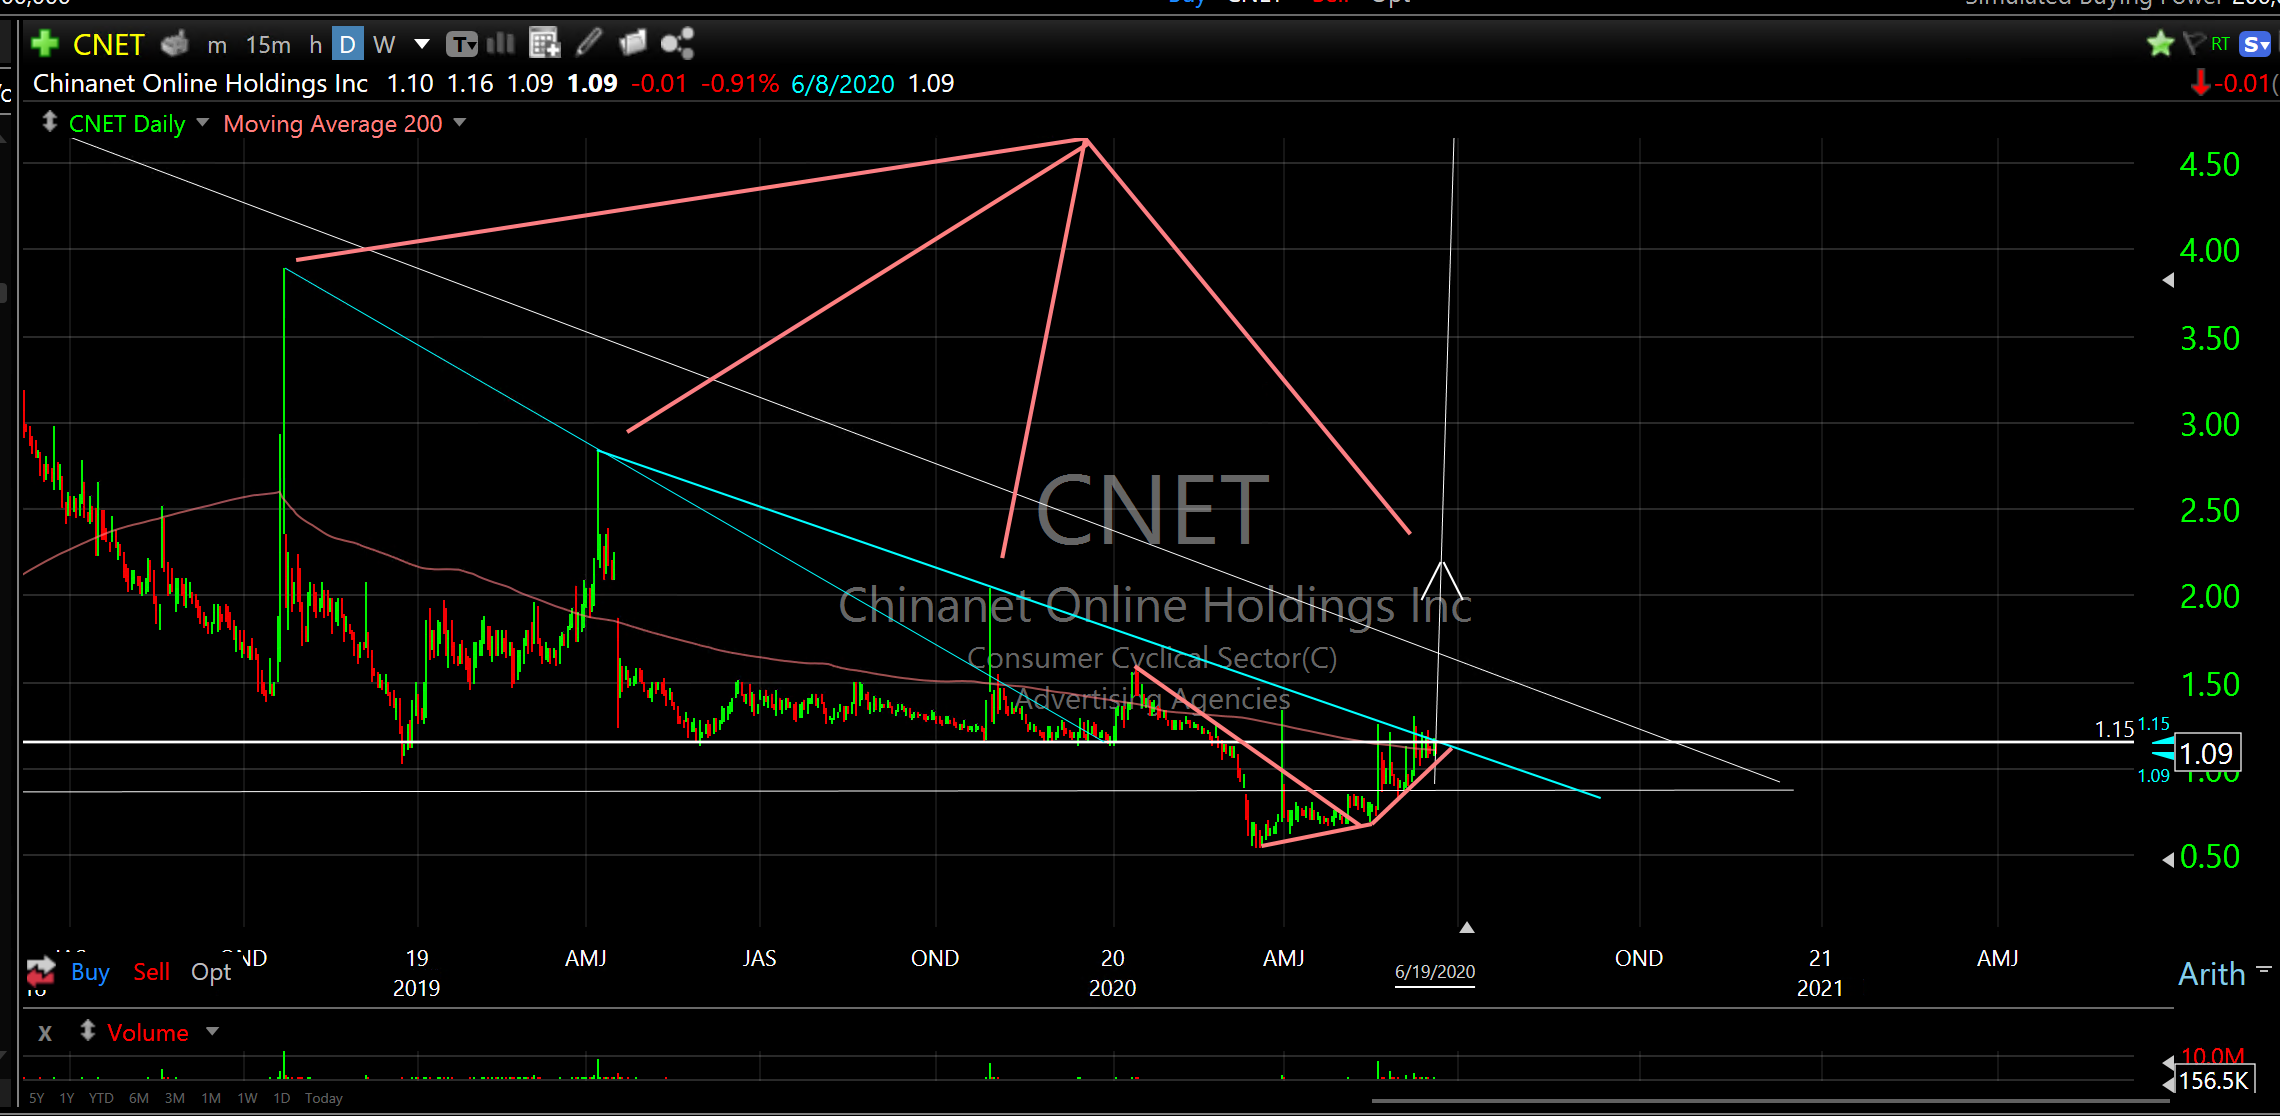
And finally, a little fun. Every now and then I like to look for more speculative plays. Chinanet Online Holdings Inc (CNET) has a history of huge spikes that happen very quickly followed by a collapse. It sure looks like another one might be coming. I’m not suggesting buying it but let’s watch it together (I do own a little) for a little fun.
Chinanet Online Holdings Inc (CNET) weekly
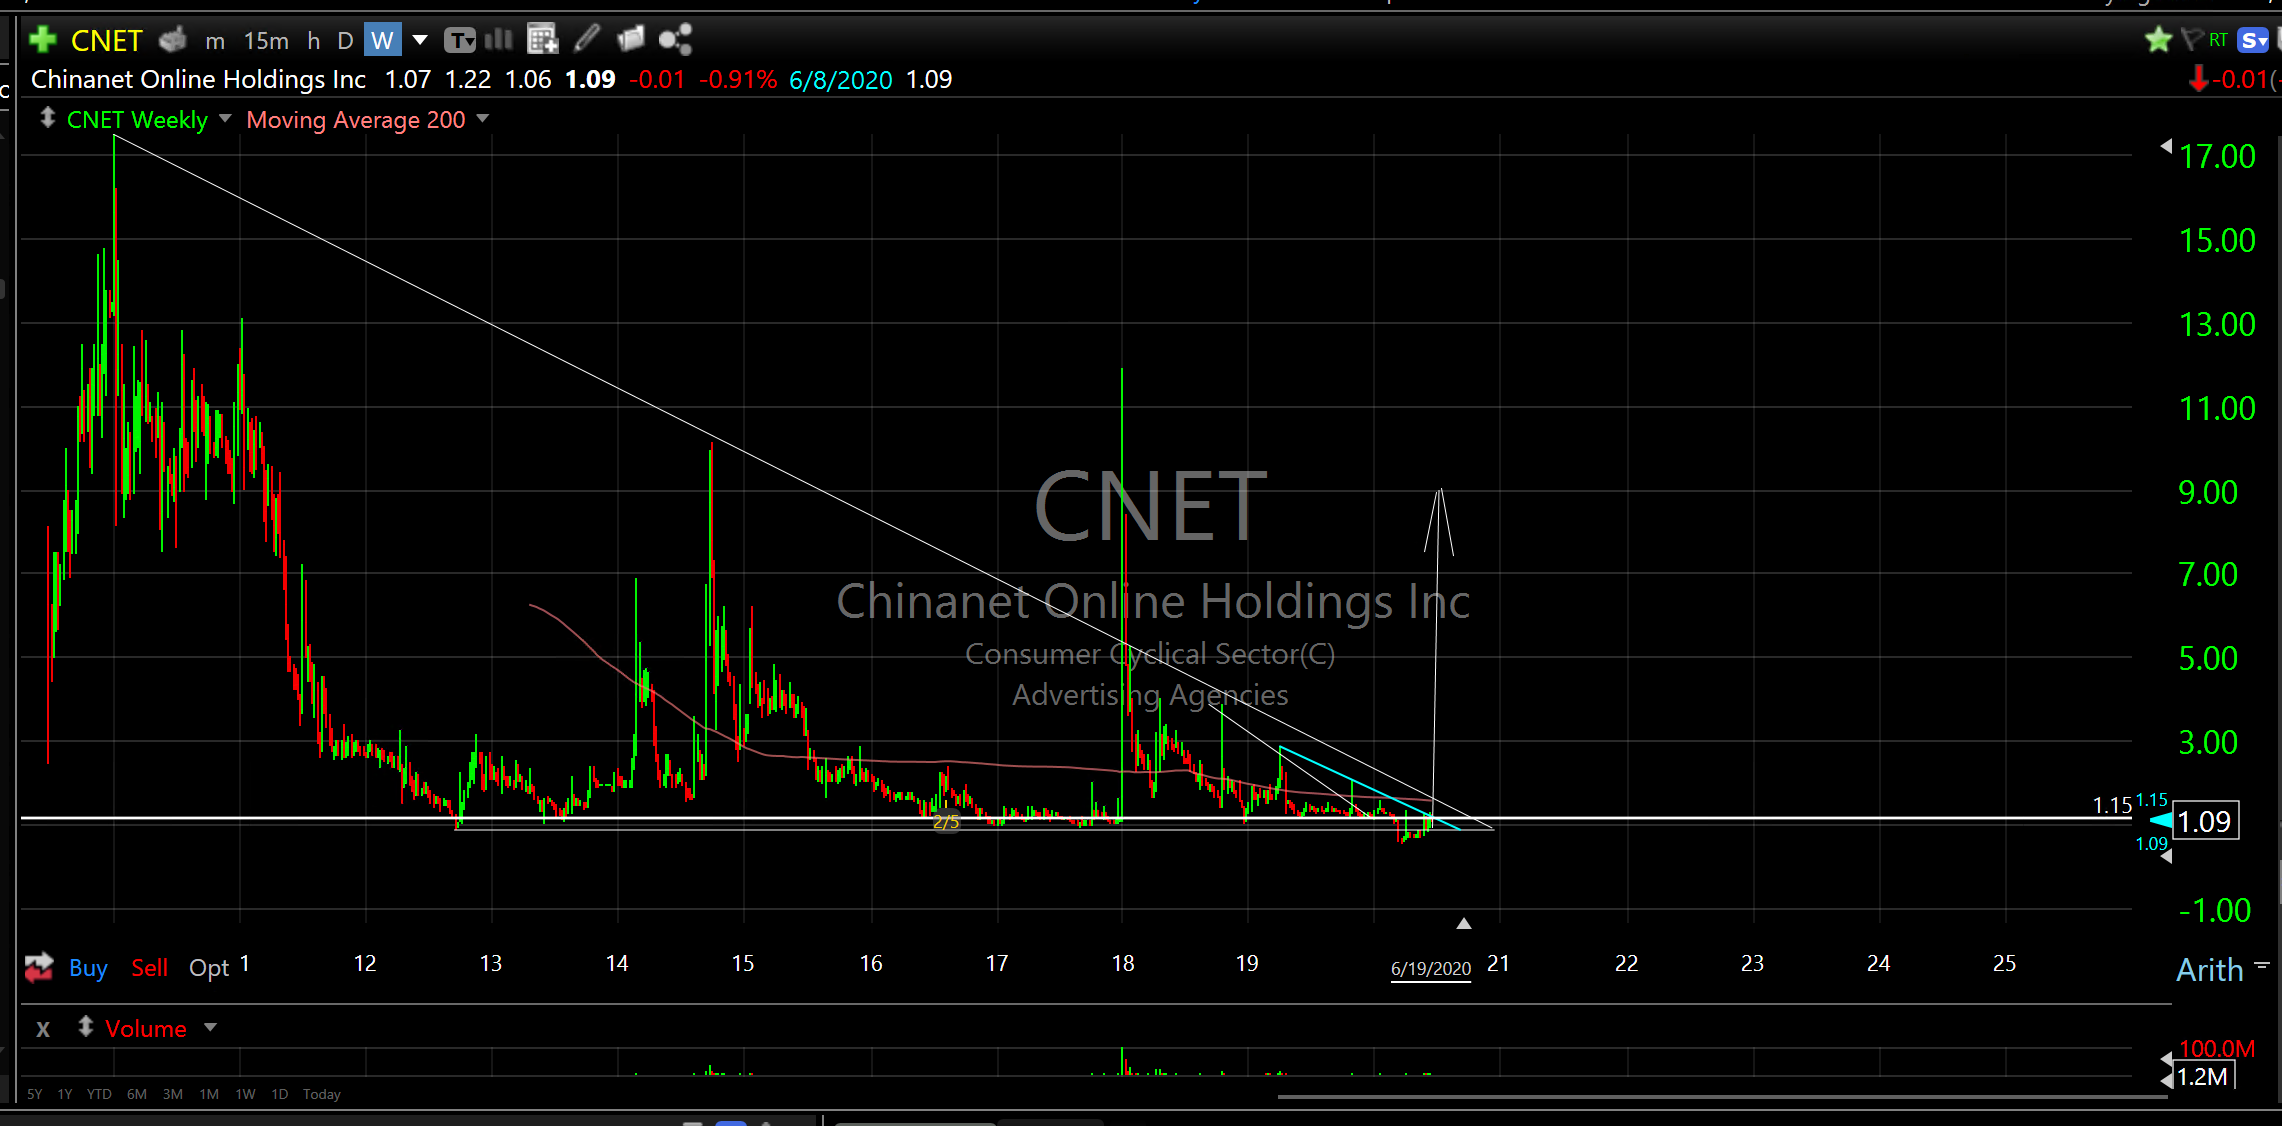
Chinanet Online Holdings Inc (CNET) daily
Make investing fun..and really profitable,
Don