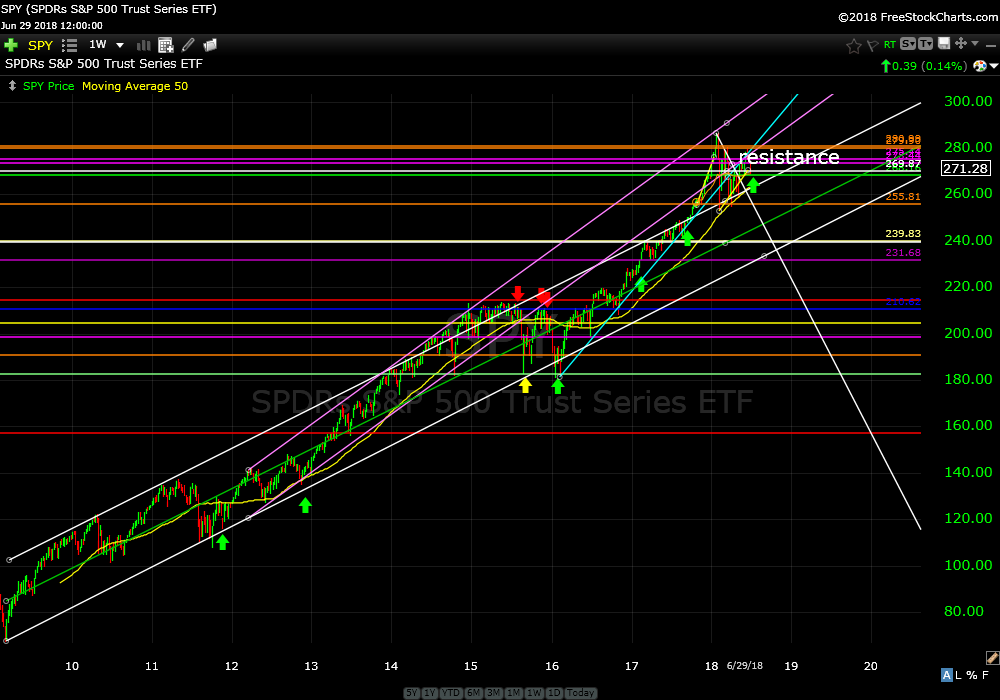
SPY has had three down weeks in a row but is still trading well above it’s rising channel from the bottom in 2009. Any time price trades above it’s long term rising channel it would be normal to correct back down and resume it’s uptrend inside the channel where price would be in a more sustainable uptrend. Investors need time to adjust to higher prices. See weekly chart from 2009.
SPDR’s S&P 500 Trust Series ETF (SPY) weekly
A closer view from September 2017 reveals some positives in light of three straight down weeks. There has been demand at rising levels following the February dump.
SPDR’s S&P 500 Trust Series ETF (SPY) weekly
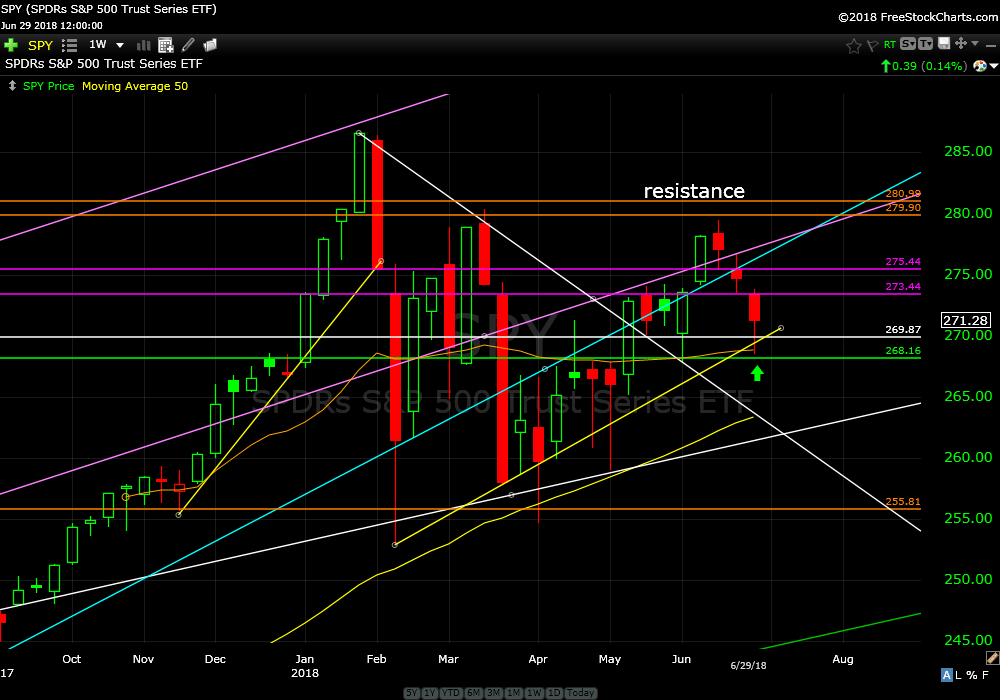
See the short rising yellow trend line that keeps getting tested where the weekly lows and highs are generally rising. This is positive albeit short term. It appears price is undergoing the 2% correction I wrote about prior to last weeks trading and this short term support sure has the attention of buyers.
I know it feels really difficult to buy at these levels. Right? I get it. I chickened out last week. I was going to buy more SPY on Thursday mid morning when price traded down and tested this area. I didn’t. Price is grinding higher. Would I rather buy it lower? Of course. Is there a possibility it will never trade lower than right now? Yes. Hmmm.
Remember, you can always sell it. You’ve got to love selling. Right?
I’m recommending SPY… IF it’s not trading below 269 Monday morning around 11:15 Pacific Time.
Trade Smart,
Don