TSLA Inc (TSLA) daily
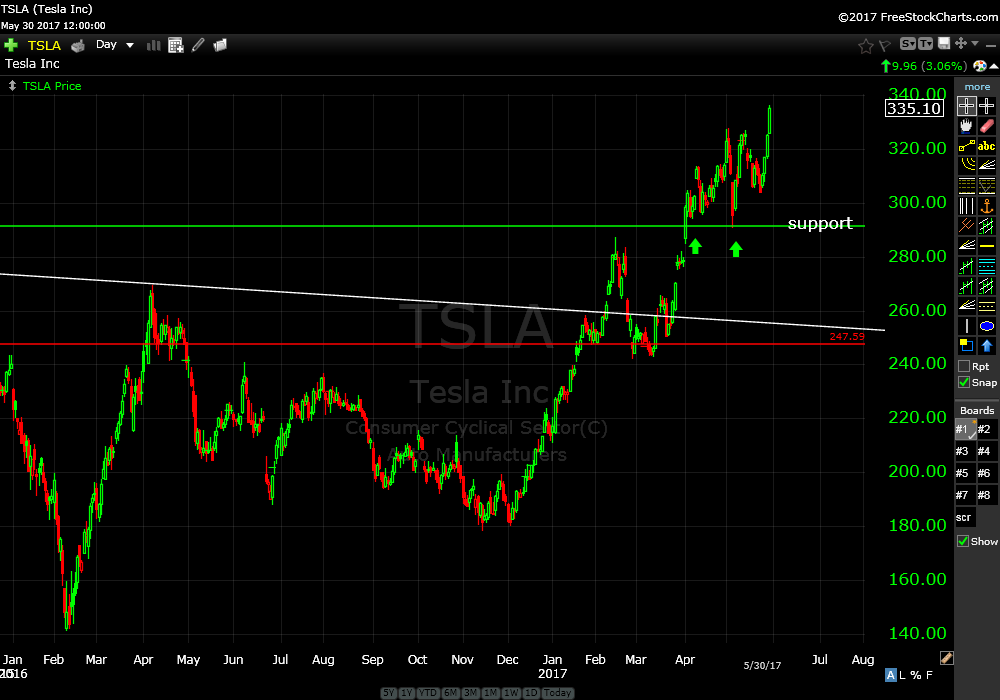
Our recommendations from April 4th and May 8th are up about 12% and 10% respectively. TSLA has ripped higher like a slot car on steroids during the past four trading sessions.
Continue to hold.
SPDR’s Select Sector Energy ETF (XLE)
Our recommendation from May 8th is off about 3% and has closed today under primary support; the green upwards sloping trend line. We are not going to live with this too long if price stays under this level of support.
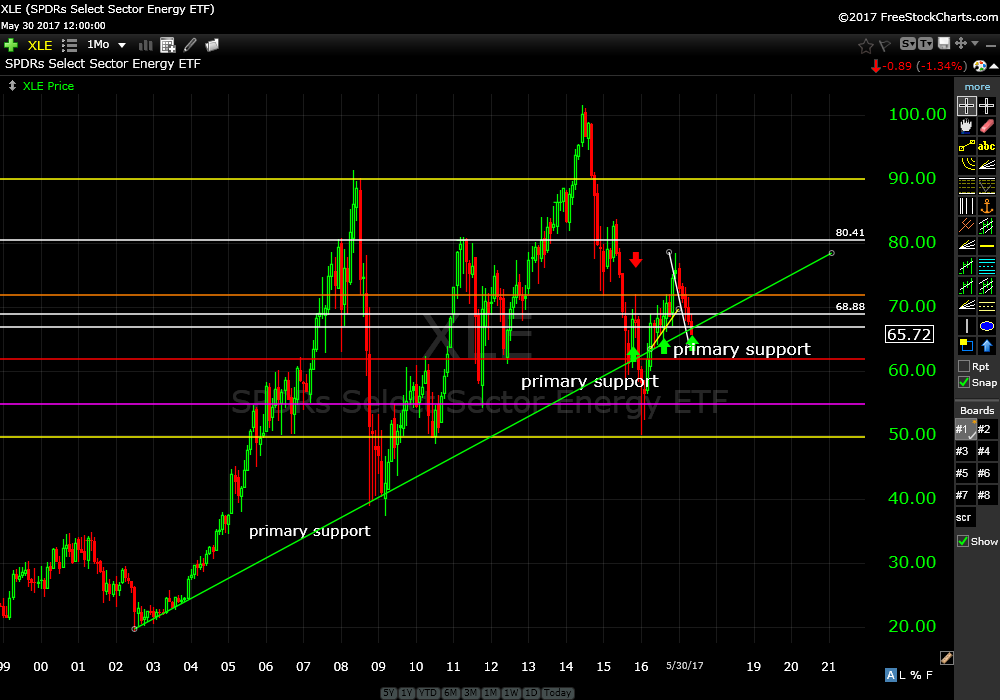
You can see from the monthly chart that this support level goes back to 2002. It was broken significantly in the fall of 2015 when oil prices were falling off a cliff. That is only one serious break in 15 years. We have to give this a little more “breathing” room.
SPDR’s Select Sector Energy ETF (XLE) monthly
You can see the break more clearly on the daily chart.
SPDR’s Select Sector Energy ETF (XLE) daily
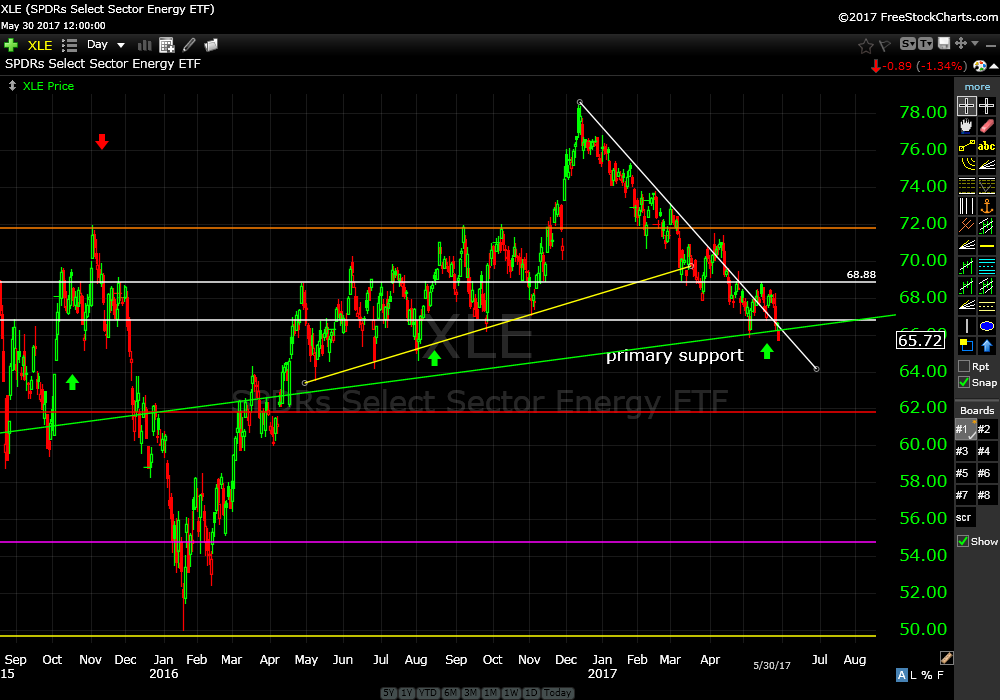
Continue to hold.
Most all other open positions have been running higher. Let them run.
Remember, it’s not about being right or having some fundamental premise that price action on any asset should go up or down and just jumping in with a bunch of hope. It’s about limiting losses and maximizing gains.
Once I figured out that the “guru’s didn’t know how to manage risk I really didn’t give a shit what they thought. That’s when my world changed.
Trade Smart,
Don