I received an excellent question this week from one of our subscribers…
“Hi Don, Regarding XLE, you say to exit with multiple closes below the rising support trend line. Are you referring to the weekly chart? So am I correct that we should wait for 2 weekly closes below the trend line to exit?”
Let me start off by saying buying and selling equities is not an exact science. There are no hard and fast rules. But, there are tendencies, consistencies and correlations.
My research of the S&P 500 index and its proxy, SPY, has shown that two consecutive weekly down (red) closes below primary support is a very good indicator of further downward price action. This is a consistent tendency that correlates with price direction. It’s like tequila tends to lead to bad decisions and hangovers.
You must understand the asset when deciding when to sell
To compare SPY with XLE, SPY has 500 holdings and XLE has 37 holdings. XLE has a beta of 1.3. This just means XLE will likely move more in the same period of time than SPY. So, waiting for two consecutive weekly down closes with XLE will probably result in a larger move. Therefore, 4-7 days trading days that are consistently below trend line support and are mostly down days is what I would look for with XLE.
The dynamics of the underlying asset must be considered. This is why I am not a fan of static percentage, trailing stop losses.
Stop Losses
Typically, it is suggested to use an 8% to 10% trailing stop loss. Even in a very orderly asset, like GE, you are likely to get stopped out and miss the best part of the party. Don’t you just hate missing the best part of a party?
Take a look at the weekly chart for GE for a good example of this.
General Electric (GE) weekly
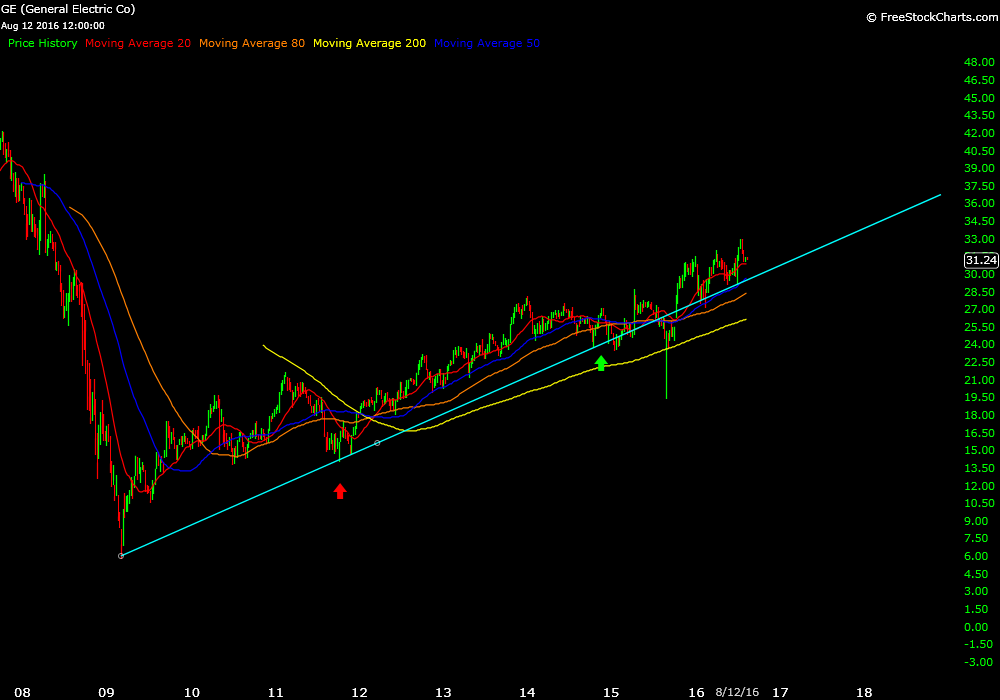
You would have been stopped out at the red arrow. DAMN!
When developing an exit plan, to either minimize losses or capture gains, you must be aware of the tendencies of the underlying asset. What is its typical range in various time frames. What is its beta? How does it react to certain indicators and your particular framework around price? What correlations are consistent?
Having an exit strategy is the most important aspect of trading/investing yet it is the least examined. Why? Because it doesn’t fit well with the buy and hold preachers.
Thanks to MS for the great question.
Trade Smart,
Don Roth