Most country stock indexes across the globe are still powering higher, even Canada, eh. Continue to hold the stock index ETF’s that I have recommended. You can find these on the web site in the members Trade Alerts page under “Open Trades”.
Energy has reversed over the past few trading days after hitting within six cents of the high made on December 12, 2016…see the blue horizontal line I drew in prior to the reversal. The symmetry that occurs over and over in equity price action is not only beautiful but allows us to “see” the market is not random…and…can be taken advantage of $. Please note…the often touted “random walk theory” is BS.
SPDR’s Select Sector Energy ETF (XLE) daily
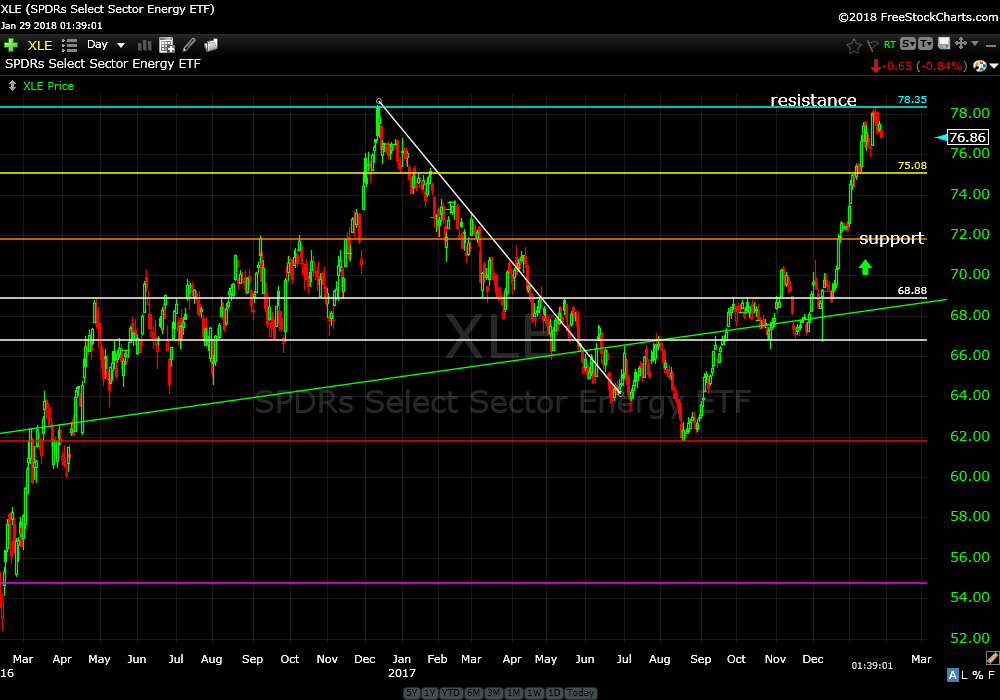
XLE, the energy ETF I recommended on January 8, is still profitable but has hit the resistance I wrote about last week and is fading back a bit. This is not surprising. We need to let this play out a few more days to see if resistance can get taken out. Continue to hold.
Intel Corp (INTC) daily
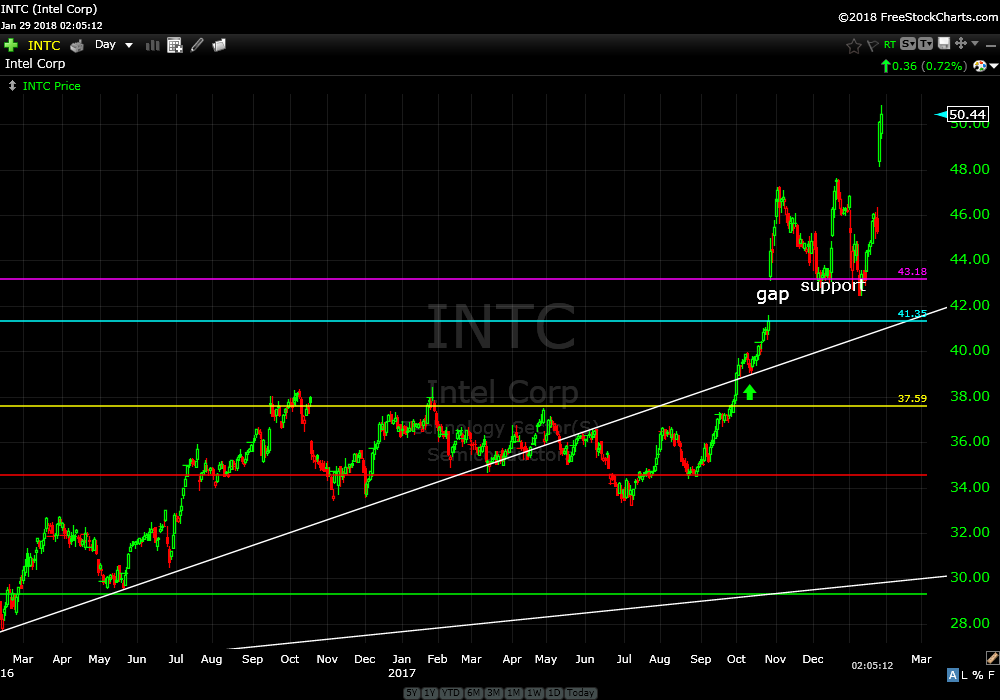
I recommended Intel Corp (INTC) on October 9 of last year. Price has recently ripped up through the 1999/2000 price zone (previous resistance) I wrote about a couple of weeks ago. As of today, Monday, January 29 2018, price is up 27% from my recommendation. Continue to hold.
Goodyear Co (GT) daily
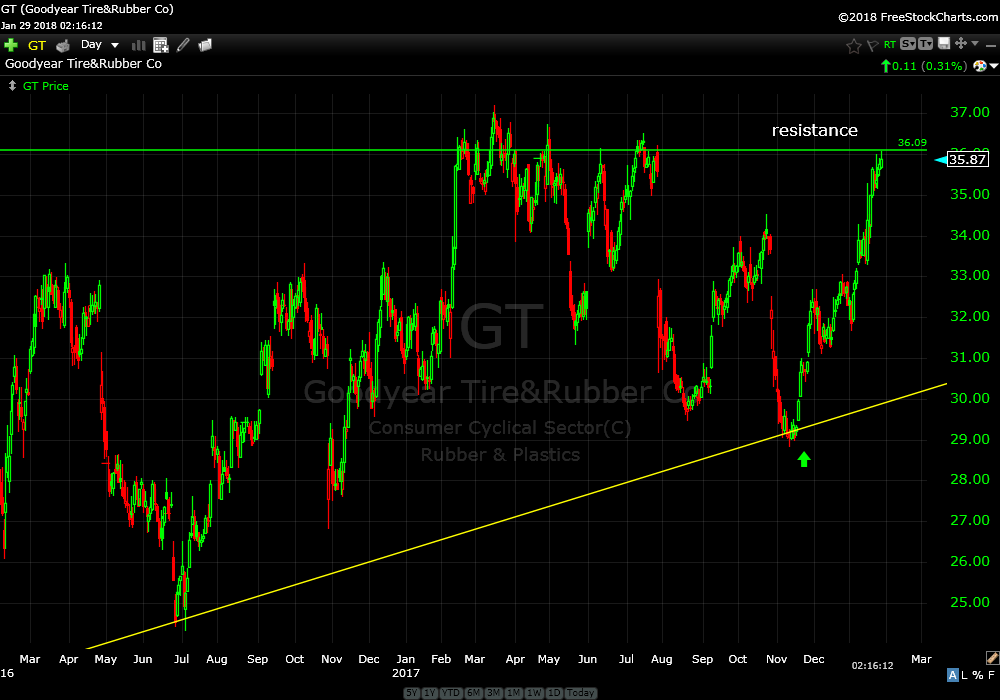
I recommended Goodyear Tire&Rubber Co (GT) on November 20 of last year. Price is currently up about 12% since. See daily chart for price action subsequent to my recommendation (green arrow).
Goodyear Co (GT) monthly
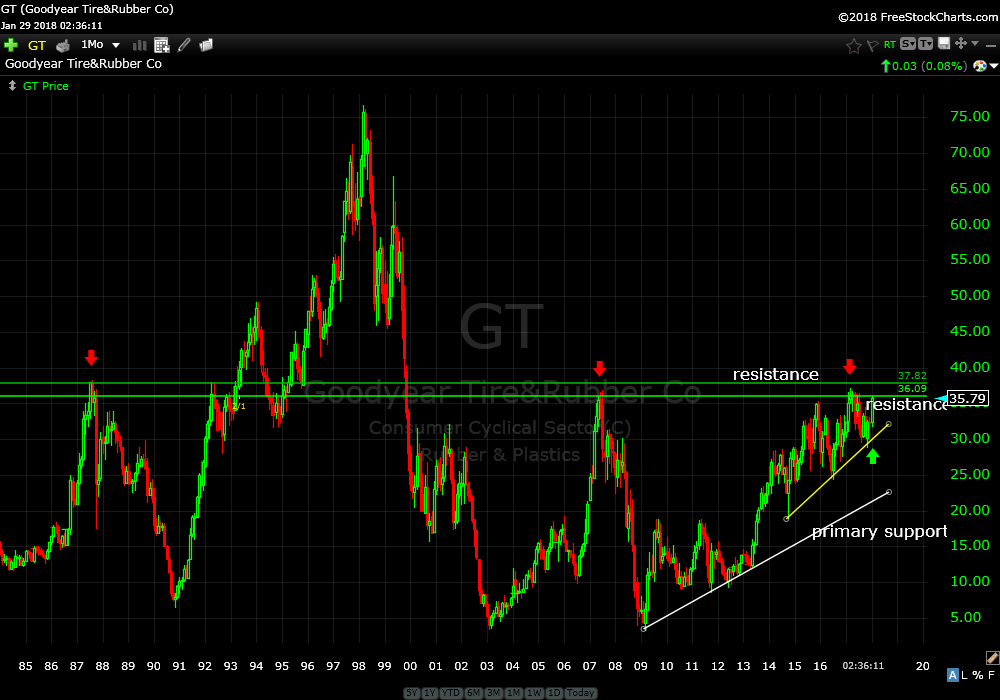
See monthly chart to see how important the resistance zone is. Note the highs (red arrows) from 1987, 2007 and 2017. This price zone bracketed by the two green horizontal lines. Will resistance hold or be broken? Time will tell…Continue to hold.
SPDR’s Select Sector Financial ETF (XLF) daily
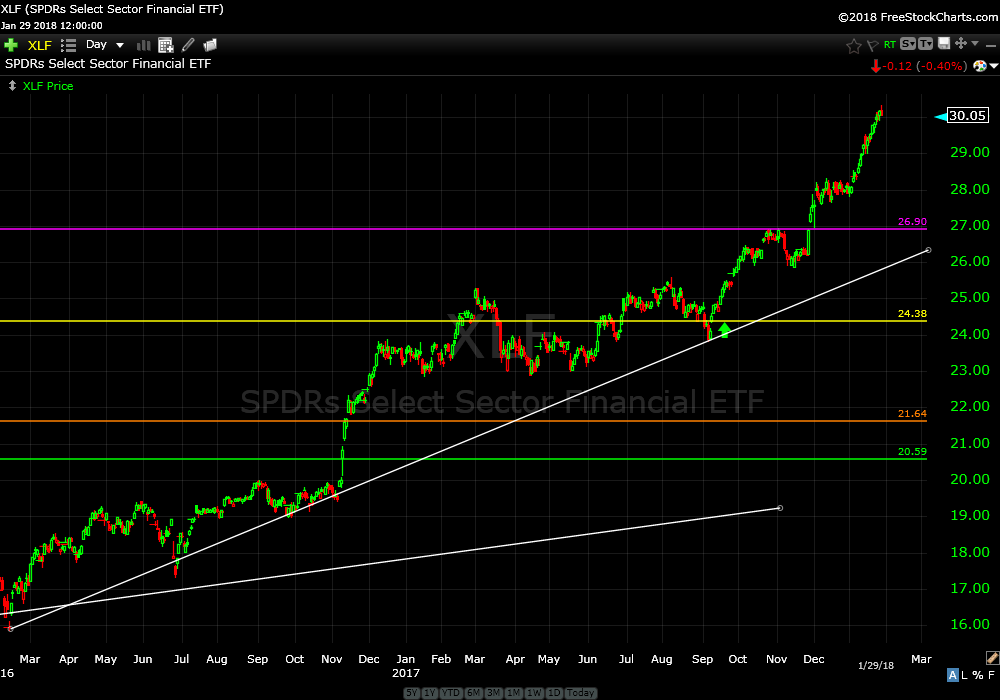
I recommended XLF, the SPDR’s Select Sector Financial ETF, on September 28 last year. Price is up about 17% since then. Looking at the daily chart you can see price action over the past two years.
SPDR’s Select Sector Financial ETF (XLF) monthly
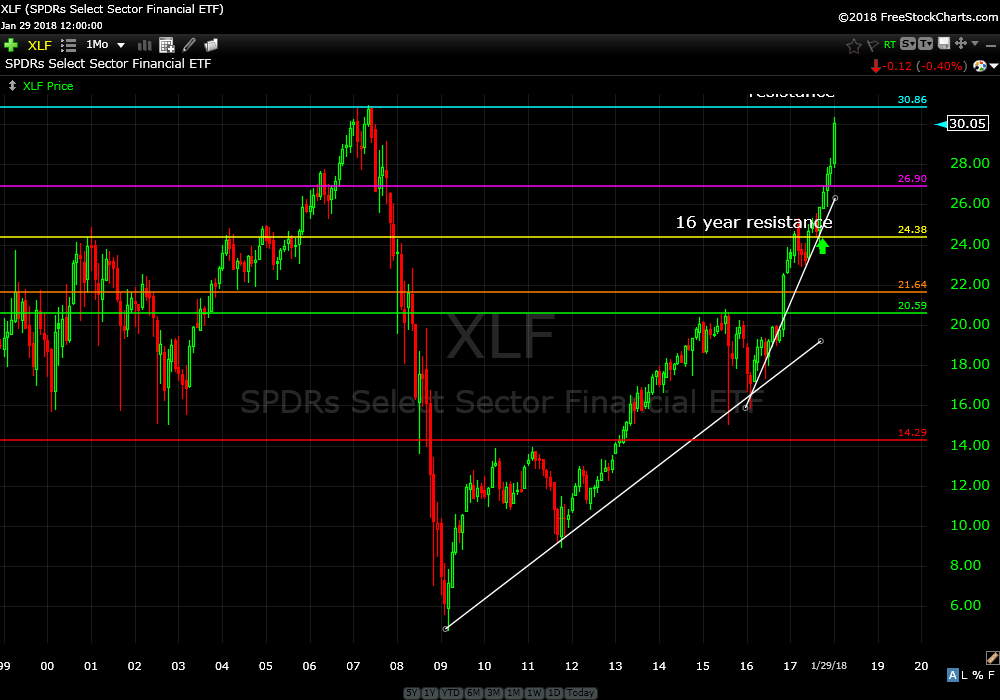
It’s not until you look at the monthly chart that you can see price is almost at resistance, the highs from 2007 just prior to the “financial crisis”. Expect price to stall or pull back at or near $30.95. Continue to hold. If price breaks up and through this important price zone expect good follow through to the upside.
SPDR’s Select Sector Health Care ETF (XLV) daily
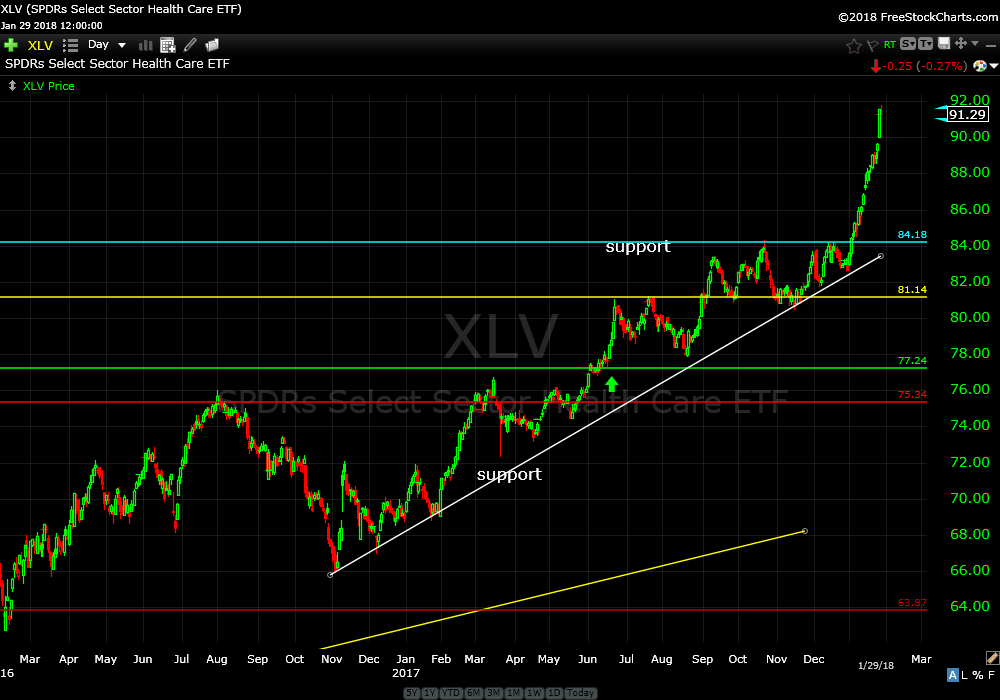
I recommended XLV, the SPDR’s Select Sector Health Care ETF on June 21 last year. Price is up about 15% since. You can see the bullish breakout above the 2017 highs on the daily chart. Continue to hold.
Continue to hold all other open individual stocks and ETF’s.
Speaking of the “Random Walk Theory” which is quite well known among stock market professionals, I heard another theory the other day. The theory states that Rocky Road ice cream is bad for you. This theory is also BS.
Trade Smart,
Don