Look at all of the buy signals!
Visa Inc (V) weekly
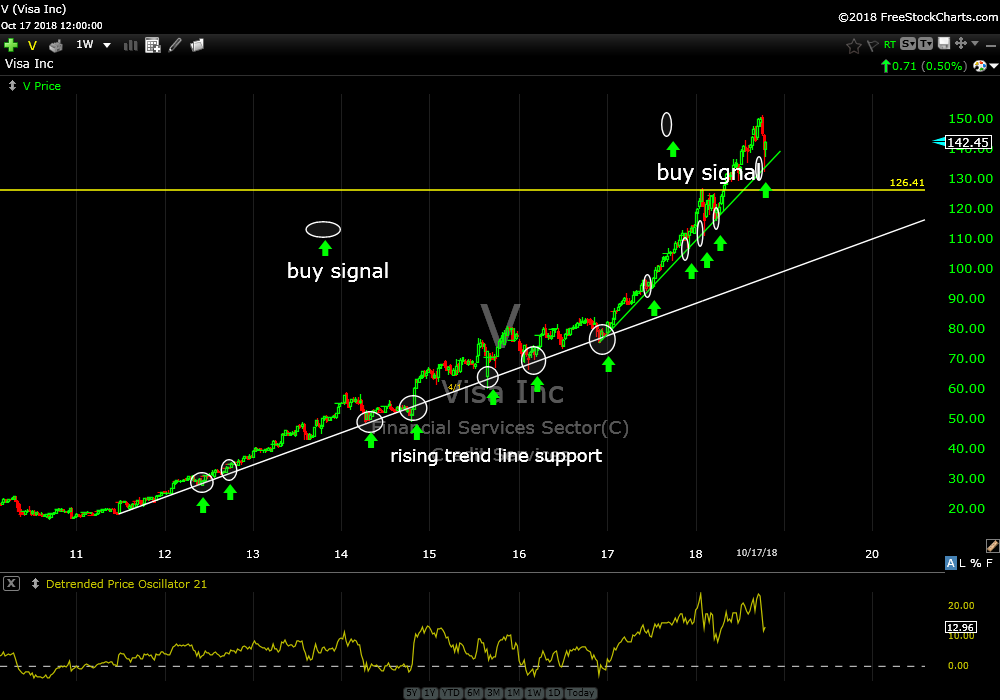
Only one violation of support in nine years (2015). I just want to show you the symmetry of this chart and how using rising trend line support for entries is so valuable and emotionless. The trend steepened beginning in early 2017 and the higher lows created the new (green) rising trend line. To look closer at the buy signals from 2017 see the daily chart.
Visa Inc (V) daily
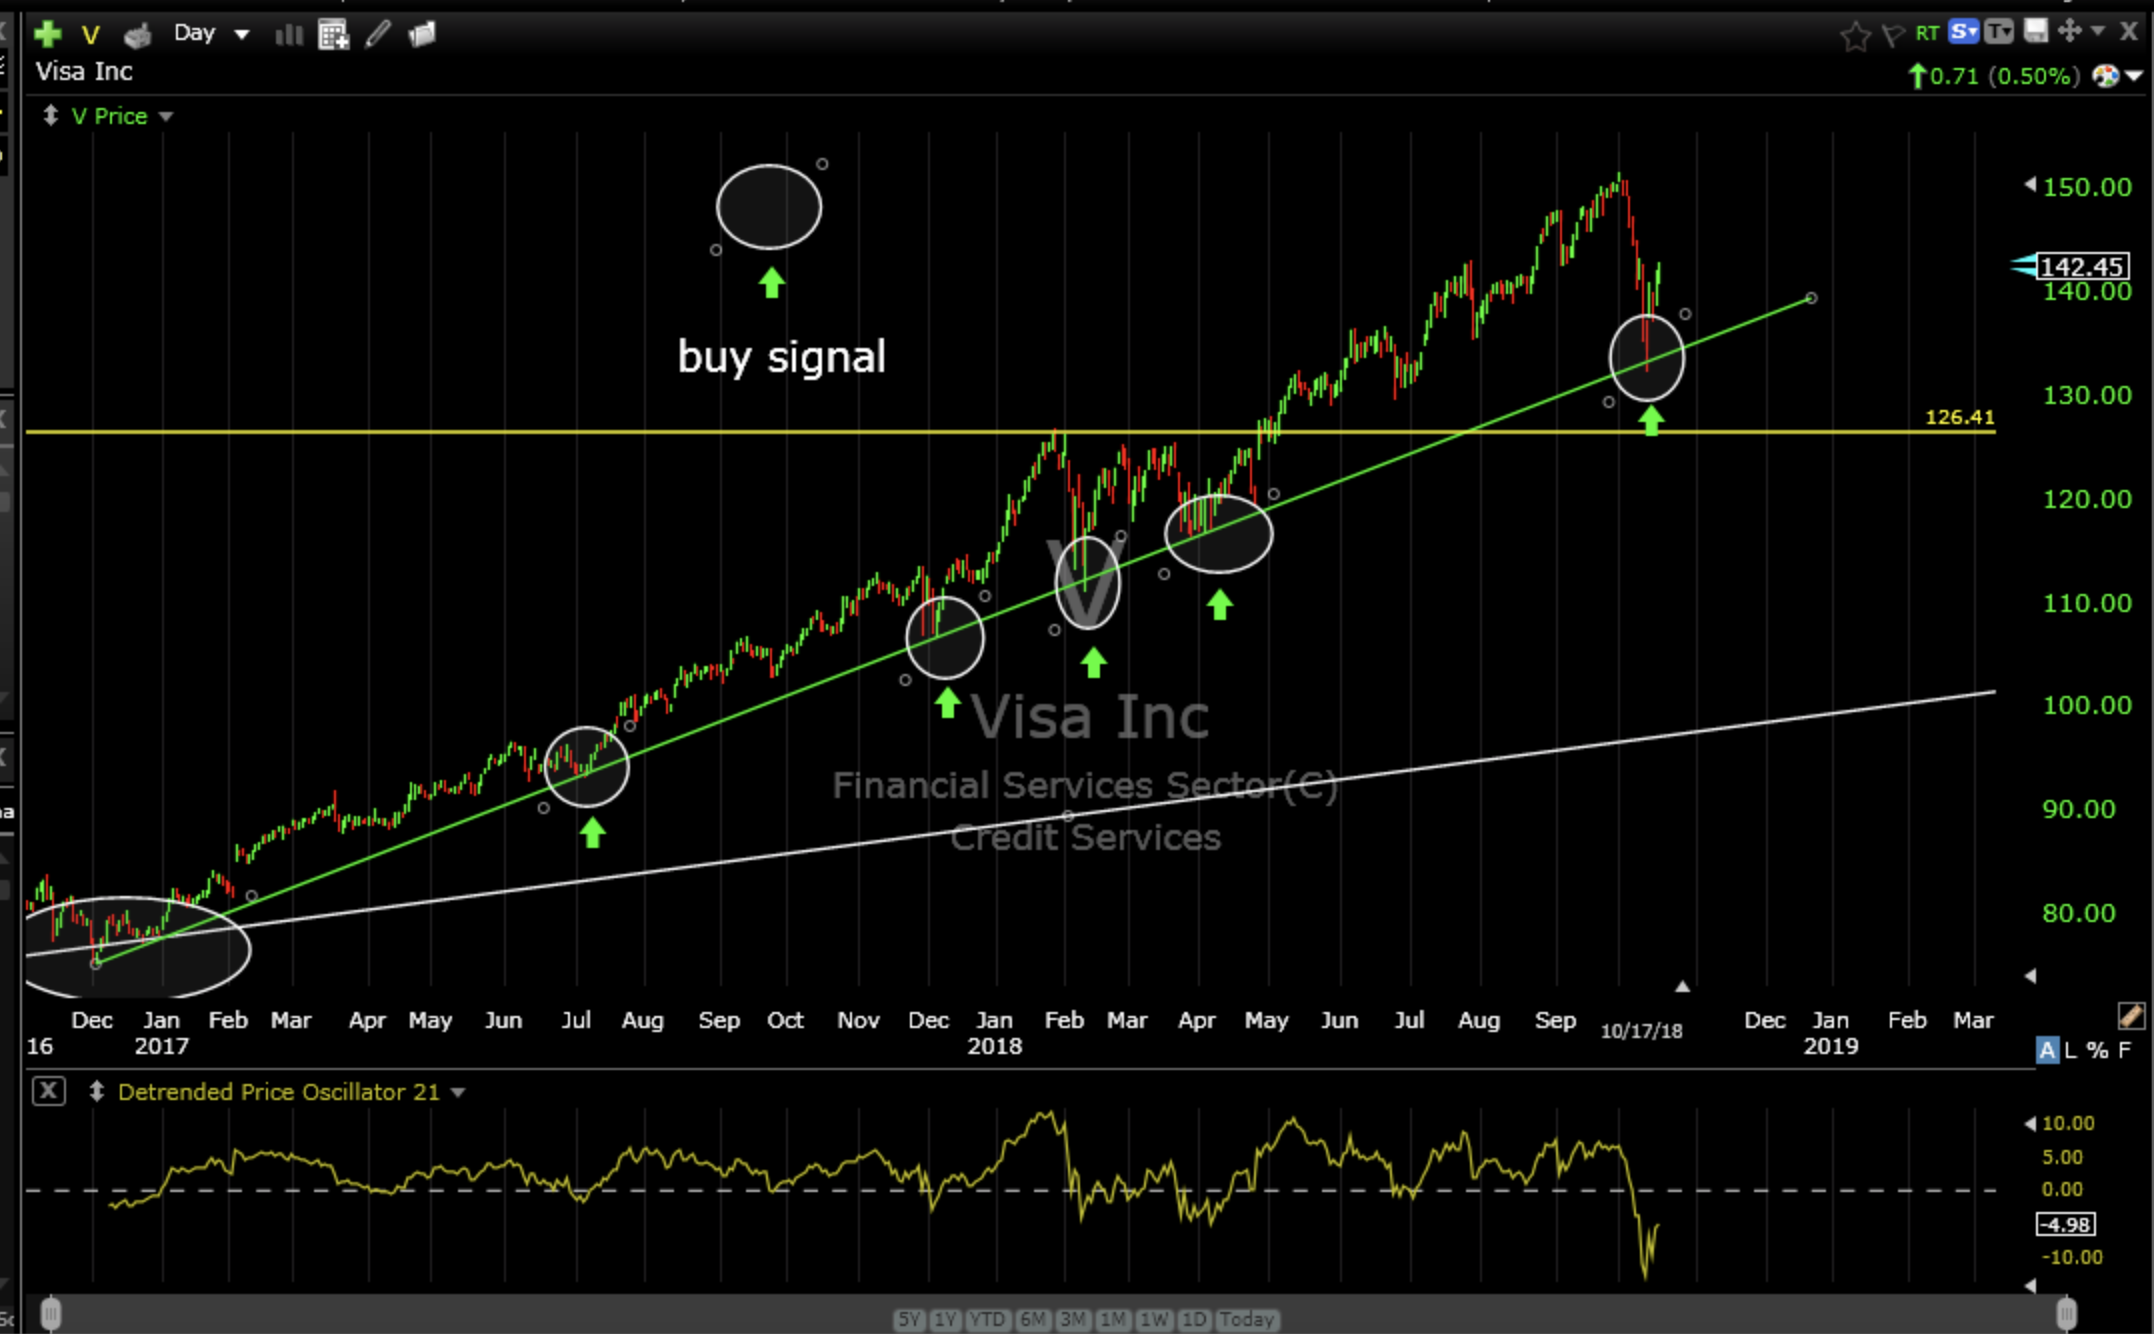
Which part about this is random? (use sarcasm font)
It’s also a good example of why I should repeat over and over to myself…”Don’t over think it, just do what the chart says”.
Well, the chart says to buy…again. I say to myself “I’m afraid the market will bring everything down” or “It’s too steep of a trend” or “financials aren’t doing well” or “primary support is too far away” or the other 472 reasons swimming around in my brain.
Note to self: Shut up and buy some Visa Inc (V).
I’m not going to lie. I’m a little nervous about the market. Guess what? Everybody is nervous. I think this is a good thing. Sometimes the hardest trades are the best trades.
Visa Inc (V) is going on the buy list.
Trade Smart,
Don