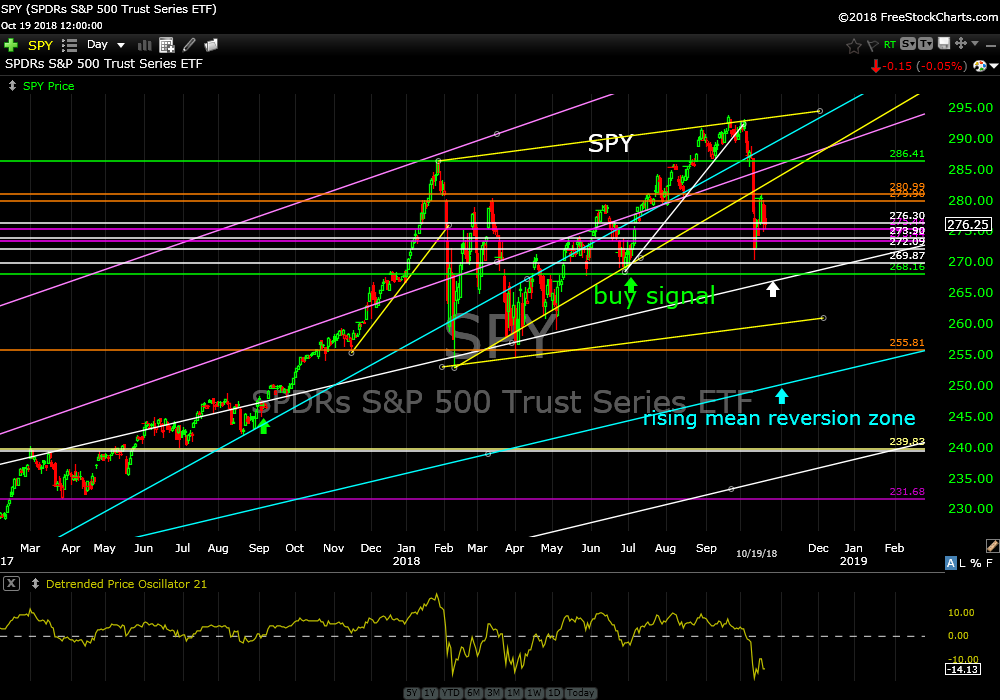
Price action in the S&P 500 Index this past week tried to grind higher but after regaining about half of the prior week’s losses proceeded to fade back to ending the week just slightly up. Considering price was all over the lot it didn’t feel too panicky though. More like an “orderly run for your life” situation. (insert laugh track). Price is hovering just above the price area that preceded the second and largest leg down during the February/March dump. The good news is that the lows of the prior week tested into these lower depths from February and were then bid up to where we are now.
SPDR’s S&P 500 Trust Series ETF (SPY) daily
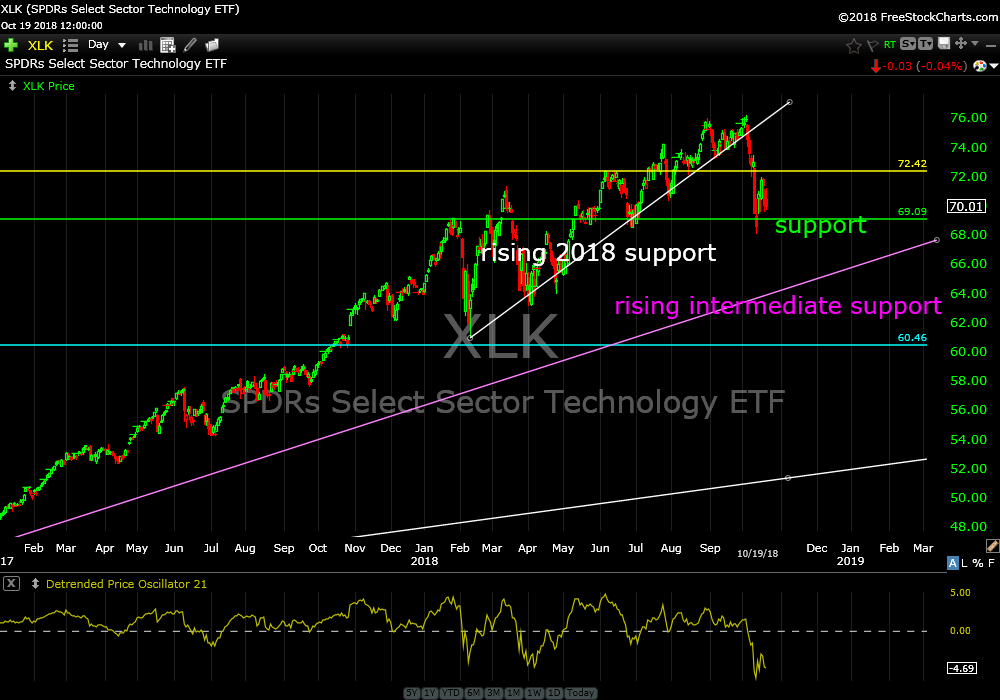
The bad news is that the highs of this past week tested higher and got rejected. The other bad news is tech stocks. XLK, the tech sector ETF, is sitting right on top of similar support and if broken (likely soon) will most likely get sucked all the way down into rising intermediate support. This is about 9% lower from Friday’s close.
SPDR’s Select Sector ETF (XLK) daily
Invesco QQQTrust Ser 1 (QQQ) daily
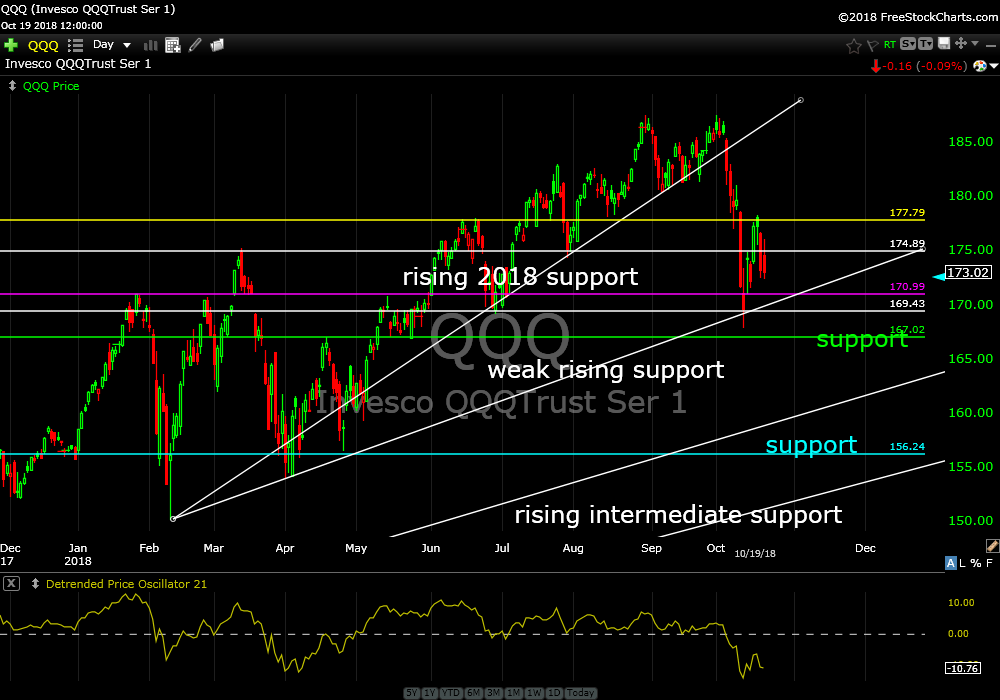
If this happens it will certainly impact most other sectors negatively. I would expect the S&P 500 Index ETF (SPY) to correct down into the middle of the rising channel bracketed by the two parallel rising white trend lines from the bottom in 2009. This would be perfect mean reversion and a healthy re-pricing to continue a more sustainable glide slope. This just happens to be about 9% lower from Friday’sclose as well (blue rising trend line).
Even if current support holds and price continues higher from here I don’t think that would be the healthiest way to unwind the damage that’s been done. If we go straight up from here I’m afraid the rally would fail near the previous high. The damage that’s been done is significant and needs time for digestion. Investors need time to get used to lower prices as well as higher prices.
With 2018 rising support in the S&P 500 and tech sector getting busted I’m not sure how we are not going lower. And, if we do go higher from here I think the rally will fail. I’m not sure how to be any more clear; to my eyes we are likely going down into rising intermediate support (rising purple line) on XLK and down into the middle of the 2009 bull channel on SPY (rising blue line). This could happen next week or get resolved through choppy price action for six months until the mean catches up with price. Either way, this support break needs to get resolved by lower price or time.
This does not mean the bull market is over. It just means price is adjusting back to a more sustainable uptrend or glide slope (mean reversion)… if my thesis is right.
Remember, these are just my opinions.
So, would I sell everything? No. I might be totally wrong.
Would I continue to trim? Yes. I might be totally right.
For bookkeeping purposes I’m recommending taking profits on 25% of the following ETF’s.
SPY
QQQ
XLK
Remember, these are just my opinions and you should be comfortable with whatever decision is best for your own individual situation. I could be totally wrong but to my eyes going higher from here is not sustainable and it is more likely we will see downward, choppy pressure.
If you see XLK print under 68 next week we should get the downdraft.
Let’s hope I’m wrong.
Trade Smart,
Don