Let me just get this out of the way.
I began warning of lower stock prices three weeks ago…here (October 8) when bonds broke down. This was two days before stocks began selling off. I also explained why this was likely to happen. I also recommended trimming your exposure.
Two weeks ago…here (October 15) I recommended more trimming and selling into strength (there hasn’t been much of that other than a few days). I also explained why.
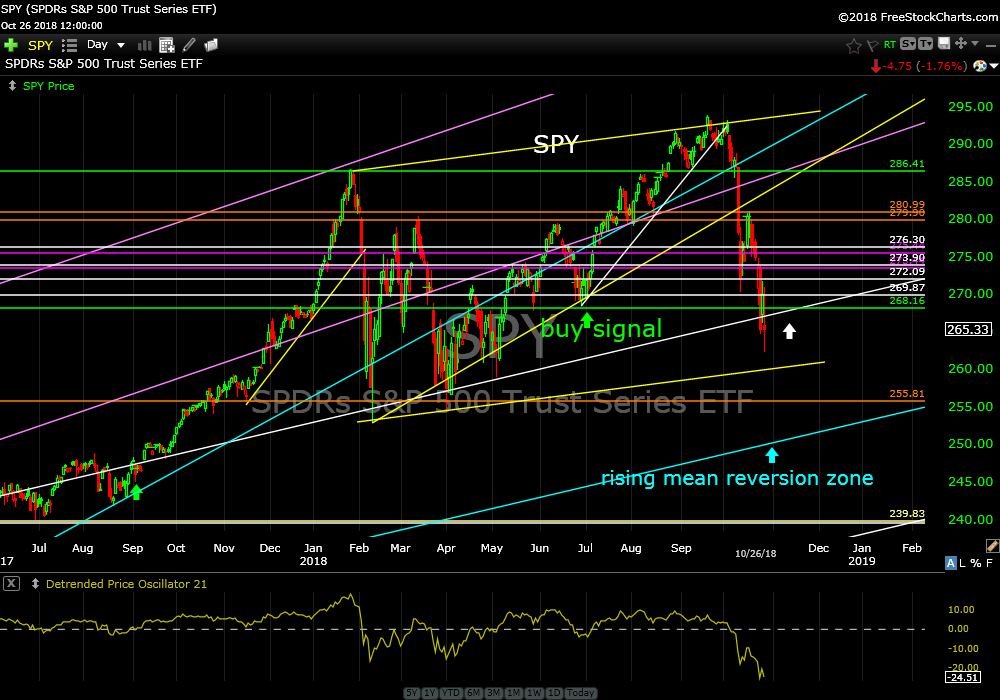
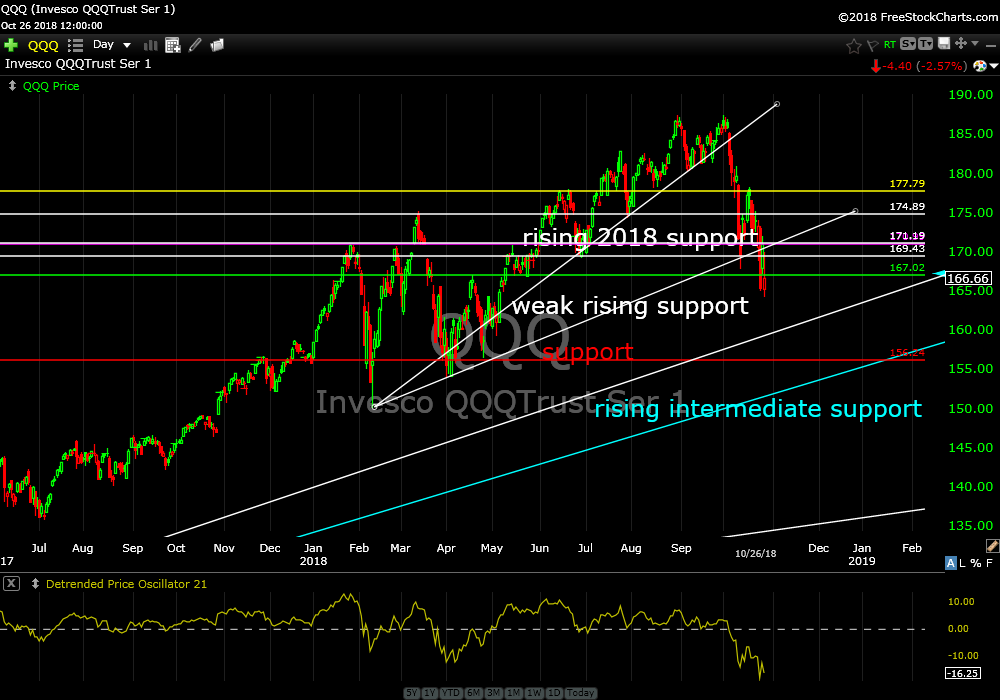
Last week…here (October 22) I recommended selling a big chunk of the S&P 500 index ETF (SPY), Nasdaq (QQQ) and the the technology sector ETF (XLK). I also explained why. SPDR’s
S&P 500 Trust Series ETF (SPY) daily
Invesco QQQTrust Ser 1 (QQQ) daily
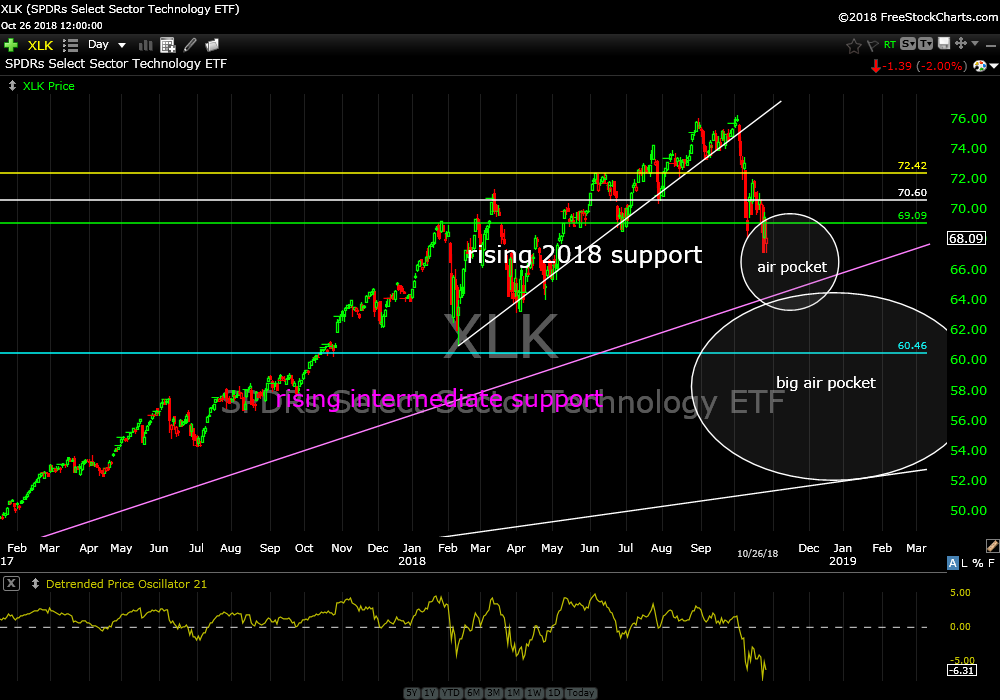
SPDR’s Select Sector Technology ETF (XLK) daily
I’m not going to lie. That’s about as good as it gets. I can’t read the market any better than that. And, I’m really a pretty humble guy but I don’t know anyone who got this as right as I did or as timely. At least, so far.
If you know of someone that did please let me know. Otherwise go tell everyone you know about SmartChartInvestor.com …thanks…
So Now What?
My opinion has not changed. I would be shocked if the selling is over. I still expect technology to lead the broader market lower. Refer to last weeks update to revisit the levels I expect the S&P 500 index ETF (SPY), Nasdaq (QQQ) and the technology ETF (XLK) to sell down into (another 6% down) before having a chance to bottom.
I am going to continue selling. I’m not selling Intel (INTC) quite yet as it is the only shining star in a very dark night. It was up 3% Friday while SPY was down 1.75%.
I would recommend selling the following…
1. More of most anything.
2. Another 25% of original positions in SPY, QQQ and XLK.
If you are comfortable with and understand options and/or inverse ETF’s to hedge your long holdings I think this would be a good time to utilize them.
The only good news that I see is that the consumer discretionary sector ETF (XLK) which has been a leader in taking the broader market higher is now just on top of support. It may get a bid up here soon but I don’t think it will be enough to stem the bleeding.
In worse news, I don’t even want to think about XLK breaking rising intermediate support. There is an air pocket underneath about the size of the Grand Canyon. See daily chart above.
I can’t, in good conscience, recommend selling everything you own as I might be wrong. I do however think there is more pain to come.
If you have any questions please feel free to email me.
If you have friends that would benefit from my work please have them email me and I will give them a premium membership at no cost for the rest of the year…thanks…
There is a silver lining. When the selling ceases there will be a lot of stuff on sale.
I thought I would go chartless today but I just can’t do it. If you don’t want to vomit then just skip over this next chart.
Standard & Poors 500 (SPX) monthly
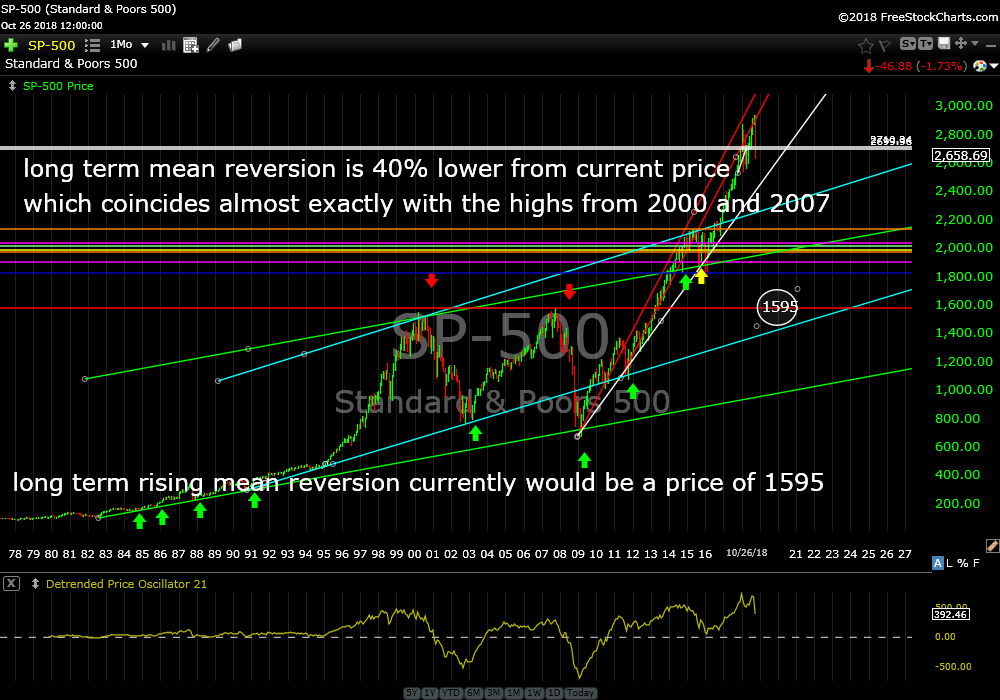
This S&P 500 index cash chart (SPX) is a monthly chart from 1978 which shows long term support. 1595 is right smack dab in the middle of the glide slope from the bottom in 1982. After you study this chart wait 5 minutes before resuming normal activity.
Trade Smart,
Don
PS. Like my new hat? Marianne and I last week in Laguna Beach at the spot we were going to get married 40 years ago. It rained that day so we had to do it indoors. If you want a hat just email me and tell me what color and where to send it.