It appears that a bunch of people had “buying stocks” on their New Years Resolution list. Stock indexes are getting bid up everywhere you look…mostly.
Check out the daily chart of SPY, an ETF for the 500 stocks in the S&P500 index.
S&P500 Index ETF (SPY) daily
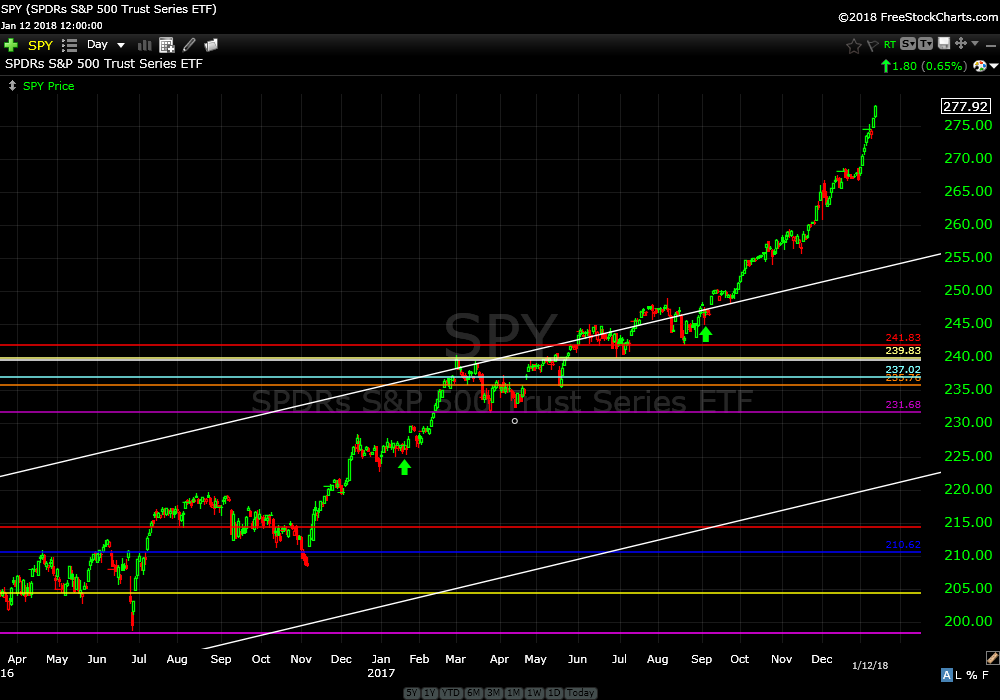
You don’t have to be a “chart guy” to appreciate the upwards slope of price action from September…up 12%…in four months. What’s not to like? Well, Pandora (P) still sucks.
I recommended Express Scripts Holding Co (ESRX) on December 14th, one month ago.
Express Scripts Holding Co (ESRX) daily
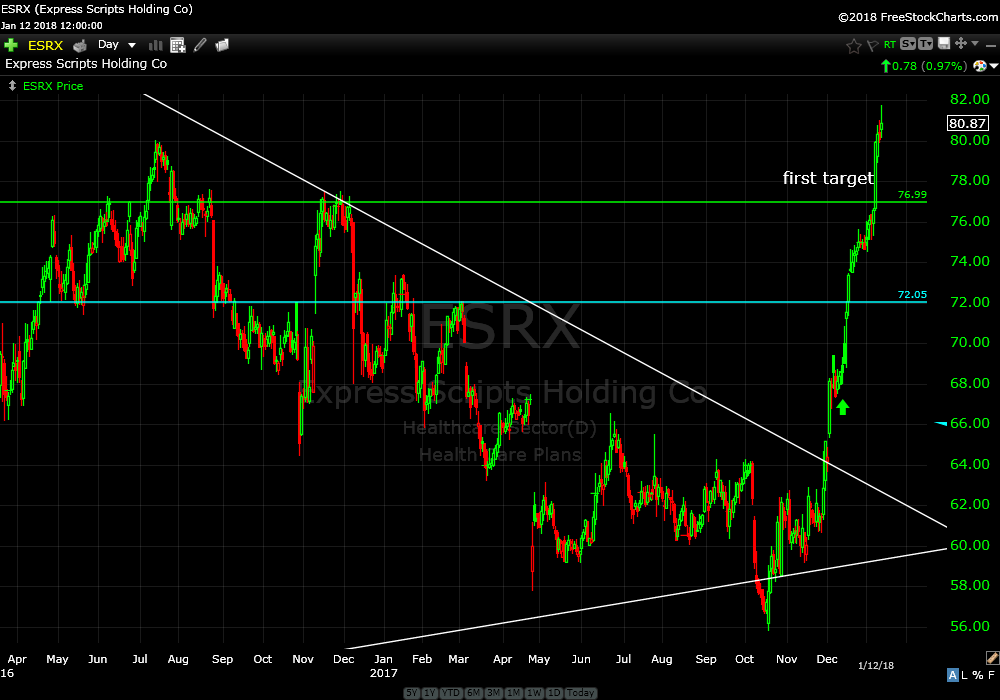
Price has ripped up through my initial target of $77 and closed Friday at $80.87, up 15.5%. Our next target is $89. Giddy up.
I recommended Intel Corp (INTC) on October 9th.
Intel Corp (INTC) daily
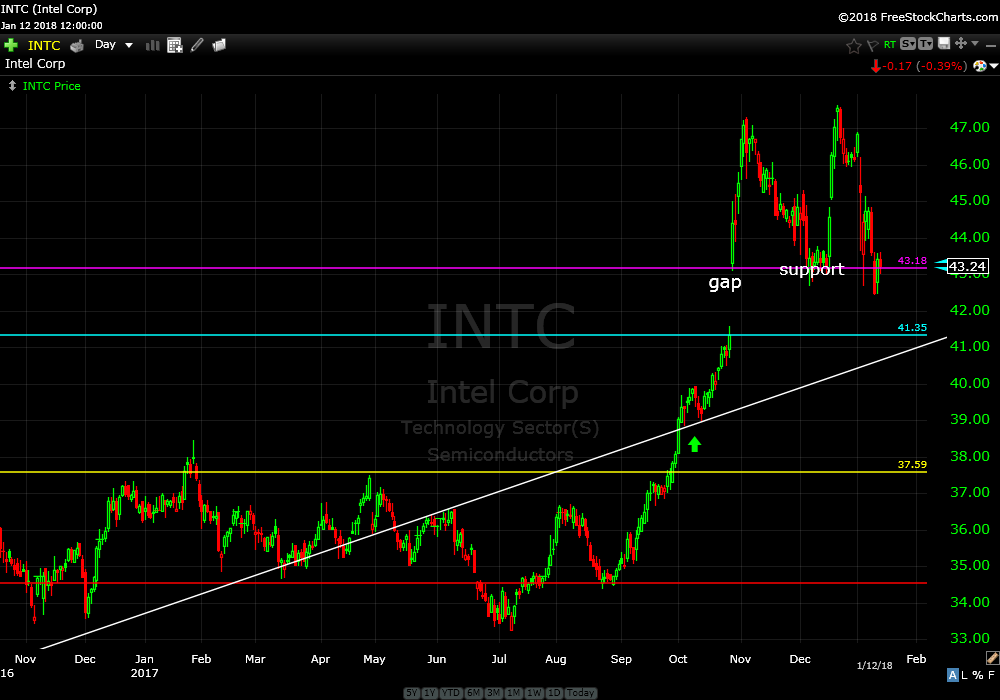
Price is currently up 9%, however, has faded back recently…again. We might have to sell this one soon.
Looking at the monthly chart from the early 1990’s please note the purple horizontal line. This is the price zone that rocketed price higher in 1999. It was also the price zone that initiated the second half of the massive dump in 2001 and 2002.
Intel Corp (INTC) monthly
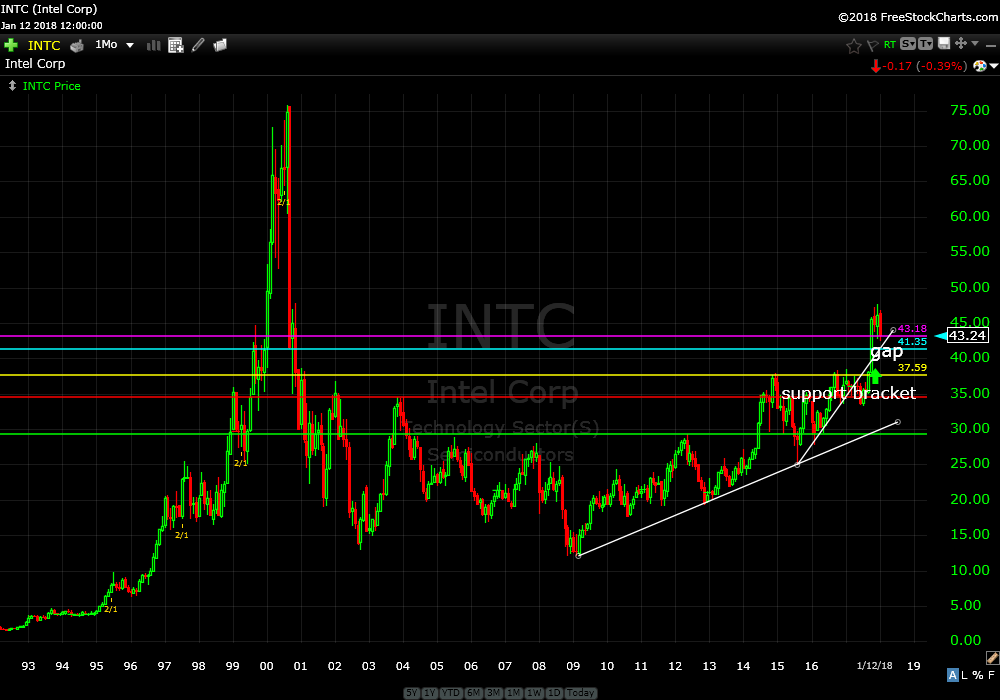
Fast forward 16 years and this is the price zone that was broken up through last October…see “GAP” on daily chart. Gaps like to get filled. The good news is that price closed the week above support, the purple horizontal line. This is a tricky price zone. Hold for now.
I recommended Facebook a year ago and price is up 40%.
Facebook Inc (FB) daily
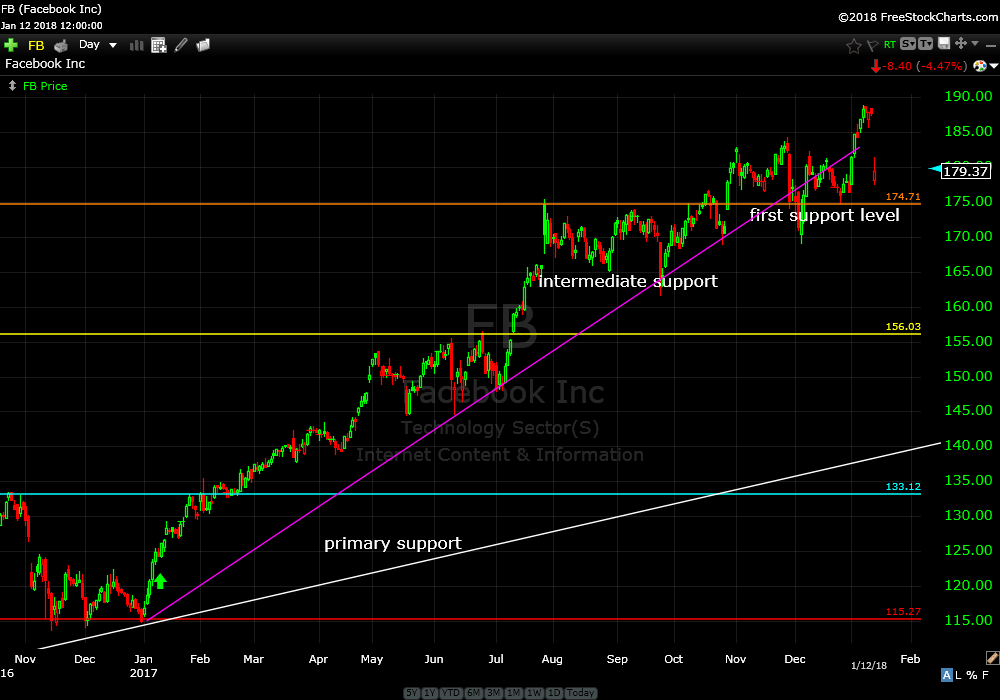
Looking at the daily chart you can see price went down 4.47% on Friday and broke down through intermediate support, the upwards sloping purple line. No worries yet. Price should get support at current “first support level”, the orange horizontal line. Continue to hold.
All other open positions are mostly flourishing. Continue to hold.
Let’s buy some stuff…
Check out the ETF for solar energy companies…
Guggenheim Solar ETF (TAN) weekly
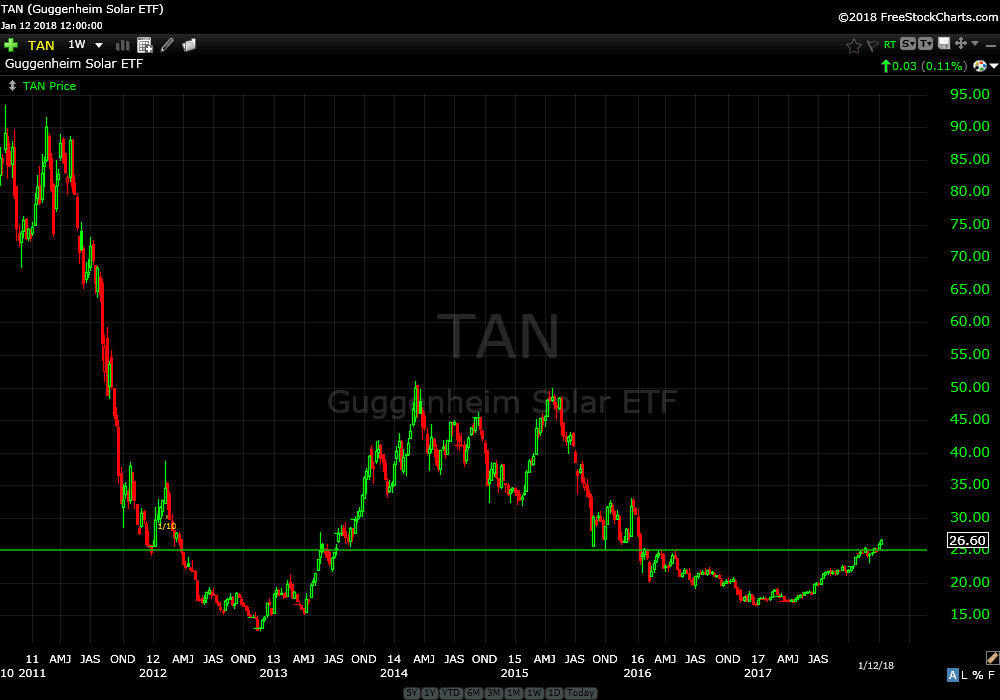
Hisorically, price is a bit volatile and was as high as $260 in 2008. Currently trading just north of $25 price has broken above a pretty important price zone over the past several trading sessions. See green horizontal line on the weekly chart.
Guggenheim Solar ETF (TAN) daily
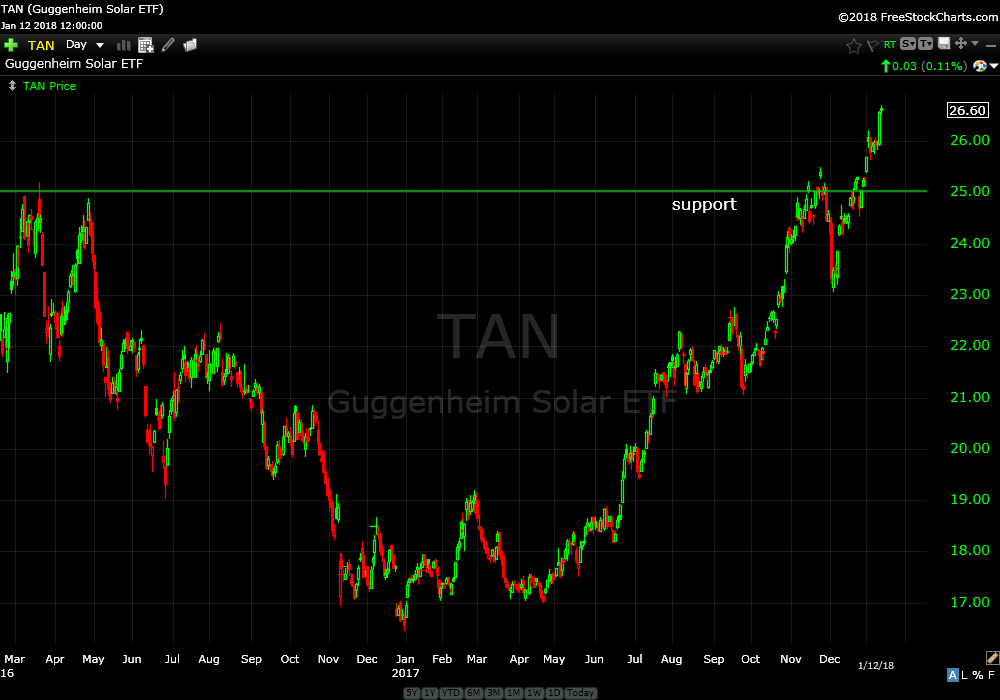
Get the close up view on the daily chart. Risk is closing below support, the green horizontal line. I’m rating this a buy.
Goldman Sachs Natural Resources Index Fund ETF is looking interesting as well…
iShares Goldman Sachs Natural Resources Index Fund ETF (IGE) monthly
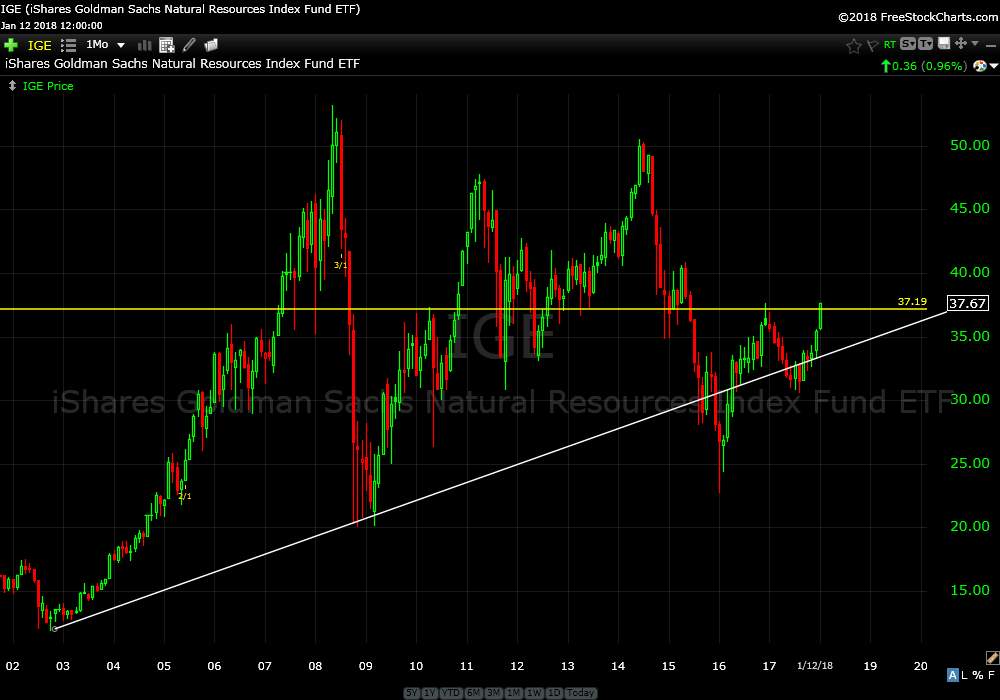
A bit on the volatile side but great price action breaking up through the yellow horizontal line which is a significant area…see monthly chart.
iShares Goldman Sachs Natural Resources Index Fund ETF (IGE) weekly
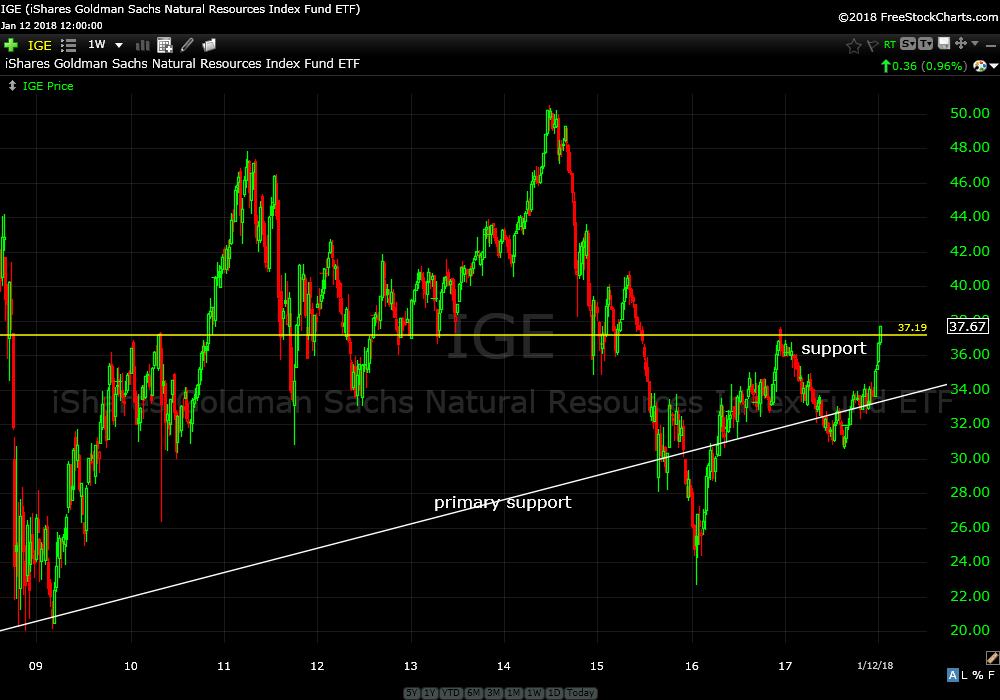
See the weekly chart and note the close this past week exceeded the high close in late 2016. Risk is below support, the yellow horizontal line. I’m rating this a buy.
By the way, there is no way to catch the majority of a bull market unless you are long at the top. Stay long my friends.
Trade Smart,
Don