The Dow closed Friday up 220 points. The world closed up big on Friday as well. Most everything but General Electric (GE) seems to be on fire.
General Electric (GE) weekly

This GE chart is about as ugly as they get. Well, Pandora (P) might be uglier. I guess not everything is going up. Shhh…do you see where they broke primary support? You know…the upwards sloping white trend lines…fancy that, they went straight to hell in a hand basket right after the breach.
Pandora (P) weekly

I had a friend ask me in 2014 whether to buy or sell short Pandora (P). This was shortly after price broke down under support. He was getting a buy from one broker and a short sell recommendation from another broker. I broke the tie when I recommended shorting it. He did. He’s happy.
Is inflation brewing? I’m not sure but the following charts sure look interesting.
Freeport-McMoran Inc (FCX) weekly

Price has cleared $17 with good momentum. In addition, price cleared previous resistance; the downwards sloping trend line. Risk is closing under $17. I’m rating this a buy.
Morgan Stanley (MS) monthly

We already have exposure to financials through the ETF, XLF, however a little more won’t hurt.
Price has cleared resistance at $52. This is now our support zone. Risk is closing below $52. I’m rating this a buy.
SDR’S Select Sector Energy ETF (XLE) monthly

To appreciate this one it’s best to start with a 15 year history of price. The long term trend is obviously higher (big swings) with the upwards sloping green line acting as decent support. Looking at the monthly chart you can see where price is now trading above this important rising price zone.
SDR’S Select Sector Energy ETF (XLE) daily
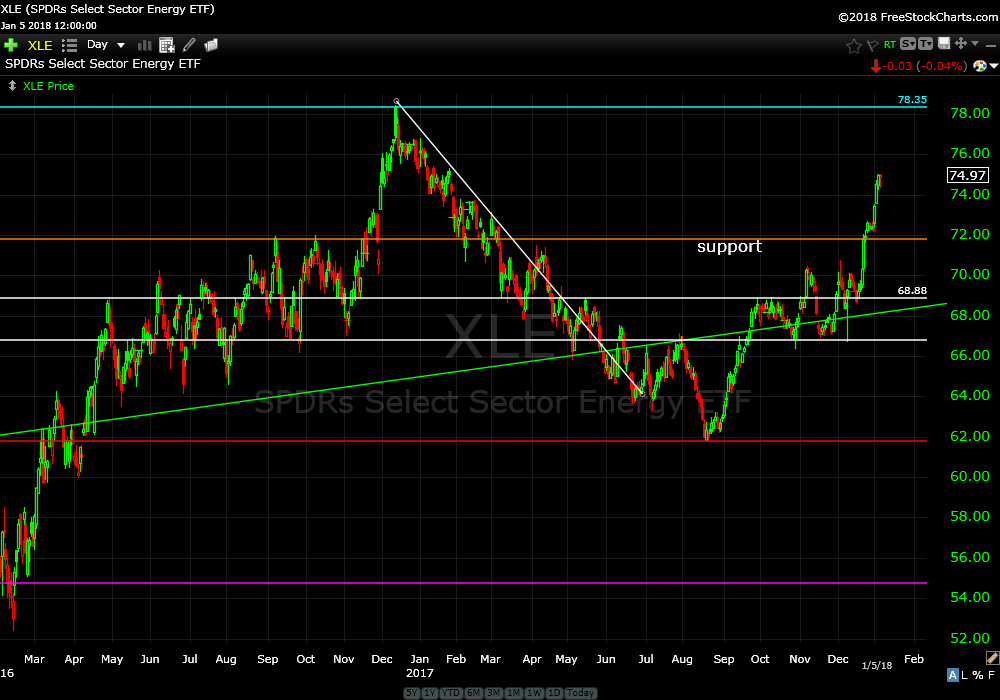
Looking at the daily chart you can see our first support zone, the brown horizontal line which is $71.80. Risk is closing below this price zone. I’m rating this a buy.
These are my best ideas at the current time.
Also, I see no problem adding to open ETF positions. I am.
Trade Smart,
Don