Saturday, August 29, 2020
There sure are lots of takeaways and lessons learned this year but one of the standouts for me is how weak and ineffective many of our institutions can be in serving those that support them. From government “leaders” failing to uphold their mandates of law and order to private companies cowering to mob demands spotlighting how many of our public and private institutions are more interested in protecting themselves than properly serving the people they are designed to serve.
The good news is, at times like this, the flaws are much easier to see. They become more transparent. They become obscenely obvious at times. They make us want better. They create voids that echo loudly and that is where real change can originate. Let’s hope for better days ahead.
I have been a serial entrepreneur my entire life. I haven’t received a “paycheck” since 1981. For some reason, I have always been attracted to doing things “differently”. My mom says, as a little kid, I always used to tell her “by the self” when she would try and help me. I actually think I got it from her because she is always looking for ways to do things more efficiently and we still argue in the car about which route will get us to where we are going faster; there are less stoplights this way..the other way has less traffic..I win because I drive..haha.
The first company I created filled a void within the financial services industry. As an employee of a firm that provided home loans I came to realize that it was difficult for people to figure out which companies provided the type of loan that best suited their needs and at what cost. So, I started one of the first mortgage origination firms in 1981. We offered loan products from many competitive lenders so people could more easily choose what best suited their needs. This cottage industry subsequently grew into $12 billion in revenue simply due to filling a void and creating something better.
I began SmartChartInvestor ten years ago to fill another void. After witnessing first hand the true nature of Wall Street product sales I began questioning many aspects of this industry as well; from asset gathering training, product sales culture, revenue models and research capability. Over time I realized much of it was in the “this could be a lot better” category.
It was so bad one firm asked me not to talk about it. Yeah, right buddy. Most of the consistent emphasis seemed to be about sales, commissions and revenue. I understand the importance of feeding the beast but not at the expense of those who are being served. Hmmm…more government anyone? They train people to be salespersons and how to gather assets but not how to help manage those assets; this important aspect is left to “on the job” training. They prioritize selling proprietary equity products (more revenue) that are not transferable unless sold. Their revenue models create a conflict of interest between serving the client and serving the company. And, they value their traditional and mostly ineffective research advice over proven new research concepts that challenges their way of doing things even though the benefits to the investor are striking.
Institutions, when they become large, tend to resist change. If what they did in the past made them large and successful then it follows that they should continue to do the same in the future in spite of the evidence that might produce even better results for their customer and their firm.
The void I have tried to fill is making investors better equipped to understand these issues and more aware of a layer of analysis that has been commonly misunderstood. In fact, when I began studying technical analysis 35 years ago it was widely thought to be akin to voodoo. Today, we see people on CNBC all day long discussing price action and technical analysis. It’s now mainstream.
What you won’t see on TV or in any research or advisory firm is the type of technical analysis I use. Why? Because it’s not taught anywhere. It isn’t even known to exist by 99.99999% of technical analysts. And, believe it or not, it’s the most accurate forecasting method I have ever seen.
My goal remains the same: to share what I have learned from deep subset historical price data analysis and how the repetitive characteristics of equity and debt instruments can be leveraged to enhance returns.
Broader Market Update
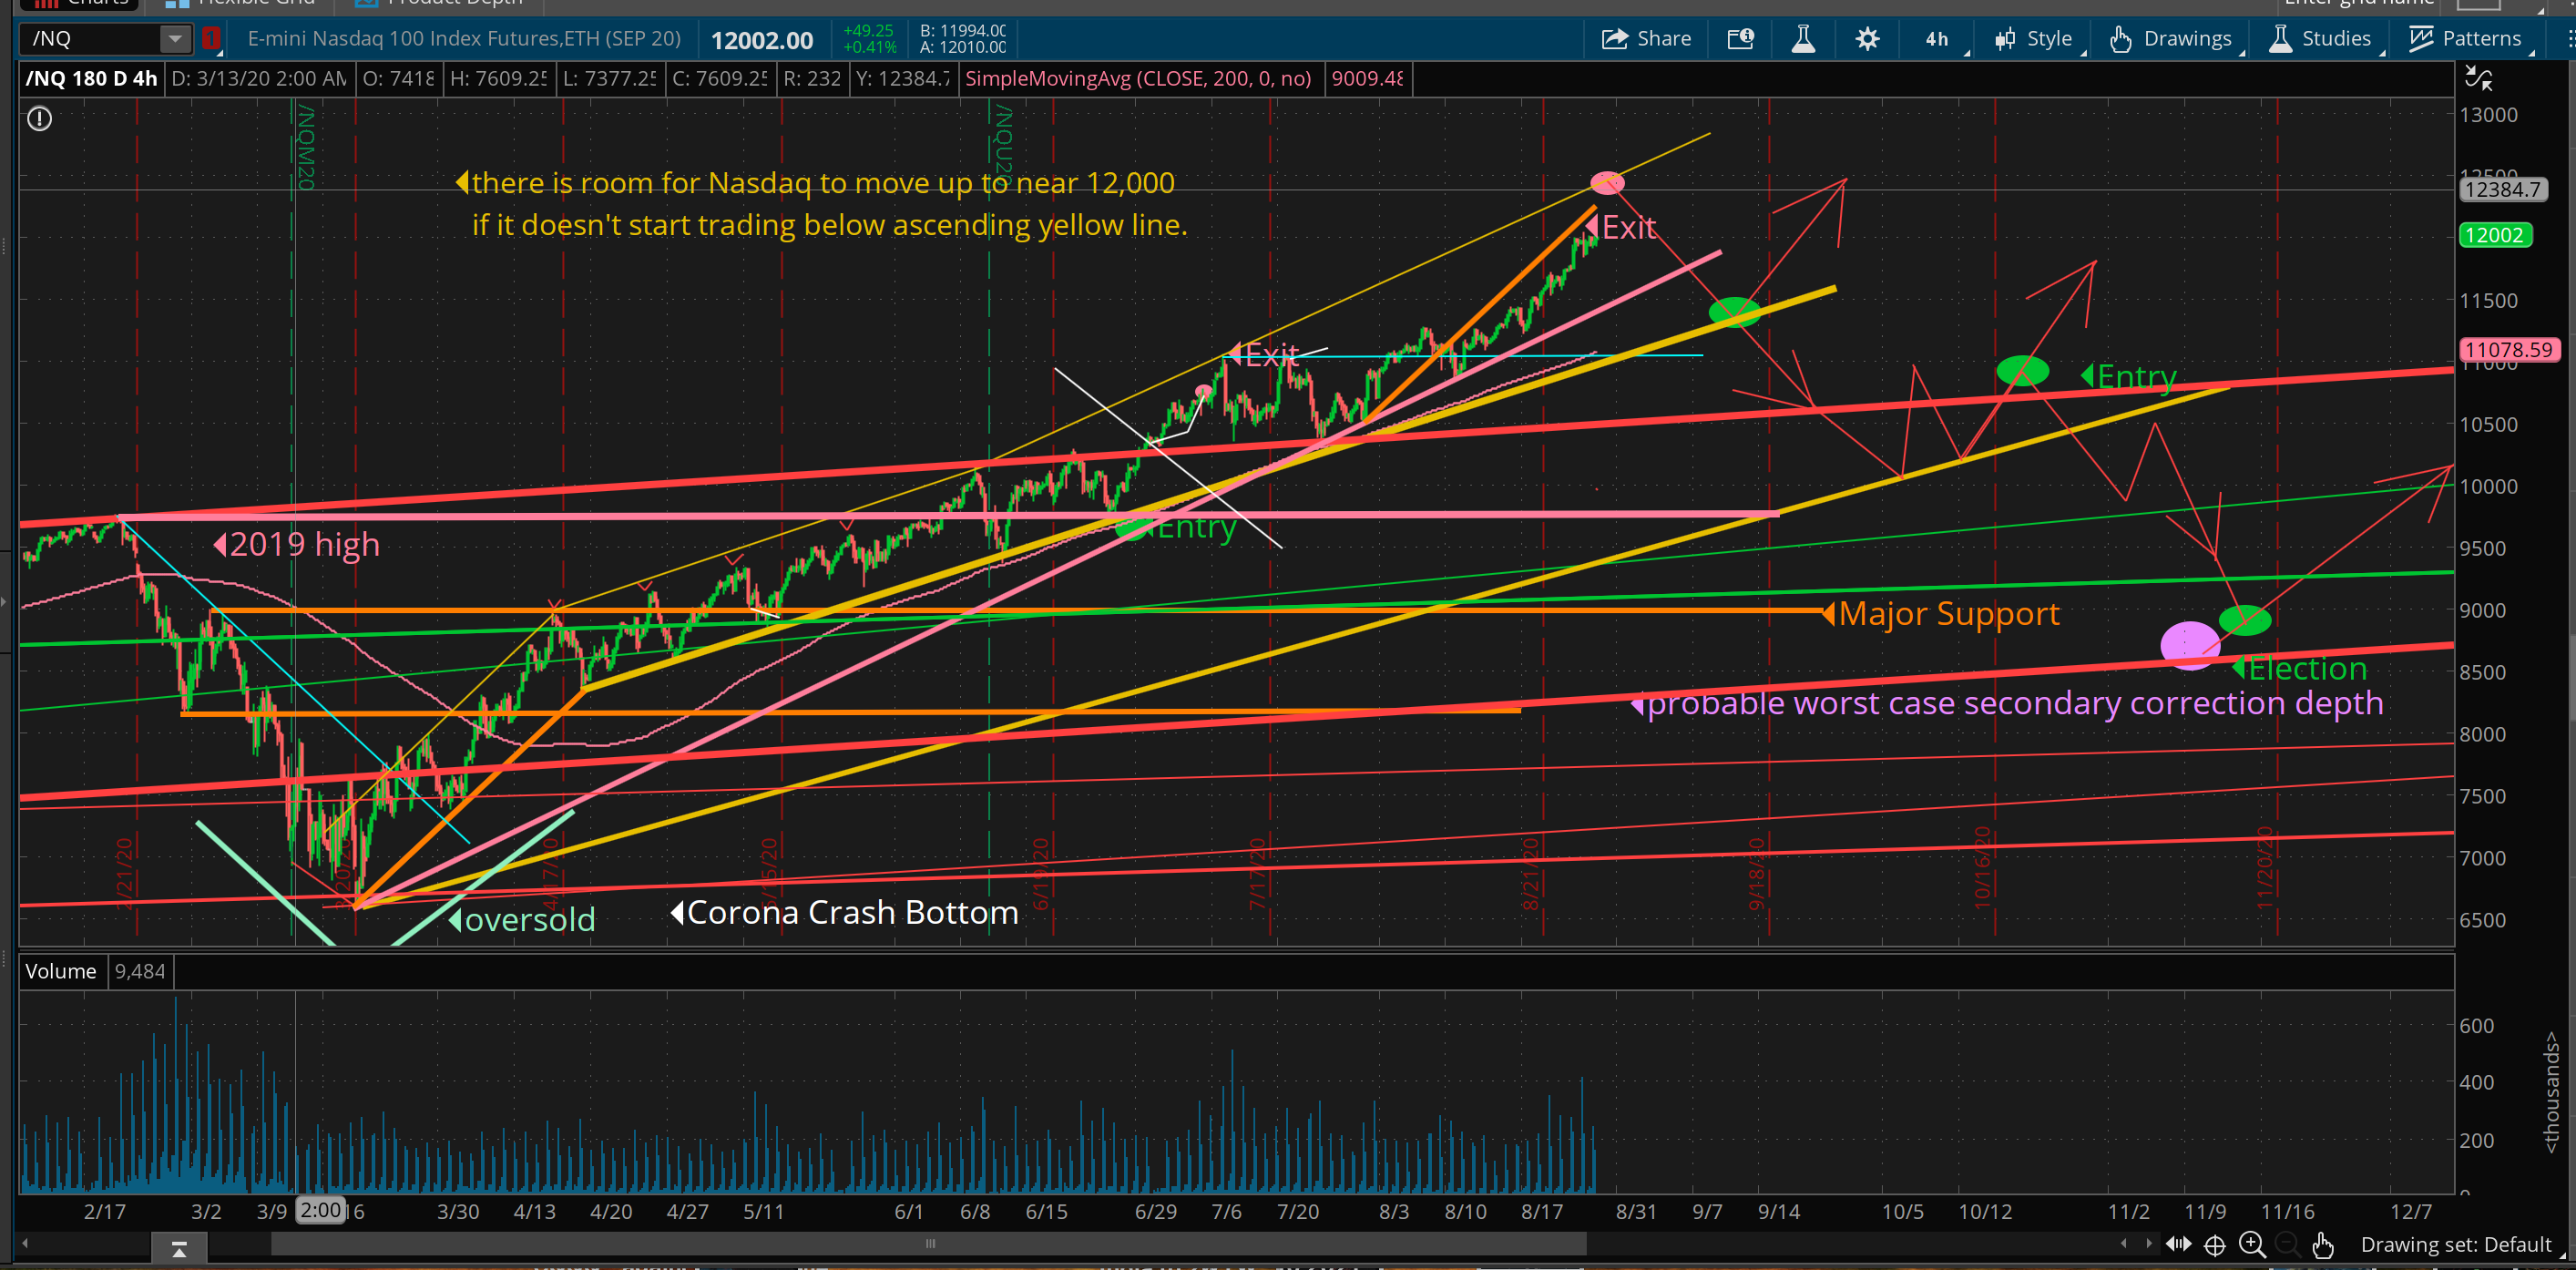
I wrote a few weeks ago that Nasdaq had room to fill the gap up to 12,000. We are now there and I wouldn’t be surprised to see a final push to 12,458 before a potential leg down. I remain cautious at current levels and have only added three new positions over the past few weeks; TSLA, SPCE and DKNG.
Be aware that a leg down to ascending support that has been driving the Nasdaq higher since early April is now 6% below current levels. So, even a 6% drop in price would not invalidate the recovery but would very well be another good risk/reward entry point. We look to these lower entries to capitalize on support zones that historically provide important inflection points where reversals are likely to occur.
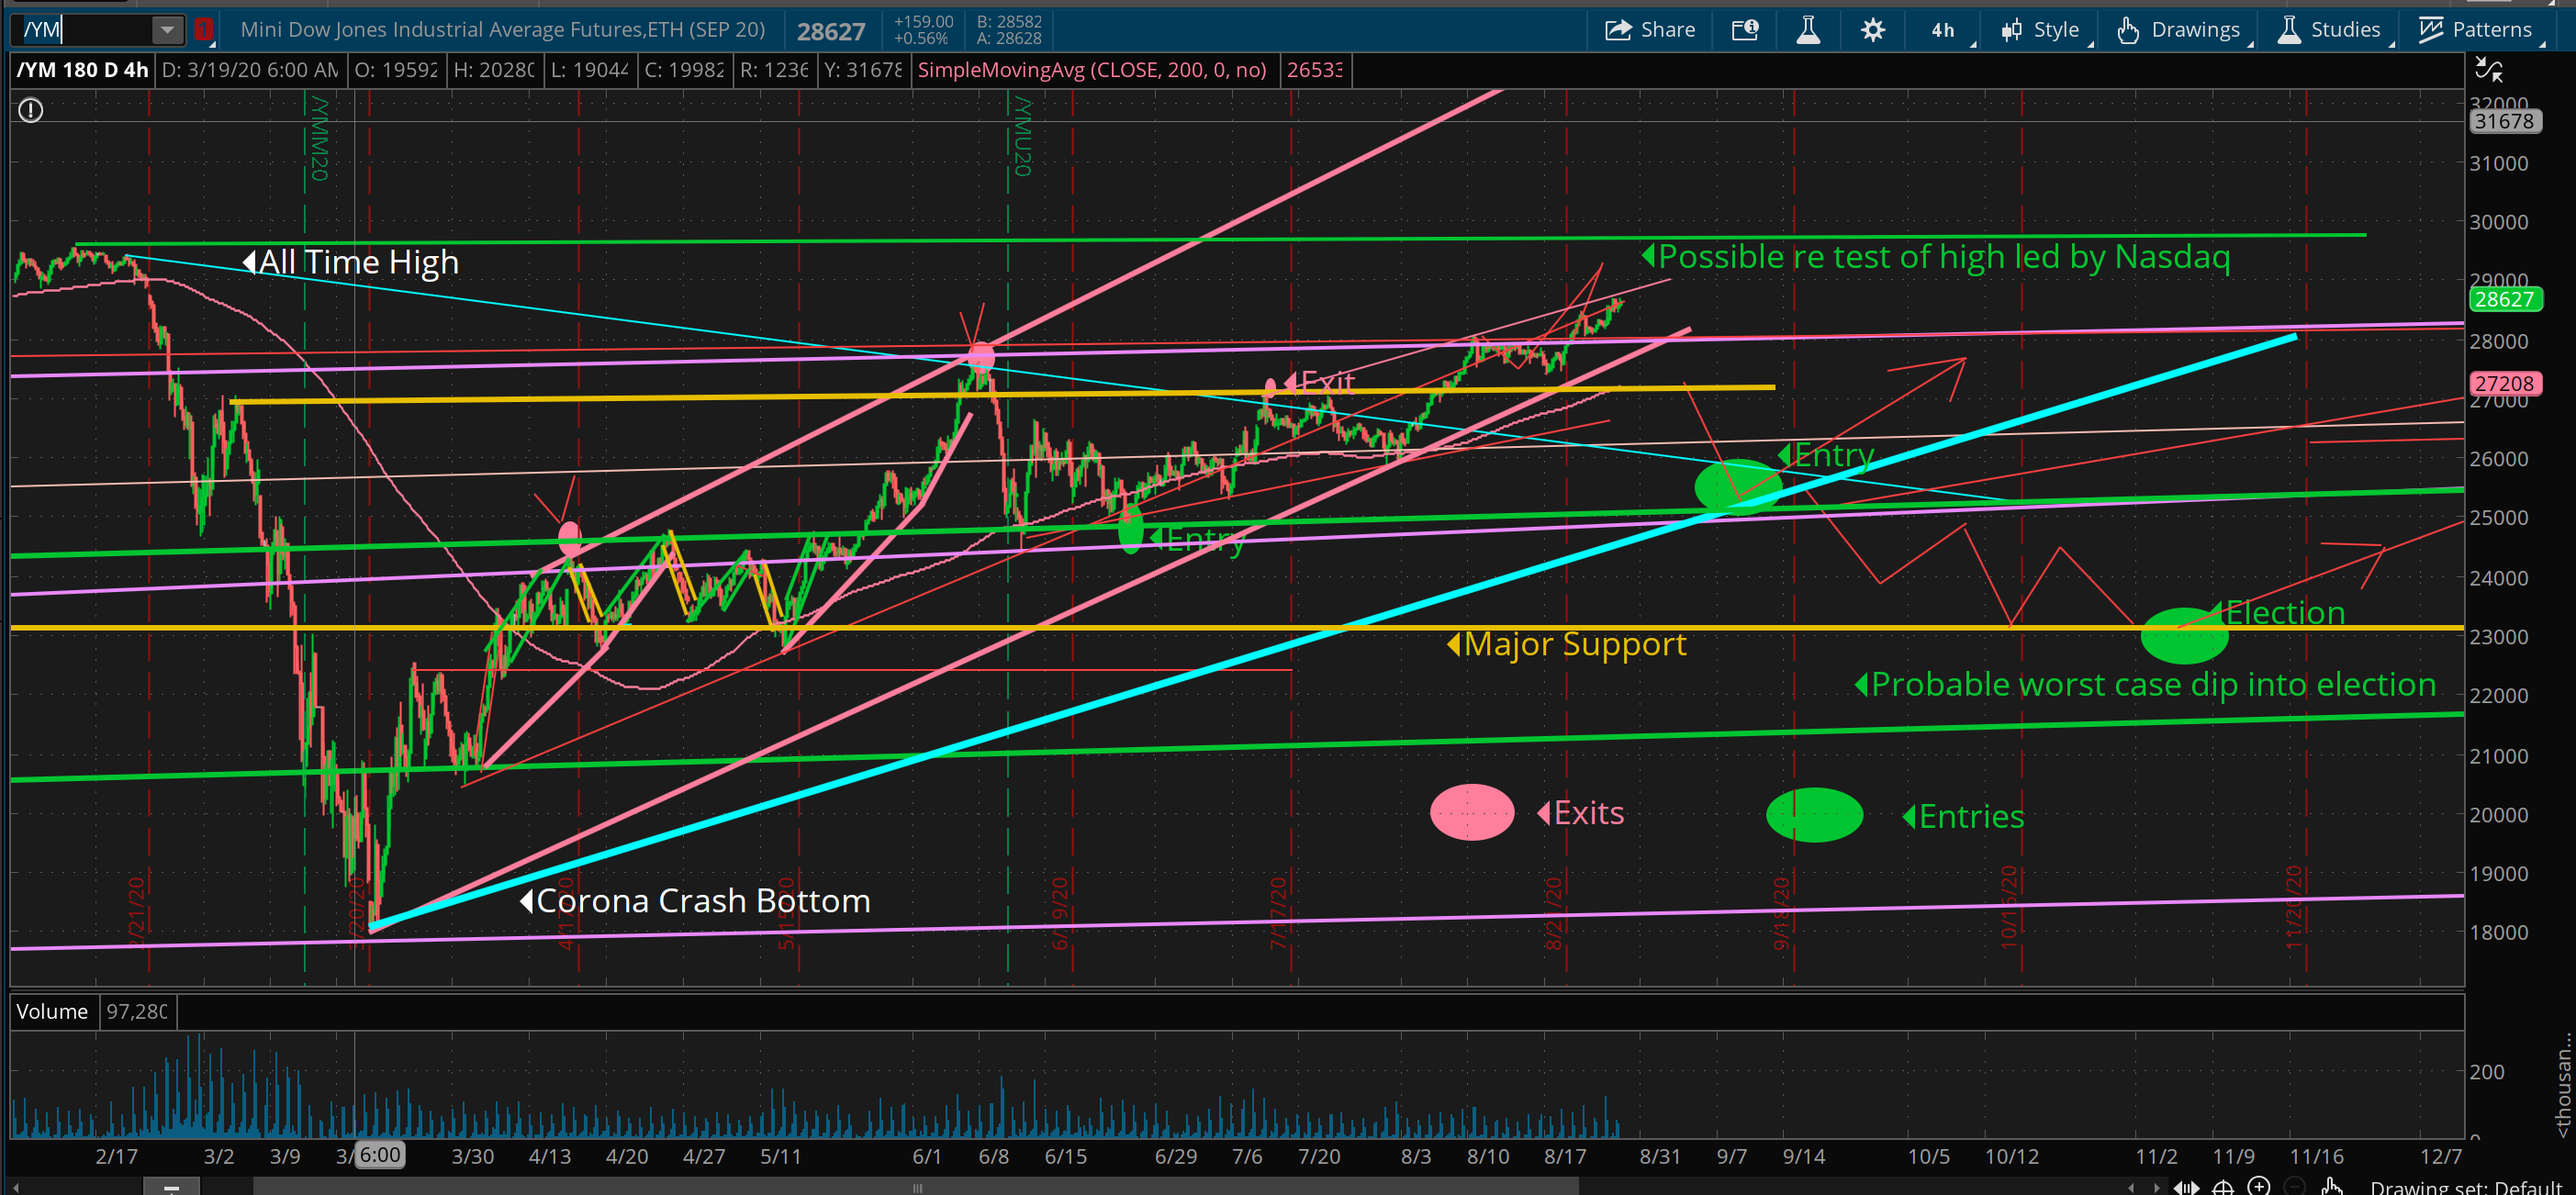
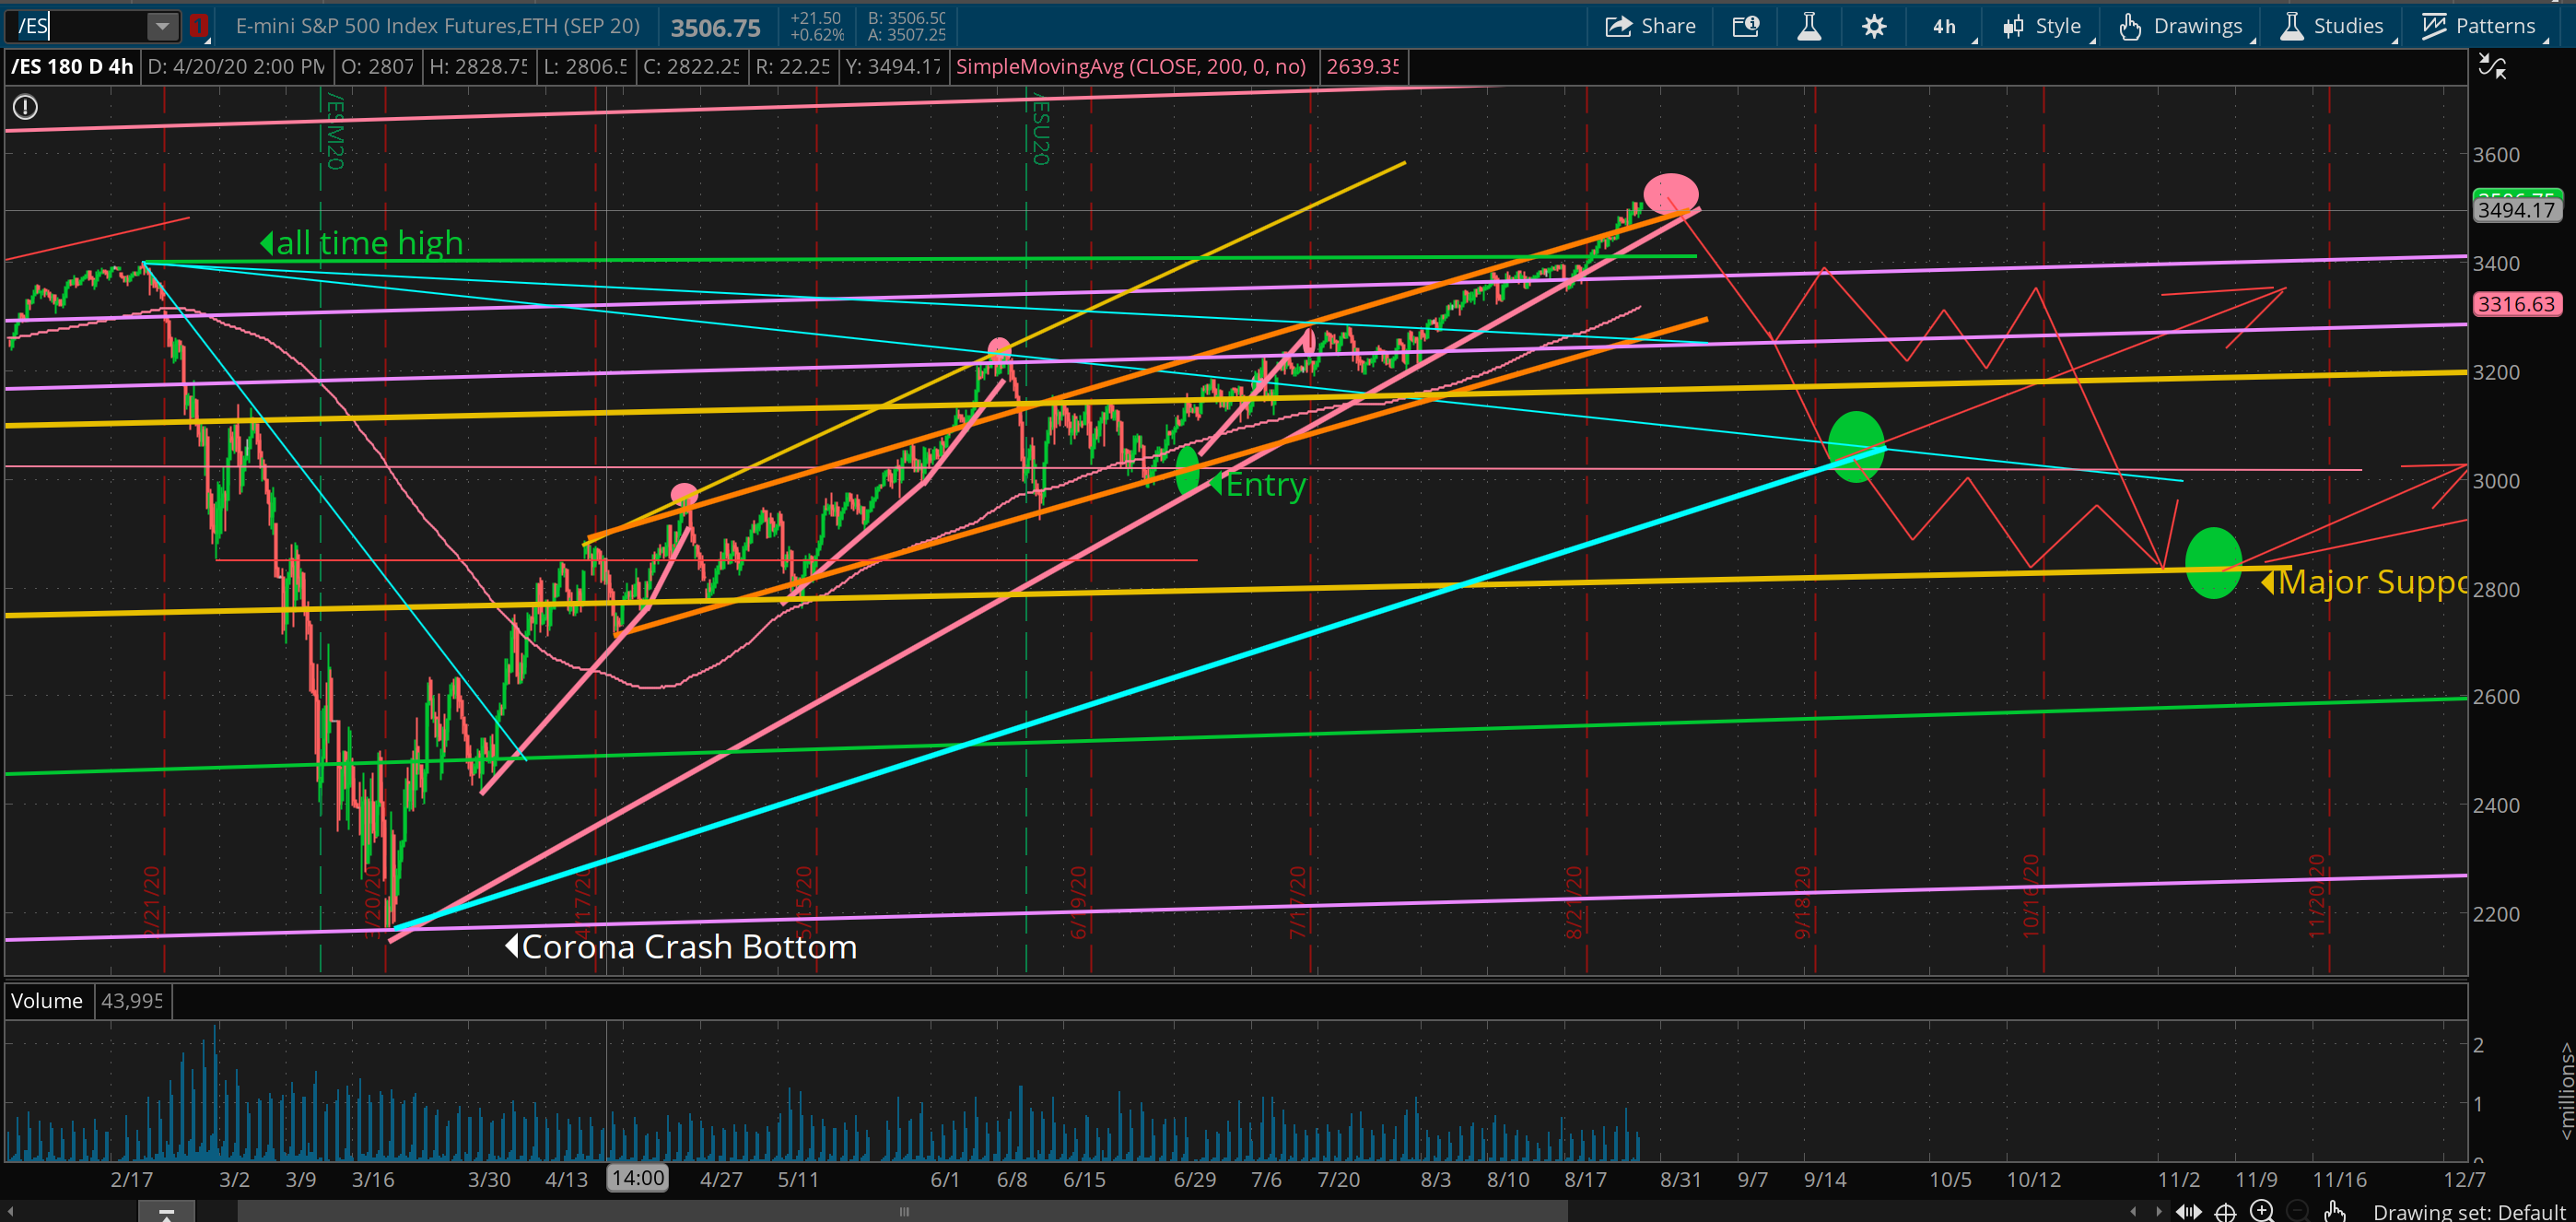
See the charts for support and resistance levels, forecasts and projected entry and exit levels. Remember, when the broader markets are at major inflection reversal levels we are looking for positioning and alignment in individual stocks to maximize our returns. You can find my favorite individual stocks and ETF’s in the recent archived Weekly Commentaries. It is from this list that we will be looking for positioning and alignment with the broader market. You can find current open positions on the Trade Alert page.
Nasdaq
Dow
S&P 500
The three recent trades I have shared are TSLA, SPCE and DKNG.
TSLA
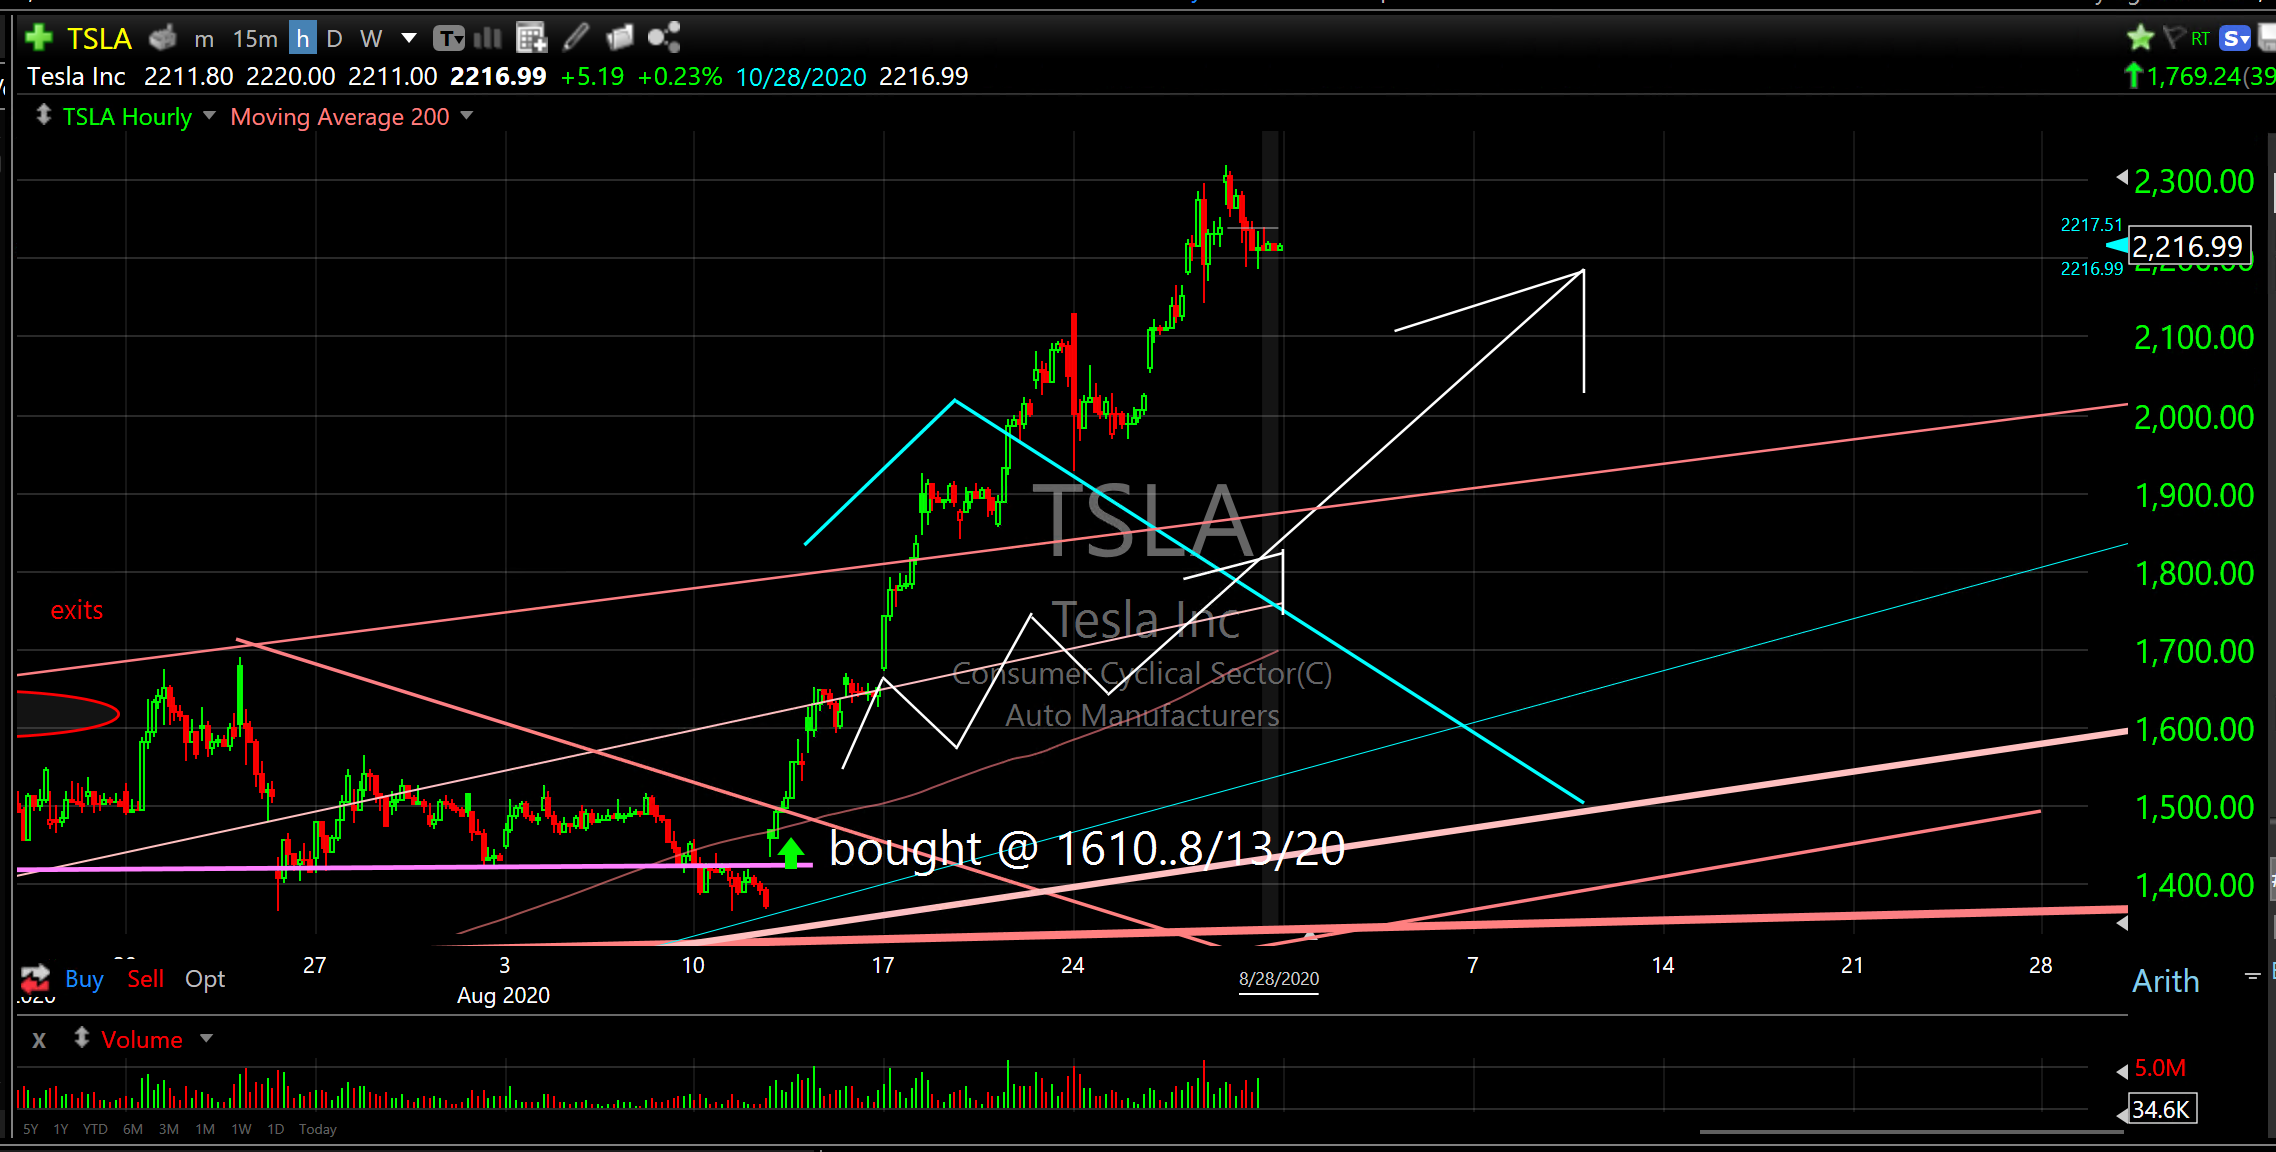
TSLA is up 38% from when I bought it and notified you on August 13th, two weeks ago. The 5/1 stock split was effective on Friday.
SPCE
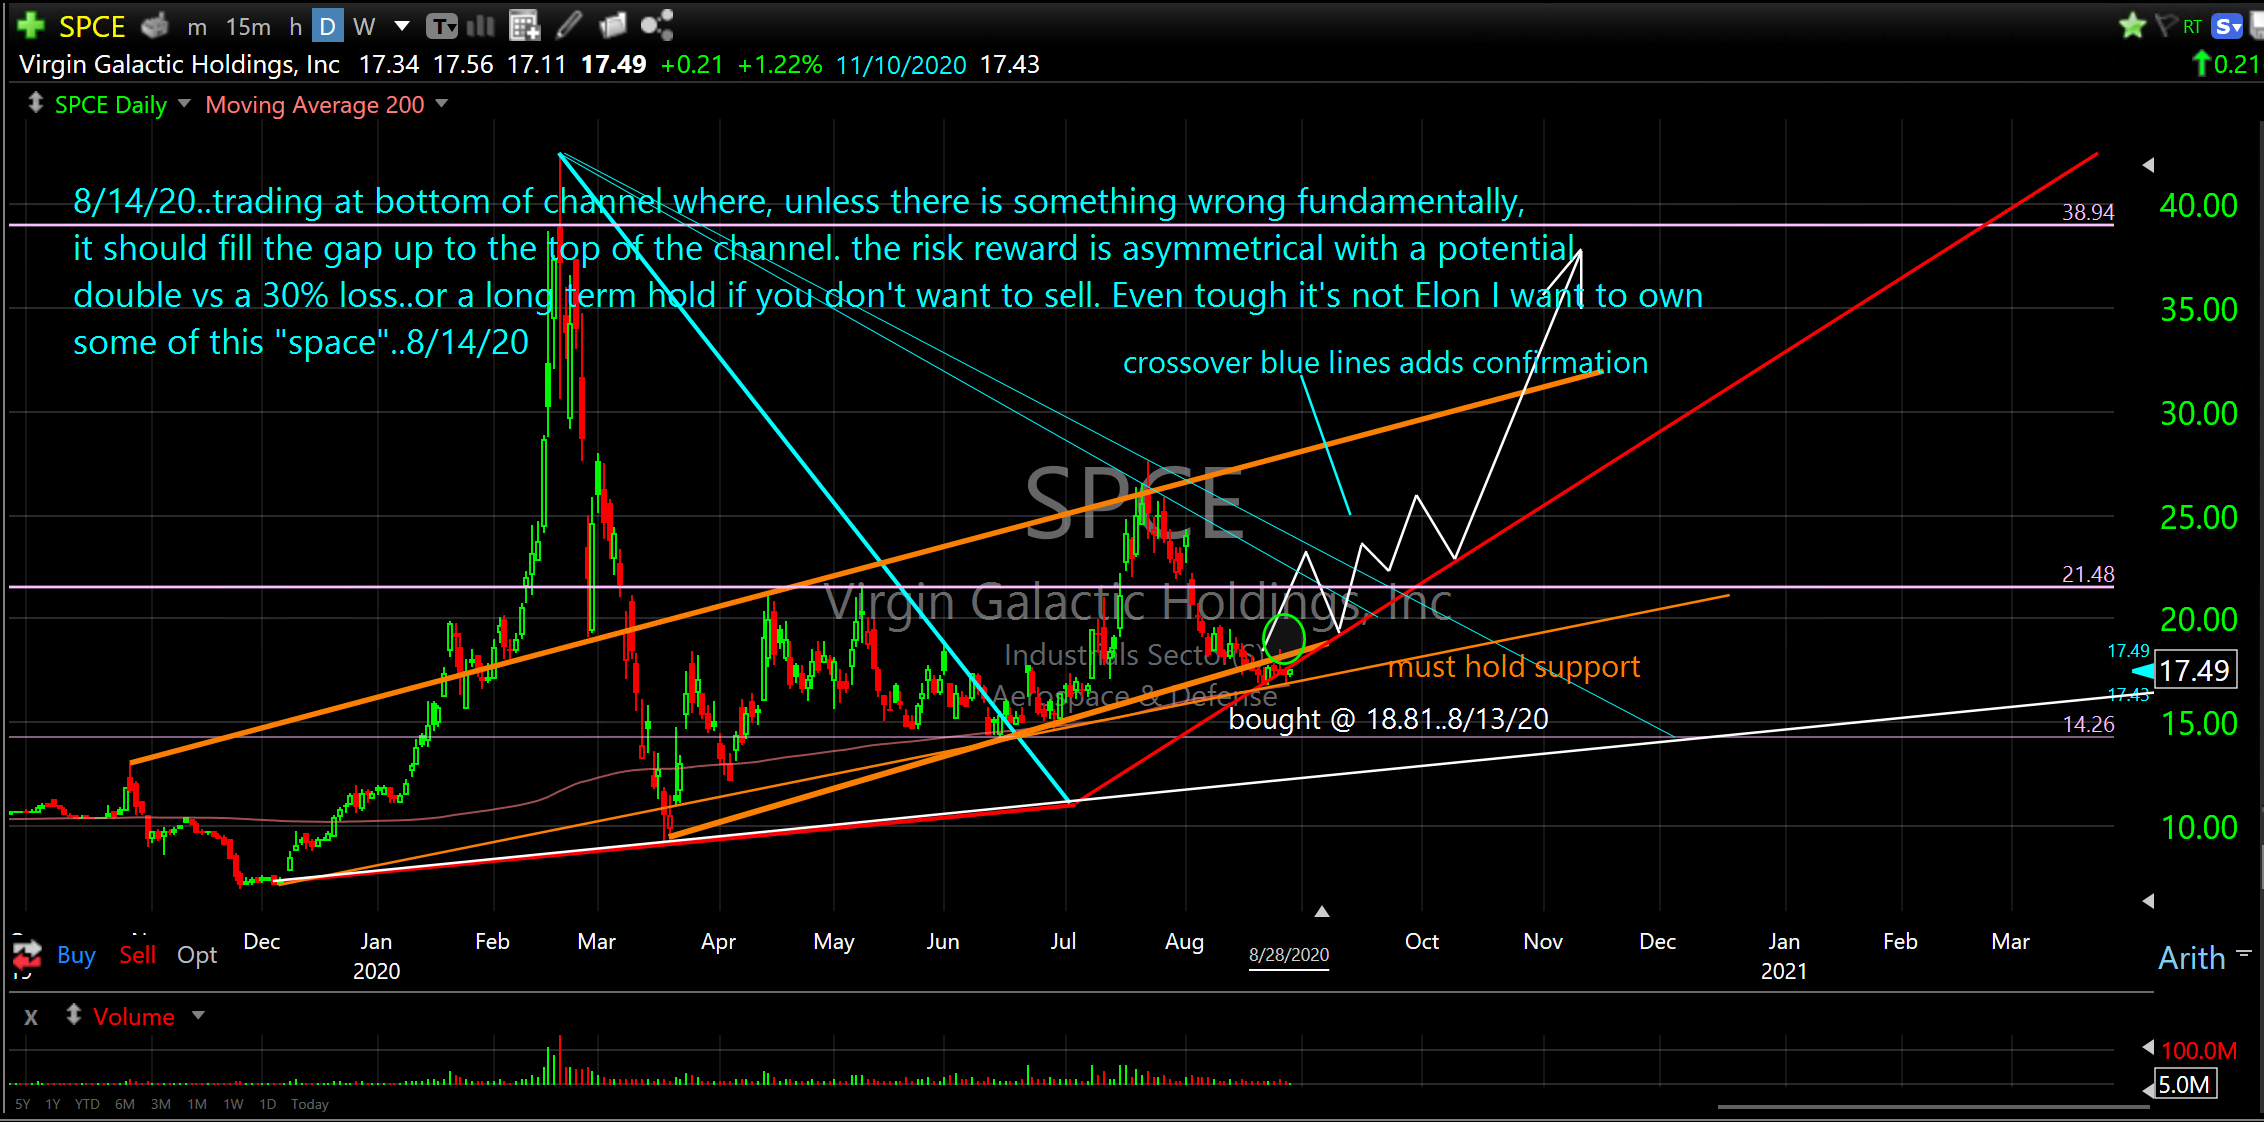
SPCE is still above support and is trading above the bottom of the channel. It may need to drift down into the green circle but I doubt it needs to go that low considering it was oversold during the Corona Crash.
DKNG
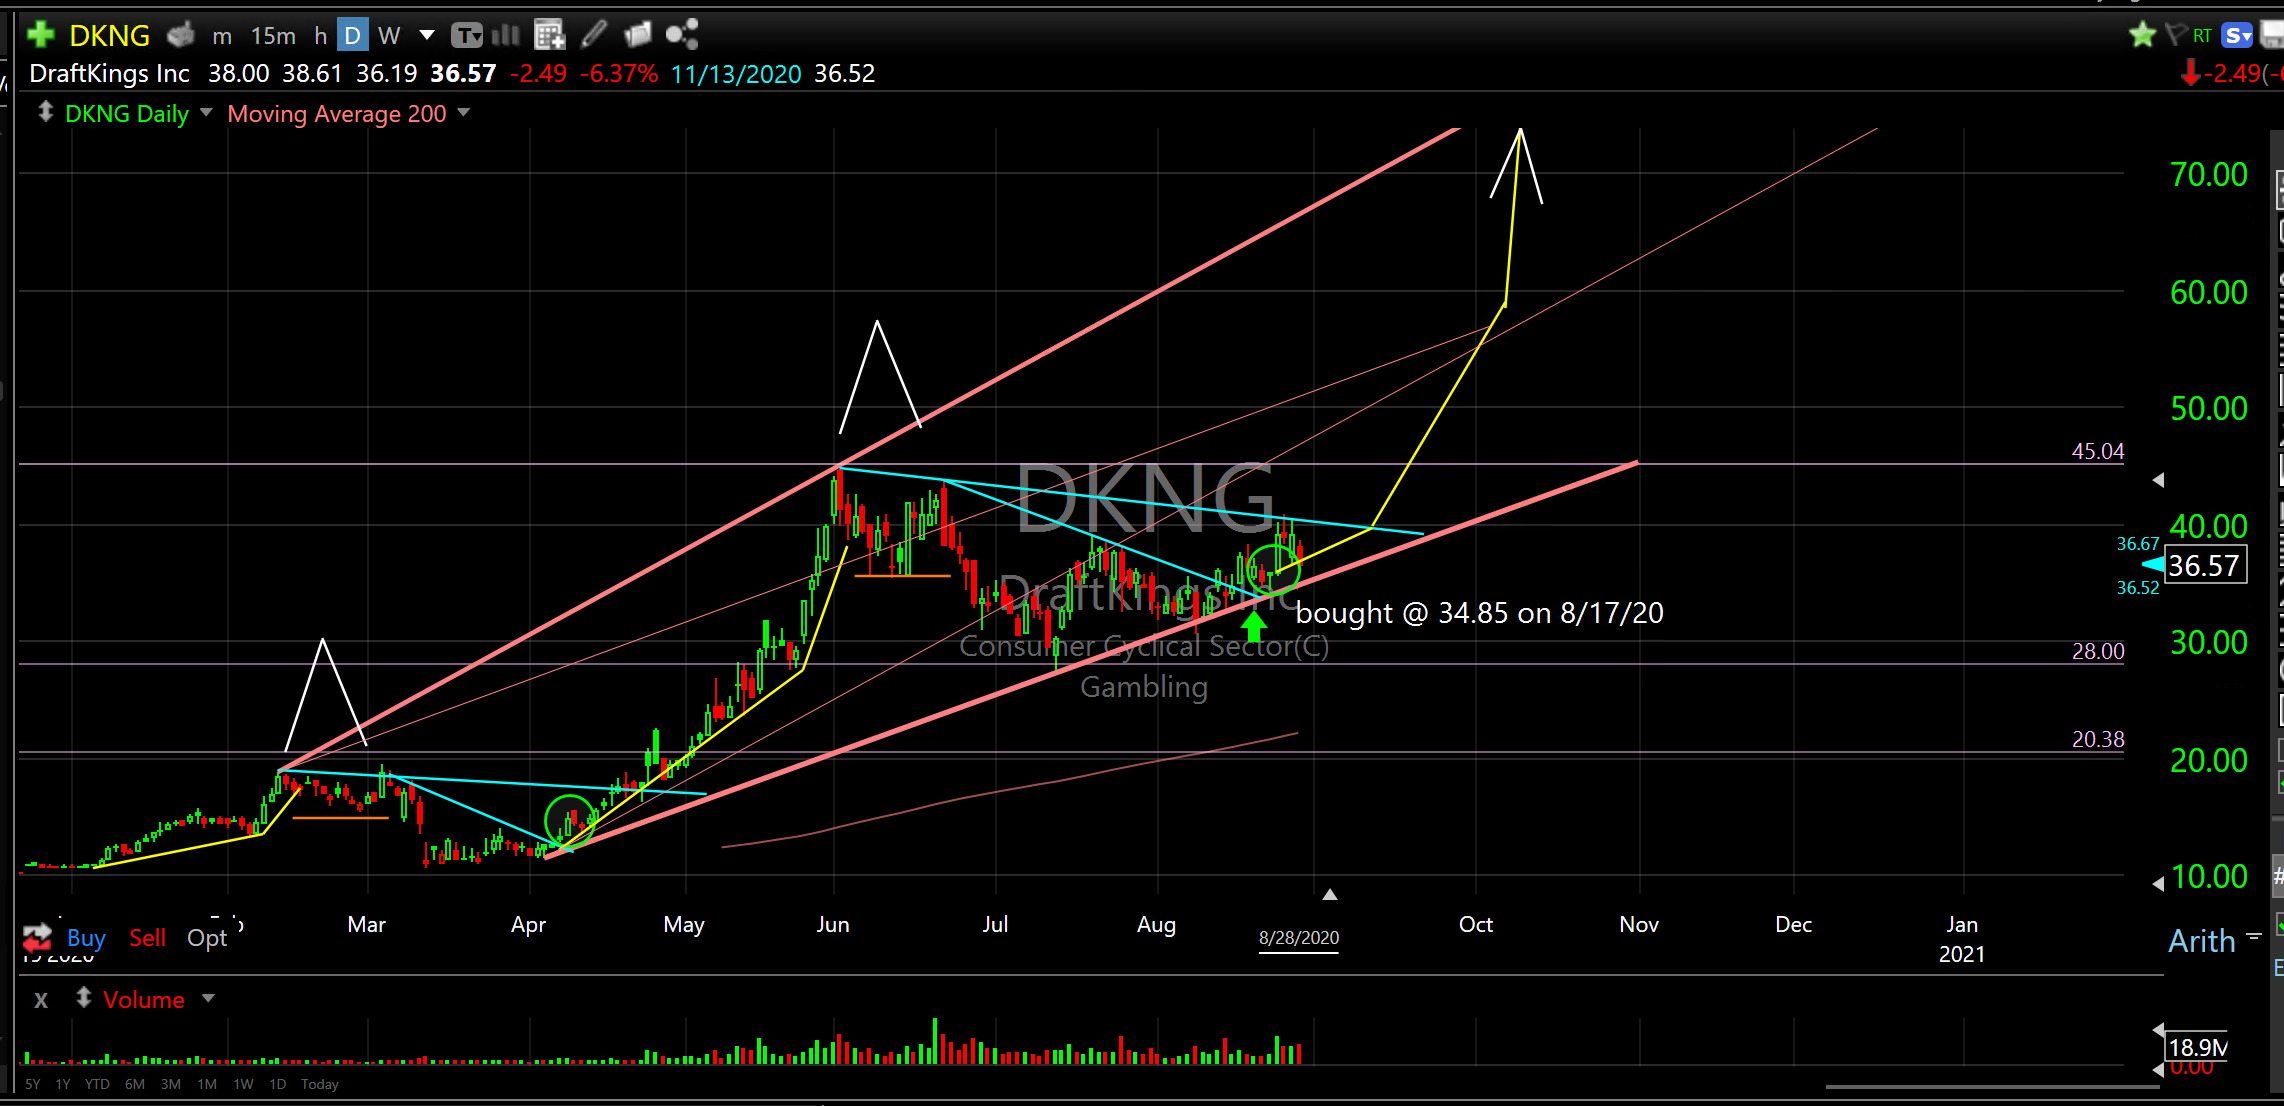
DKNG is right where it should be in its pattern. Once it crosses over the blue line above it should move to its previous high and then ramp higher from there. If it breaks below ascending support (pink line) that would be a sell signal.
ULTA
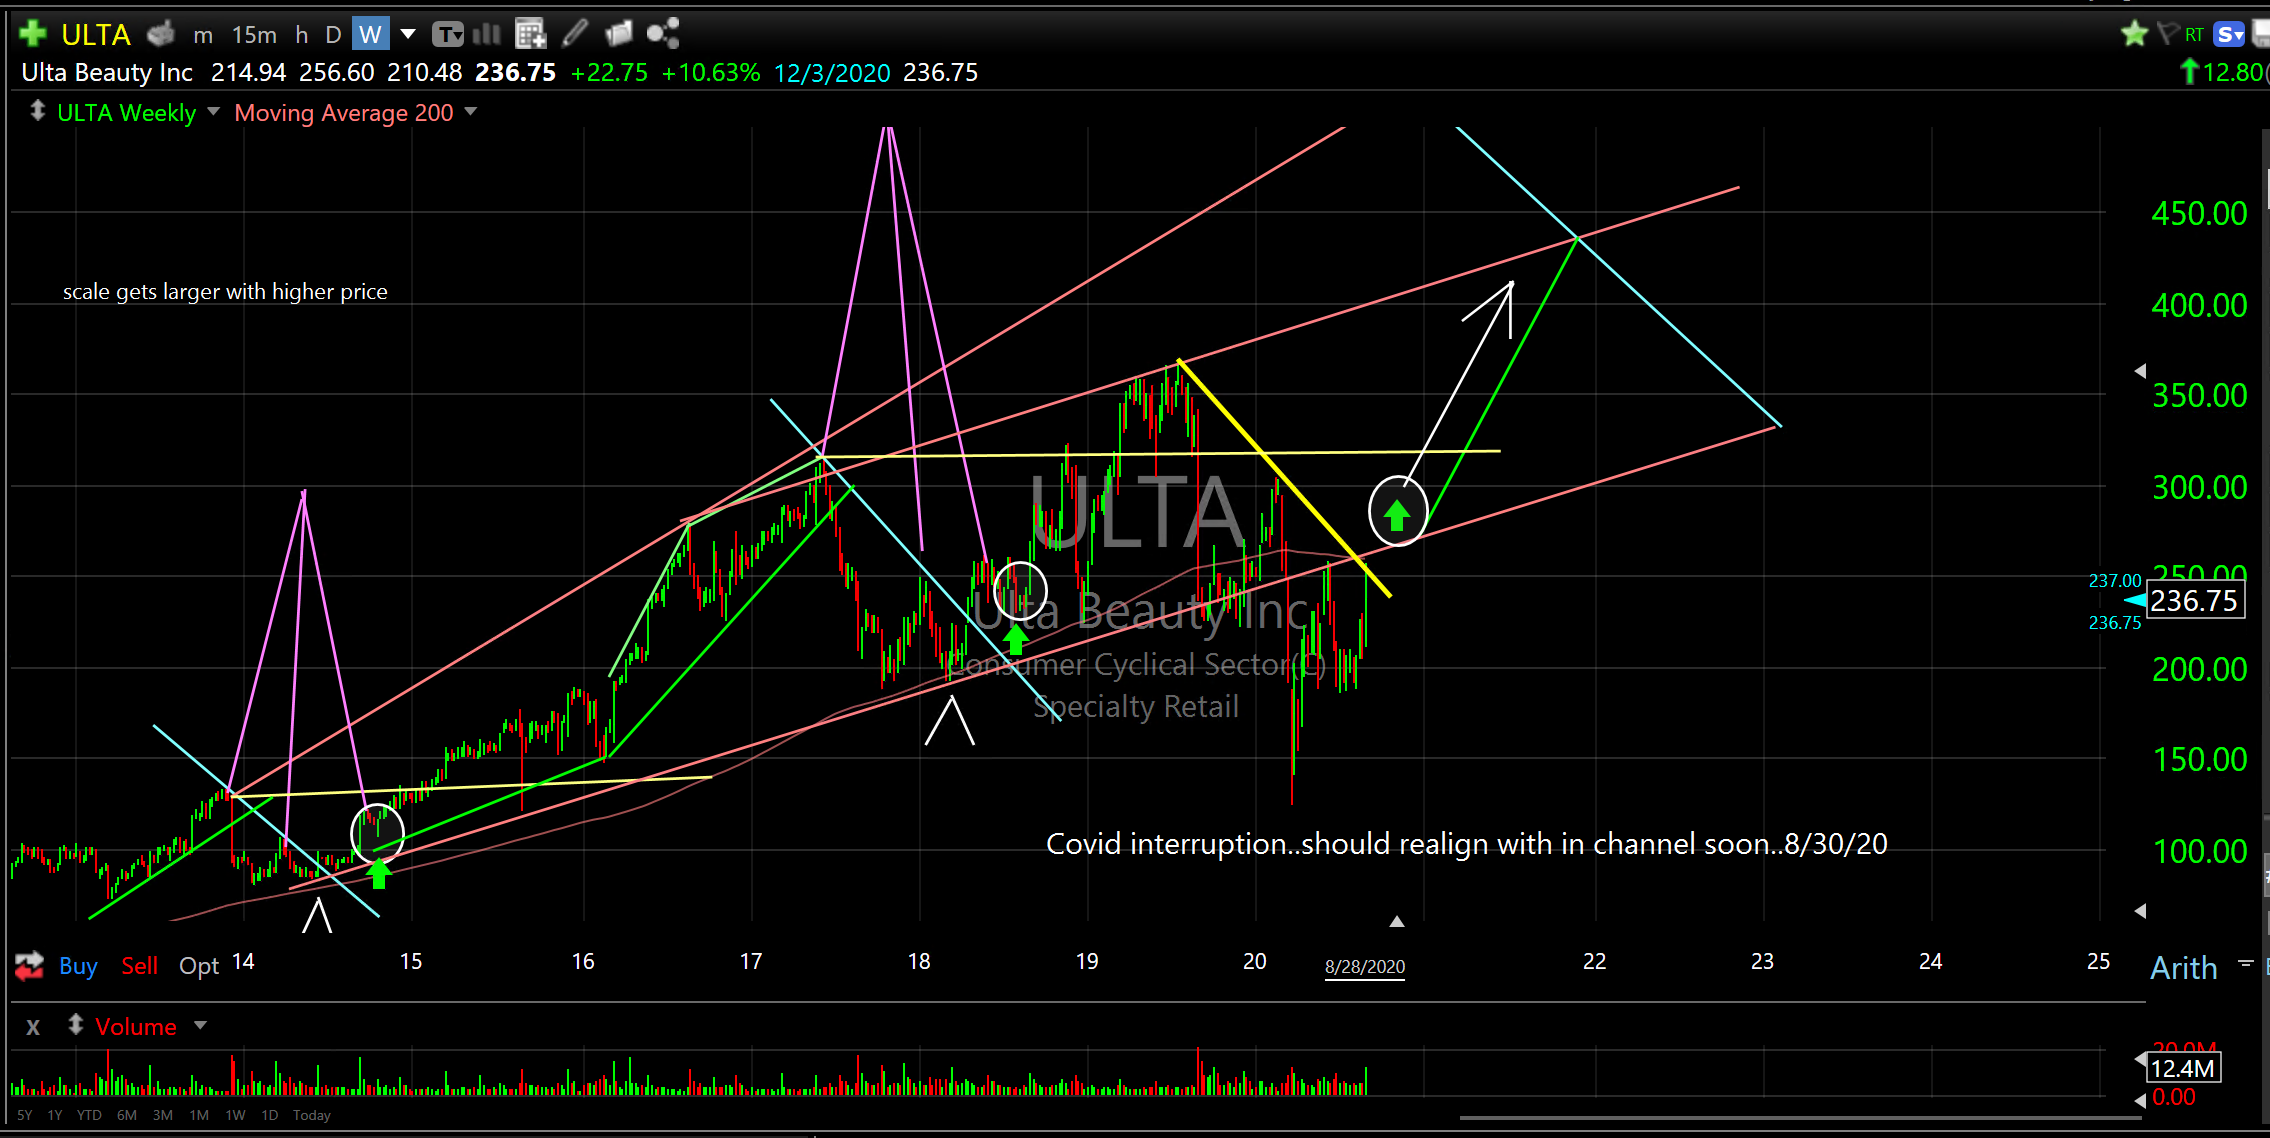
ULTA is looking interesting. I’m adding it to my watchlist. If it can cross over above resistance and move into the green arrow circle it will likely move up towards $400. Keep an eye on it.
If you have any questions I would be happy to respond.
Be safe and have a wonderful week,
Don