Saturday, September 12, 2011
Some thoughts..
If it wasn’t for the fact that markets sometimes collapse and we can often measure when and where I wouldn’t have much to do except for the other stuff I do.
Price history is the only thing we know for a fact to be true. The rest is just noise with little correlation to price. That’s why it’s so difficult for people to outperform the market.
The absolute best we have in forecasting future price action is to understand and identify the patterns that keep repeating throughout thousands of years of historical price data. It’s there for all to see but most don’t even know to look.
Of course we can’t predict the future but we can often forecast exactly what will happen. And, from that we can understand what our risk and reward is likely to look like and from that we can make better decisions on positioning our exposure.
I use broader market price forecasts to adjust and regulate risk and reward in my portfolio. I use the forecasts on sectors and subsectors to help identify individual stocks that are likely to mirror the broader market but with much higher amplification.
On a pragmatic level this helps me decide what to buy, when to buy it, when to sell it and try to significantly outperform the broader market with less risk than a traditional buy and hope “strategy”..more like “Way Beyond Buy and Hold”.
Broader Market Review
In my July 5th weekly commentary I shared that I was beginning to reduce equity exposure by trimming positions anticipating some kind of secondary collapse/contraction going into the election. It was at this time I began forecasting and showing what the secondary collapse might actually look like.
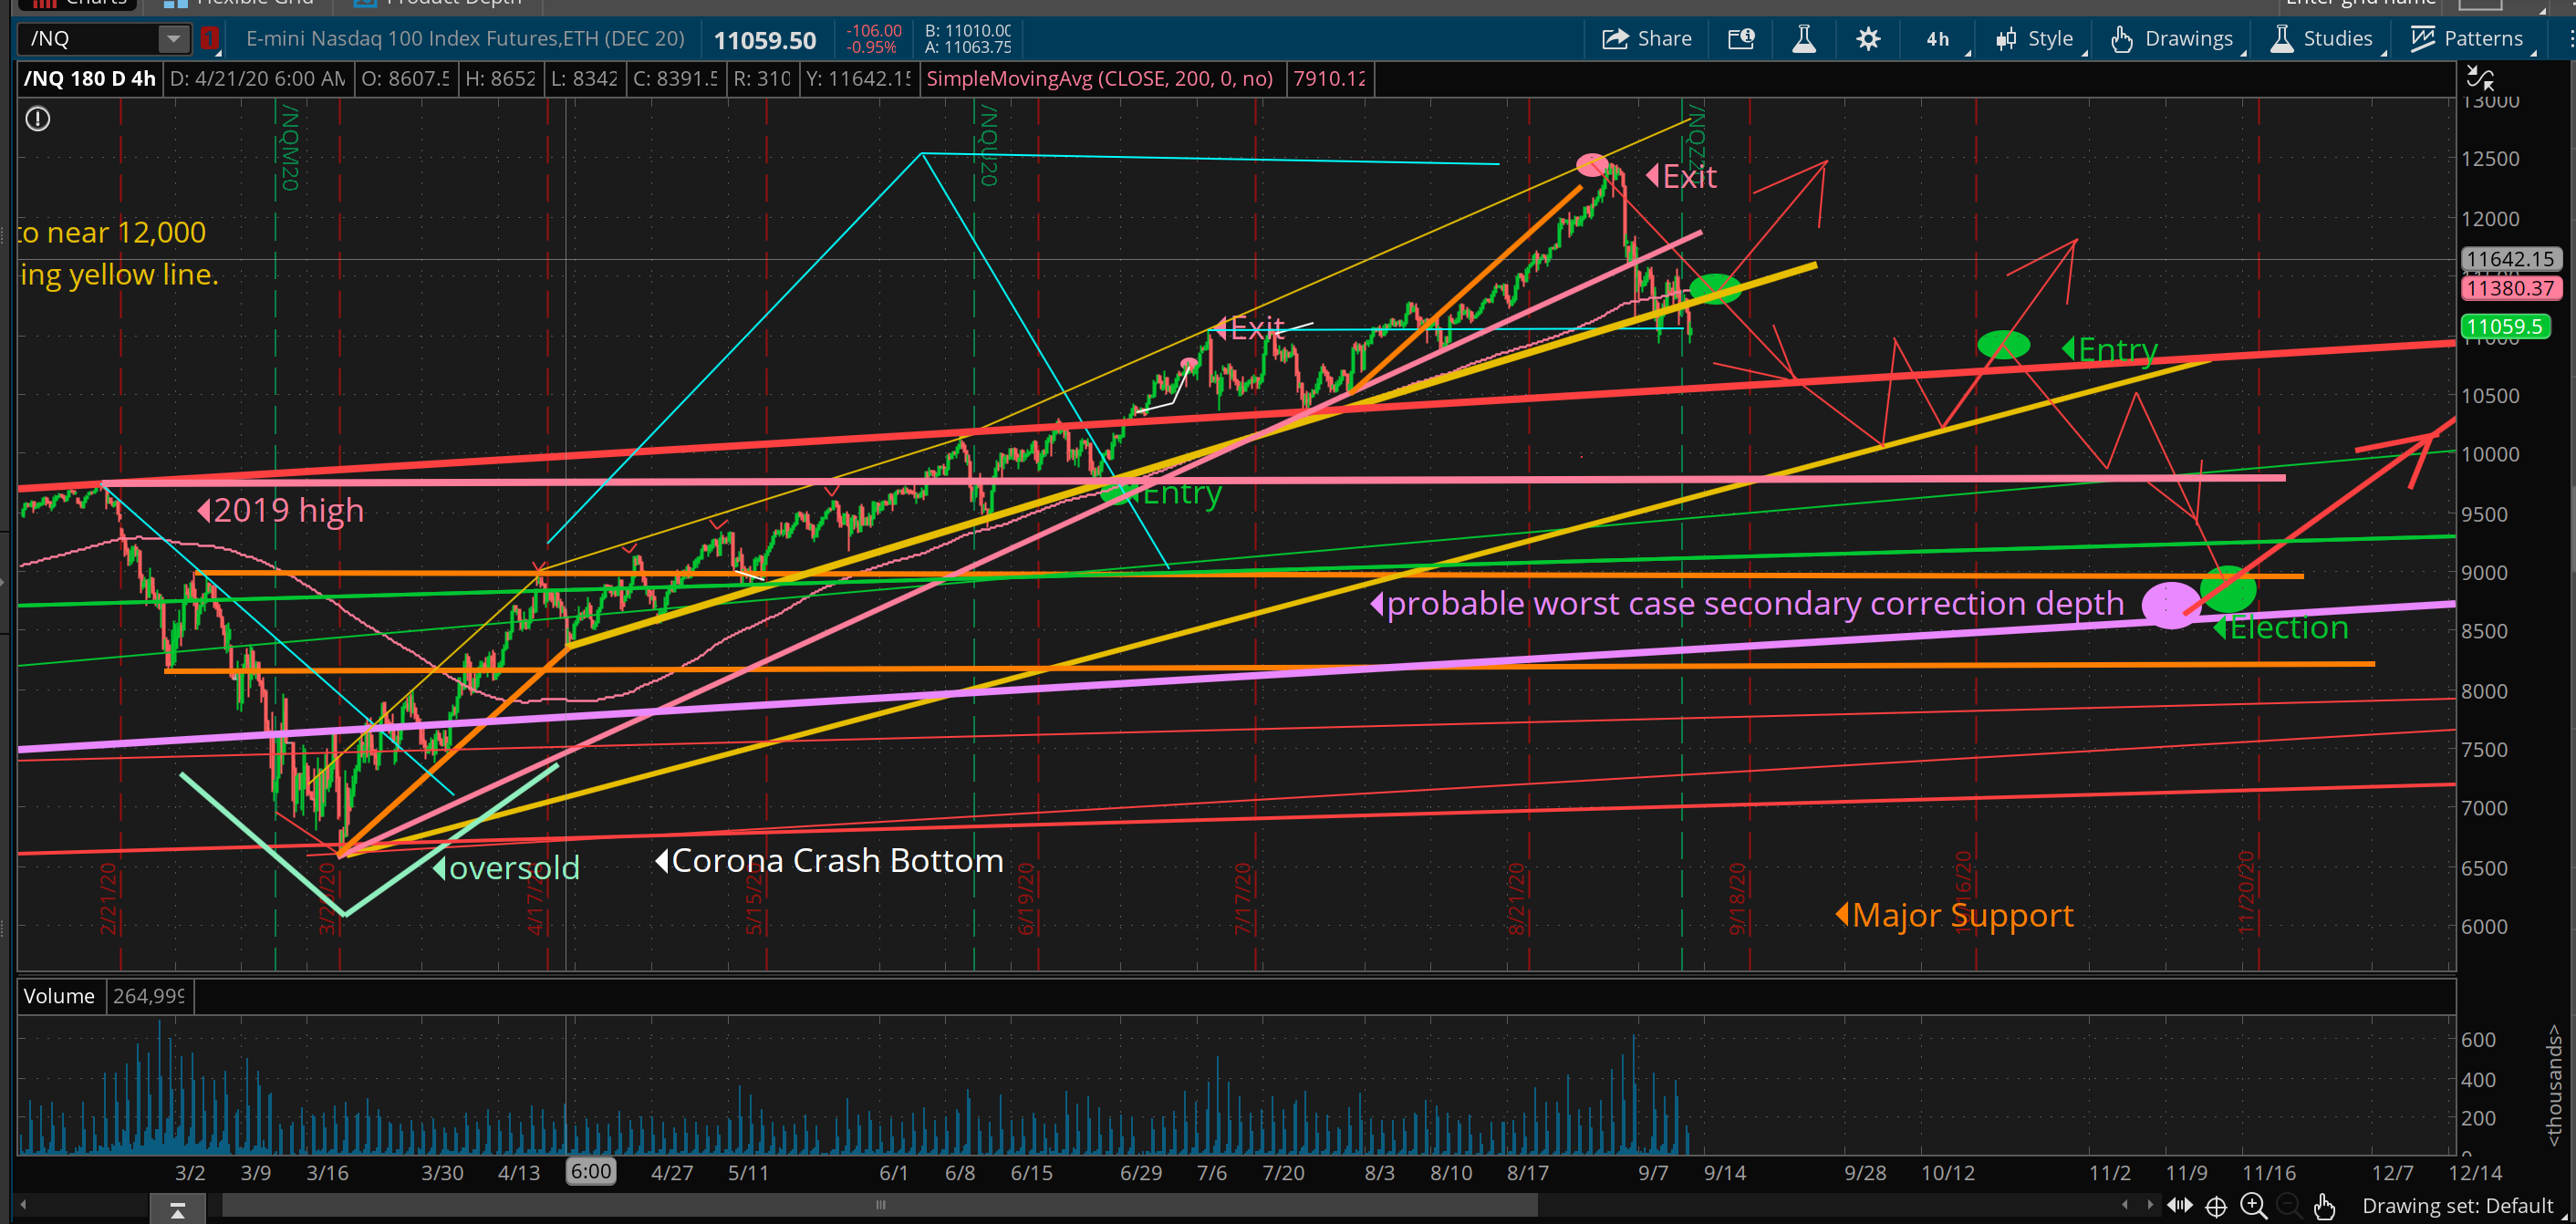
Initially, on July 13th, the forecast was for the secondary collapse to begin on August 3rd at or near Nasdaq 11,000, however, as we collected and measured additional data we pushed the decline to begin in early September closer to 12,400. It began on September 3rd at 12,450.
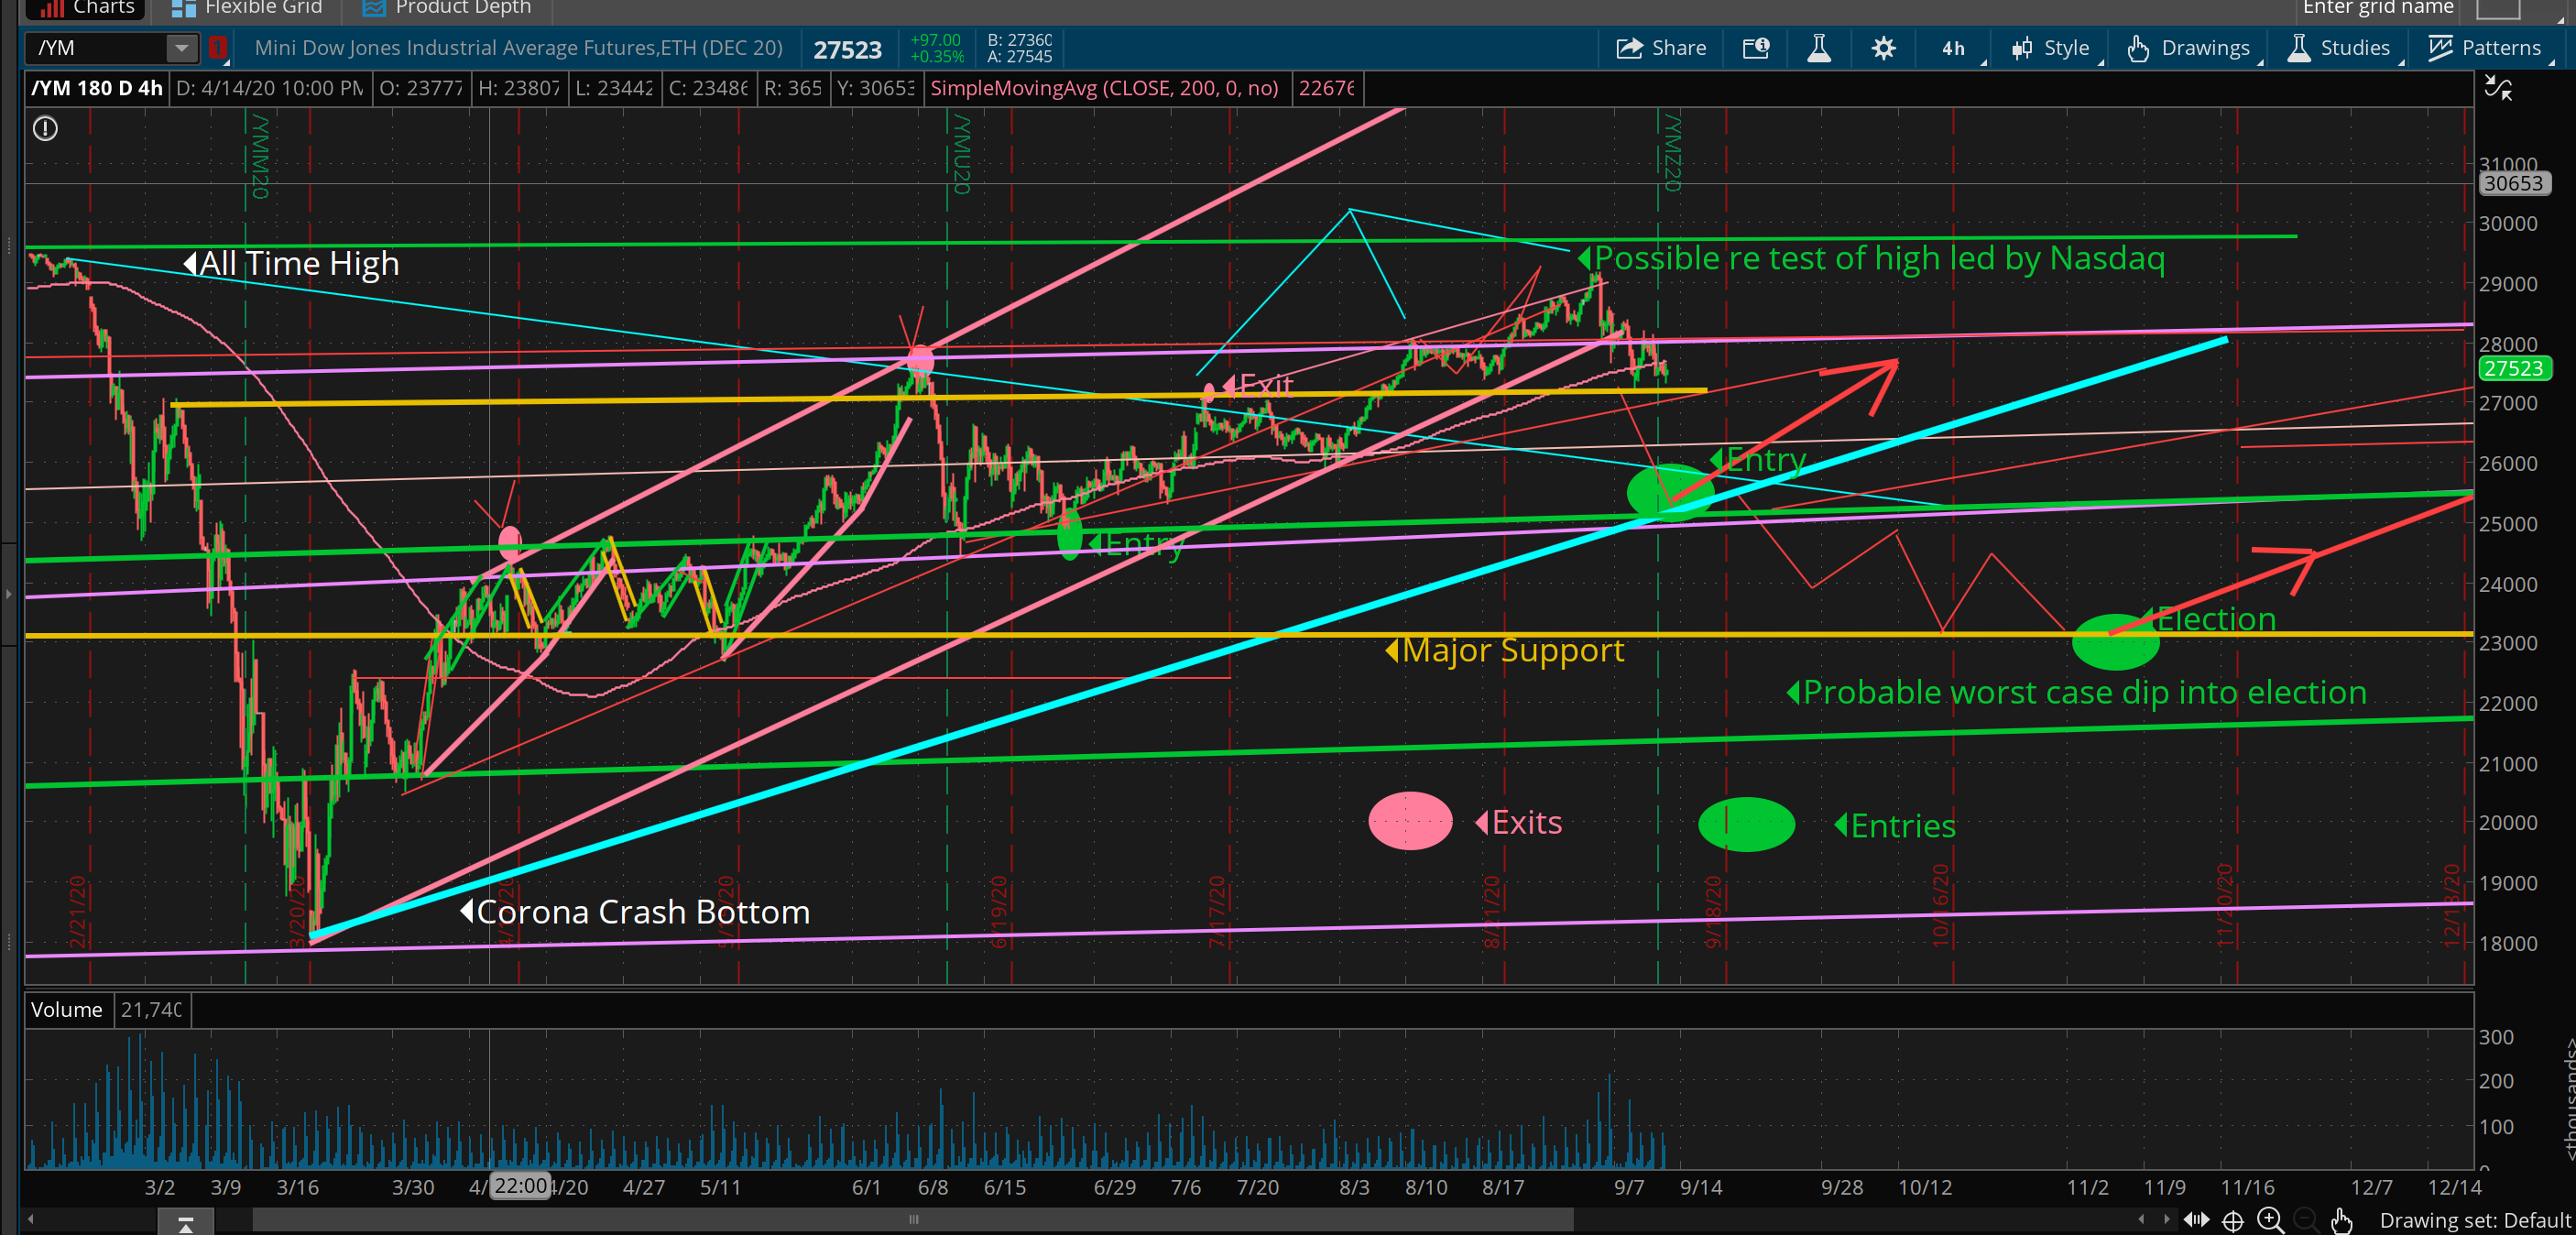
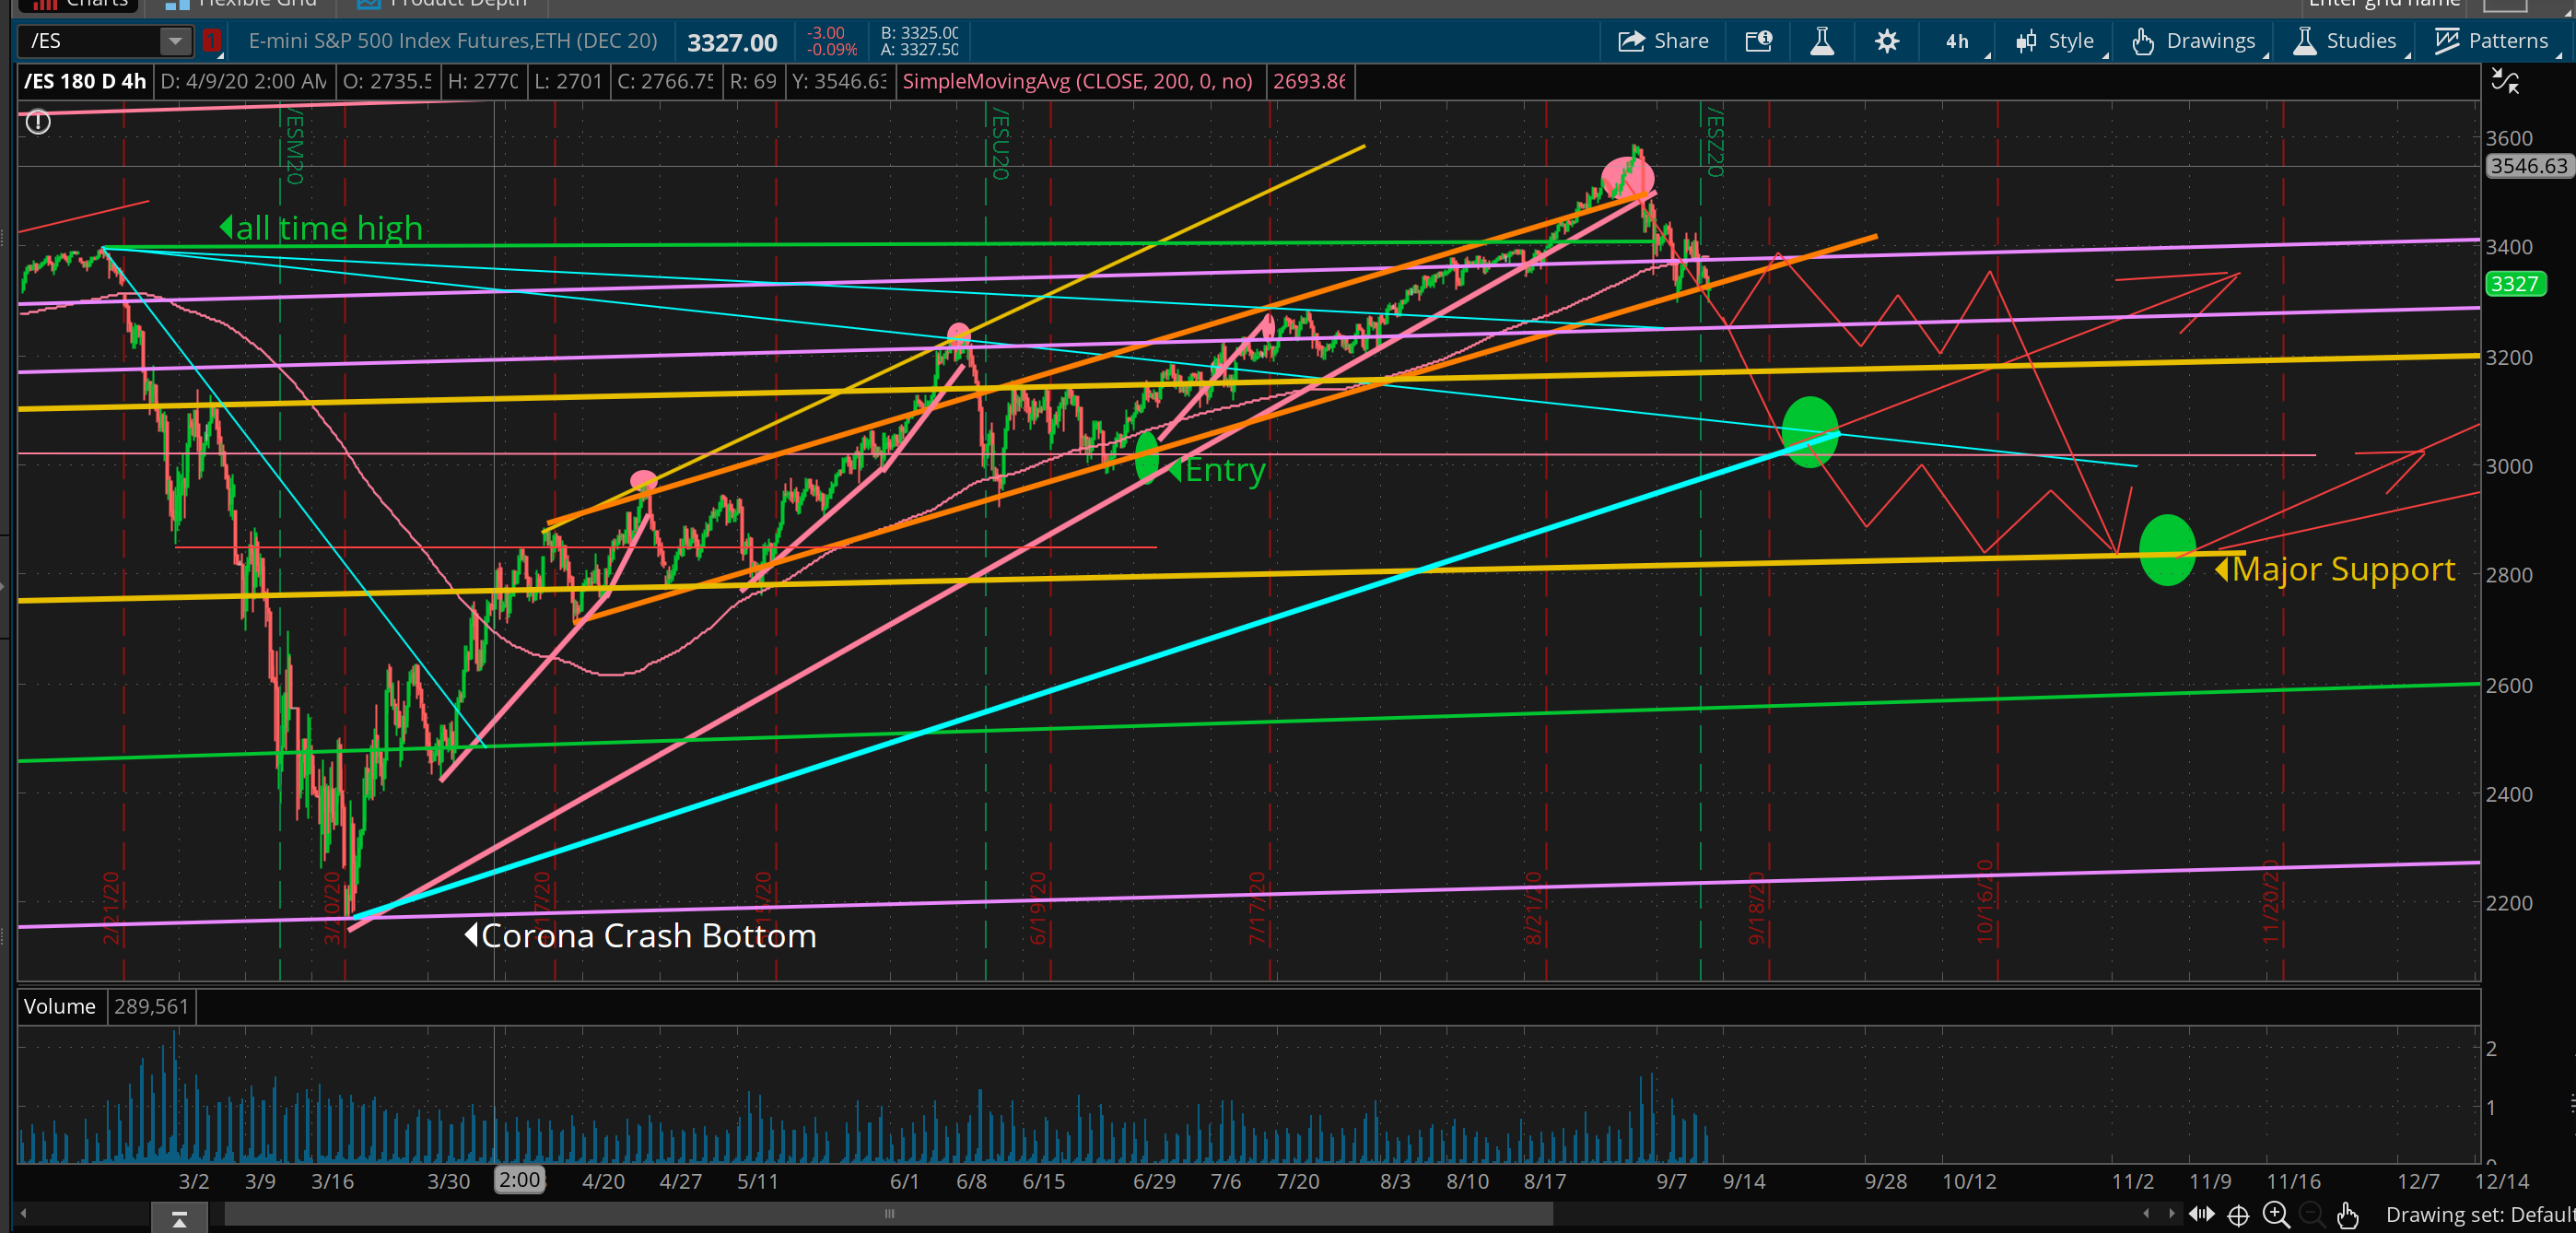
Price action continues to follow our projections. Nasdaq is down over 11% from our forecast reversal lower and it certainly appears the decline into the election has begun. The price chart forecasts for Nasdaq, Dow and S&P 500 remain unchanged (except for the blue pyramid looking lines on the Nasdaq chart that show symmetry and spacing) as price action continues to follow our projected price track lower (see red lines with arrows on charts).
The green circles on the charts represent high reward/low risk Entries should we get down there. We are looking for these entries to align with entry positioning on those individual securities we have identified that we expect will mirror the broader market although mirror like on steroids.
Nasdaq
Dow
S&P 500
I have hundreds of examples to show historic price pattern repetition identification. I have hundreds of examples of how we have used this information to predict the future and profit from it. I really hate using the word “predict” but it is what it is. Check these charts out.
CAT
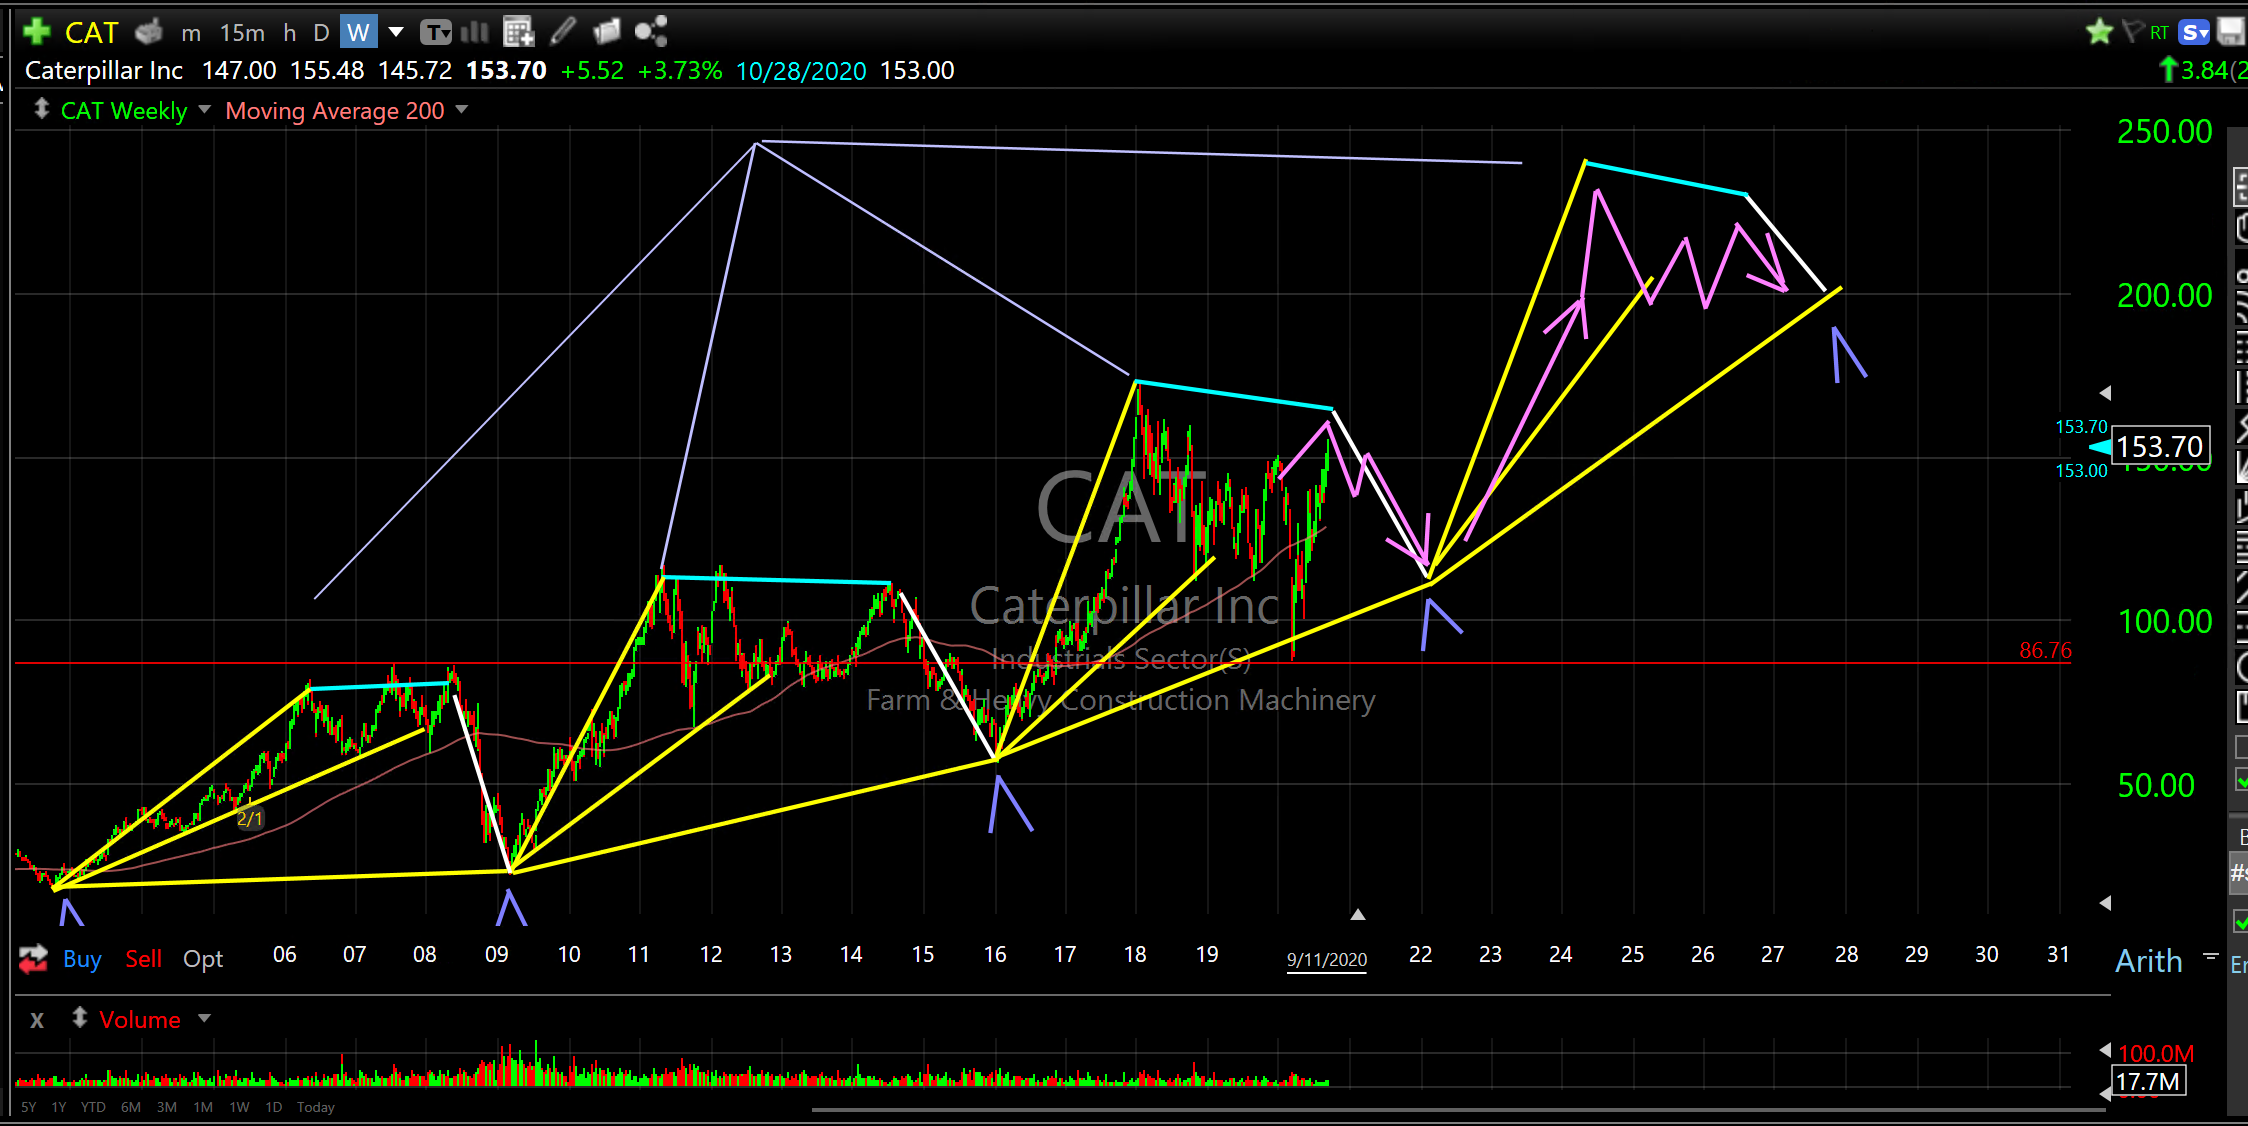
CAT..Caterpillar Inc..Look at the repetition!
ENPH
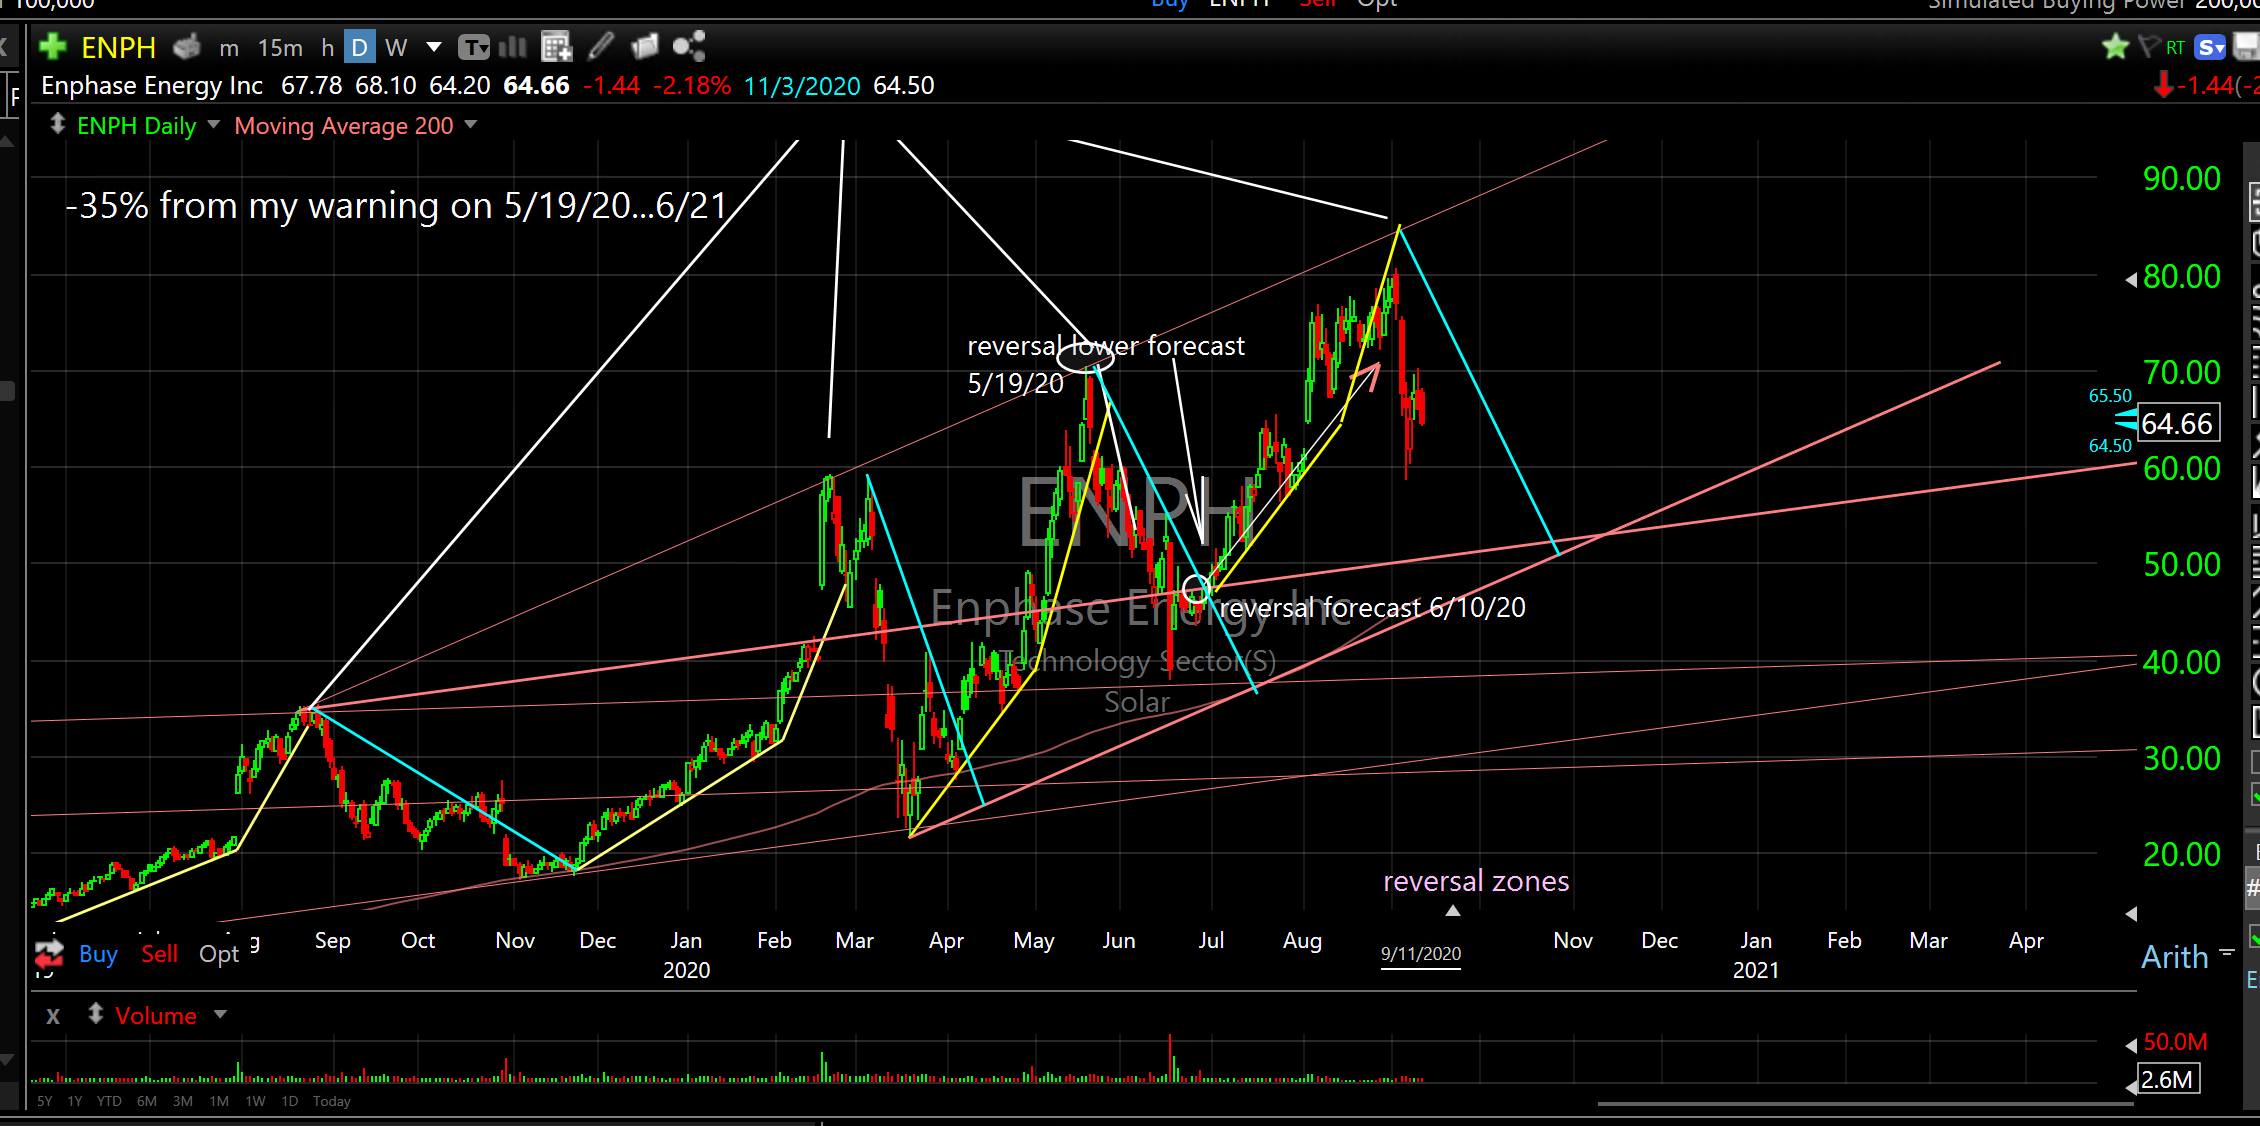
ENPH..Enphase Energy Inc..I haven’t touched this chart since 7/13/20. Look how price has followed the forecasts exactly!
EVBG
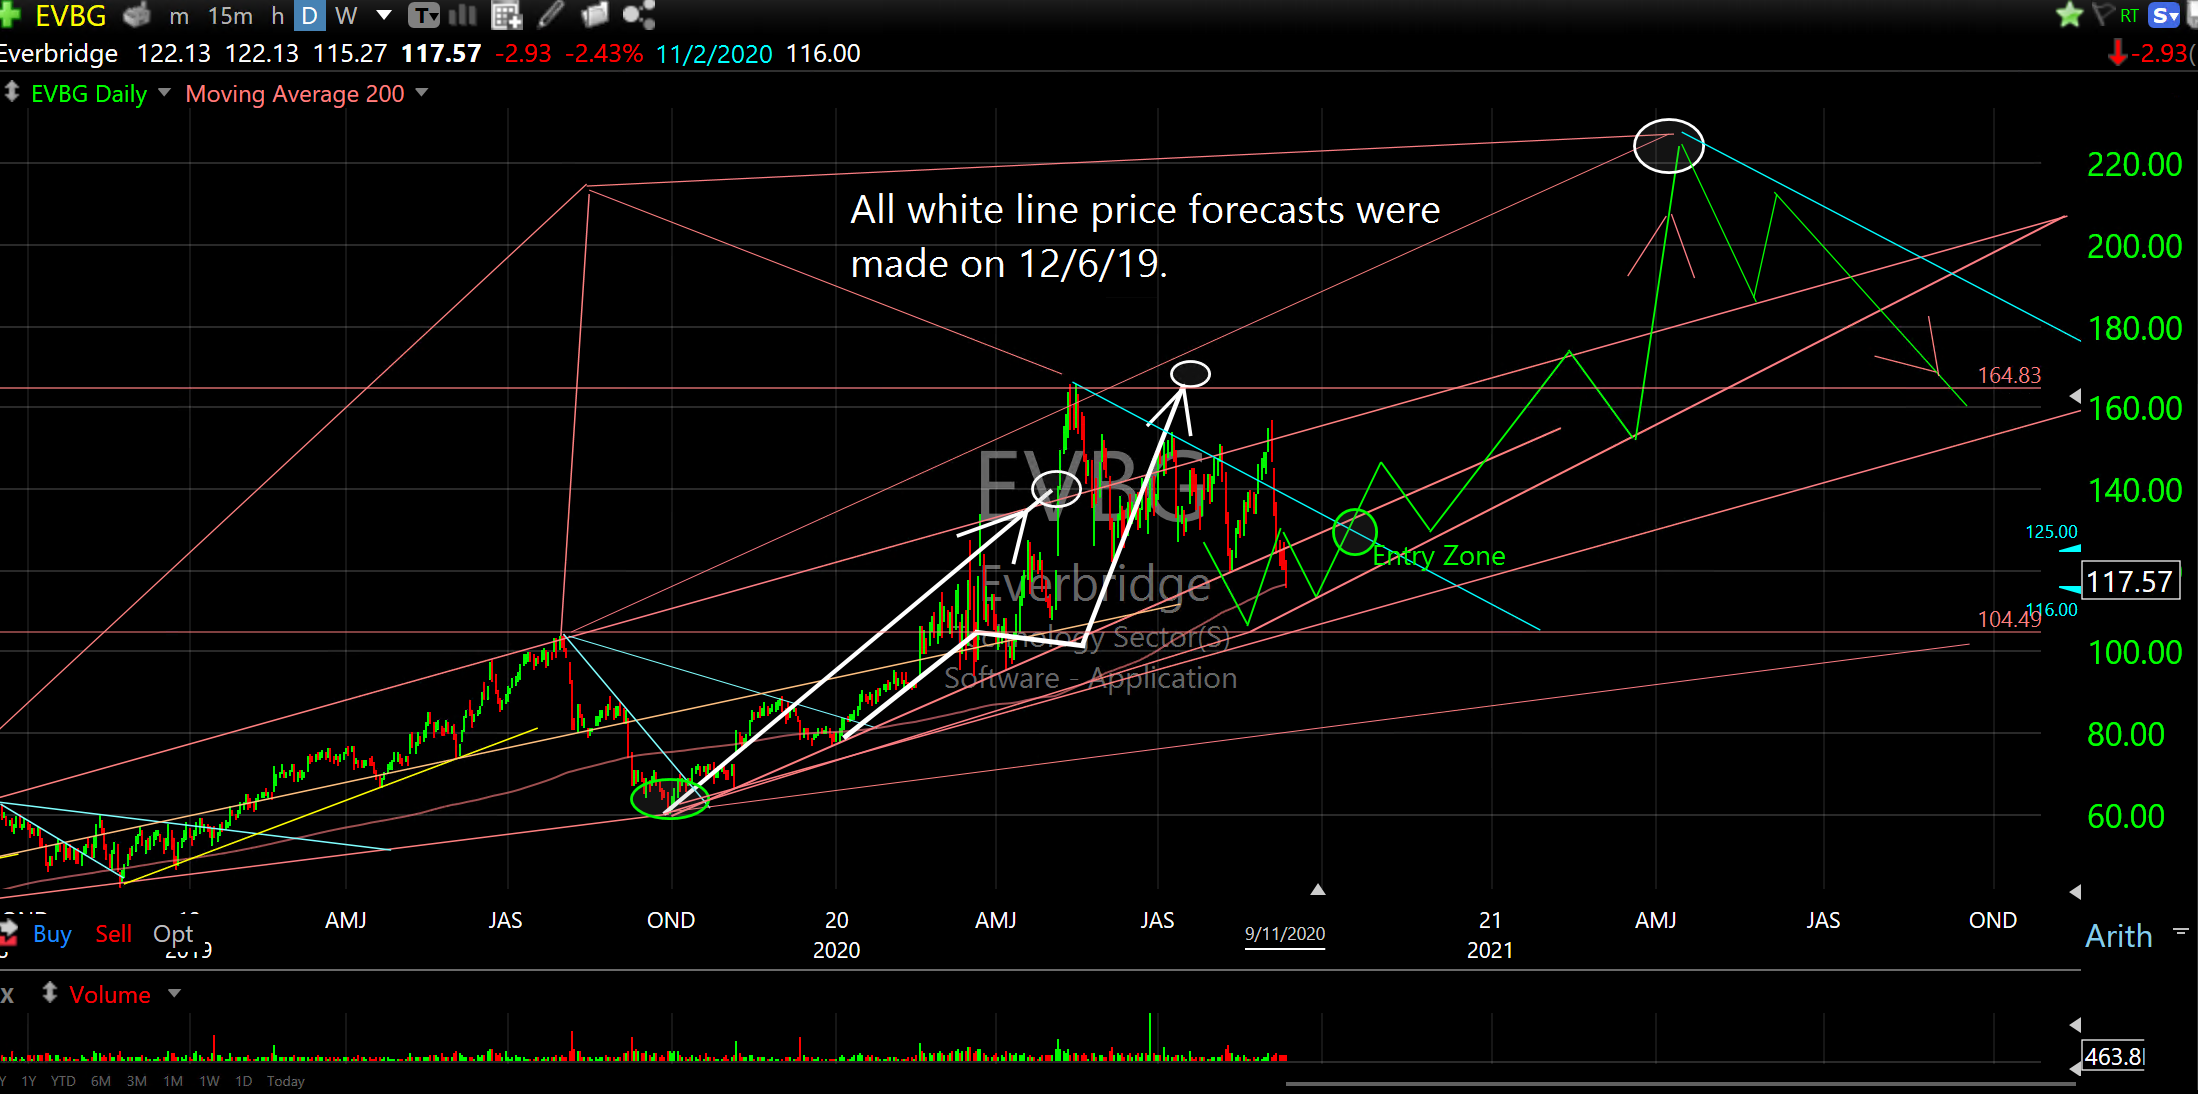
EVBG..Everbridge..White line price forecast was made on 12/6/19. Price subsequently followed the forecast with a degree of accuracy where it’s almost like printing money.
We won’t always be right but there is no better way to be as right as we have been, year after year, at least as far as I know. And, what’s really cool is, for the most part, we know when we are wrong..when price goes off track we have the opportunity to do something about it. Way beyond buy and hold.
For me, it’s time to sit back and monitor price action. If I add positions it will only be for a quick trade or to hedge my remaining exposure. Anything is always possible, however, current conditions are high risk in my humble opinion.
Take care,
Don