Smart Chart Investor

Beyond Buy and Hold: Using Technical Analysis to Reduce the Risk of Long-term Investing

  • Member Login

XLE; Sector Energy ETF

May 7, 2017 by Don Roth

We recently closed out of XLE for a modest gain.

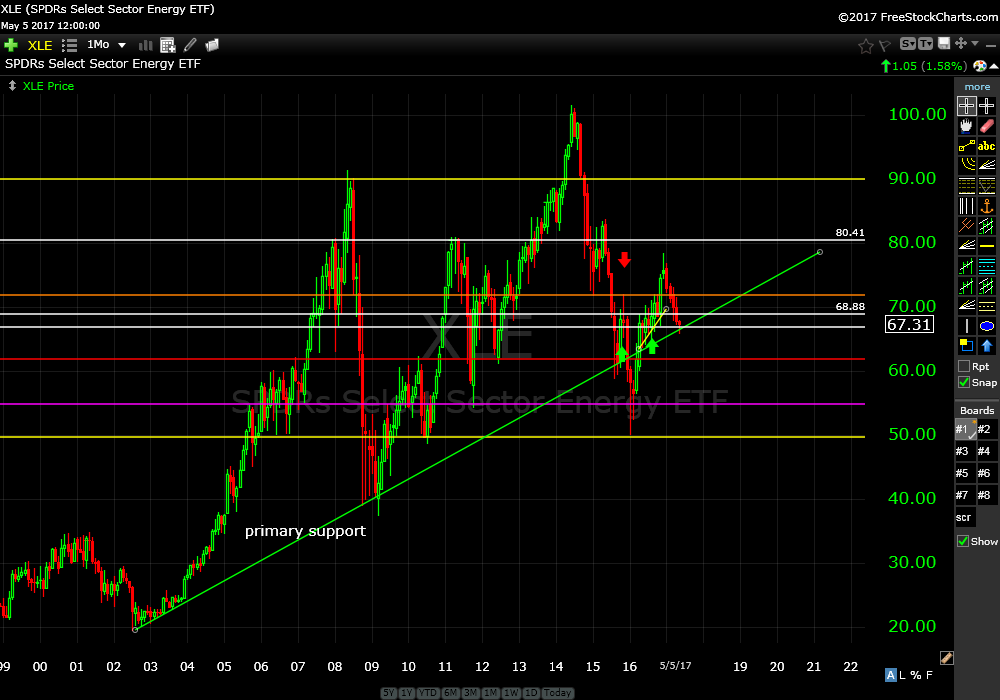
Price is now at a better support level to get long again. The monthly chart from the low in 2002 shows good primary support; the upwards sloping green trend line.

SPDRs Select Energy ETF (XLE) monthly

XLE...2017_5_5m
(click chart to enlarge)

​​​​​​
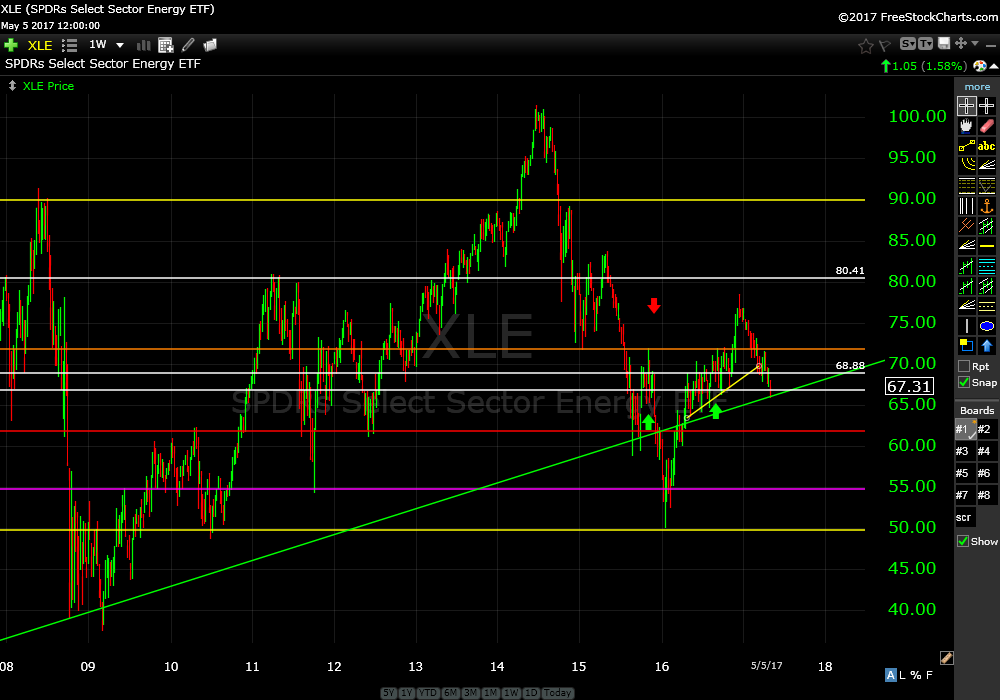
The weekly chart confirms this price zone as a valid support level as well.

SPDRs Select Energy ETF (XLE) weekly

XLE...2017_5_5w
(click chart to enlarge)

​​​​​​​
The daily chart had a nice pop on Friday.

SPDRs Select Energy ETF (XLE) daily

XLE...2017_5_5d
(click chart to enlarge)

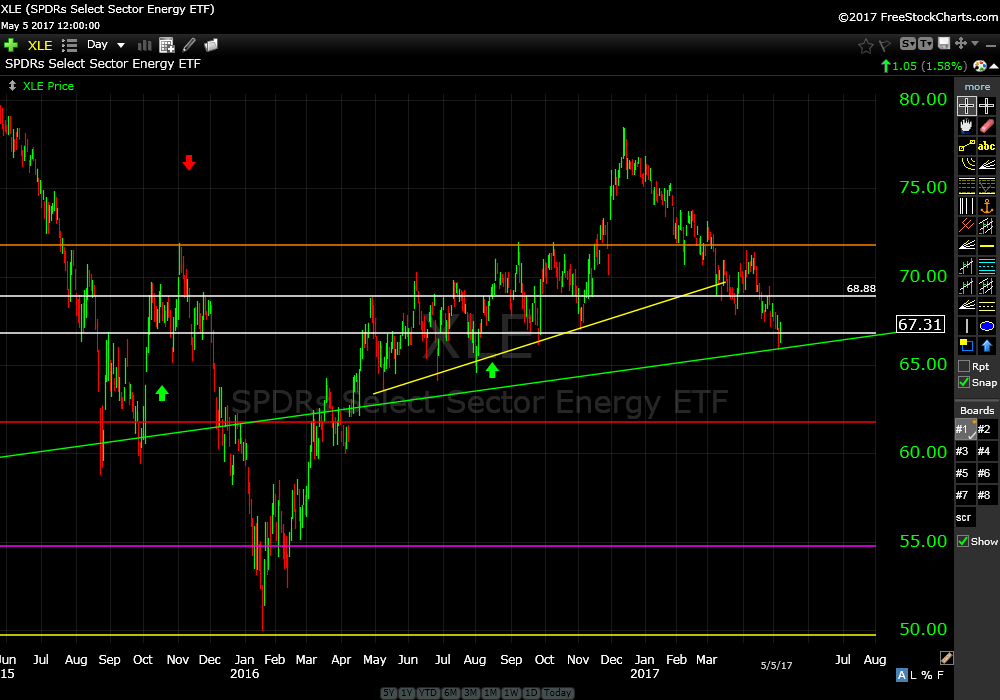
The other good news is the talk on the Street is lower energy prices. This is also a good sign. This is as good an entry as we are going to get.

First target is $71. Risk is under green trend line. I’m buying XLE on Monday morning.

Trade Smart,

Don

RECENT MARKET UPDATES

  • Blow Off Top?
  • Major Announcement!
  • Trade Alert (BE)
  • Important Notice
  • Weekly Market Commentary and Pre Announcement
Go to Members Home

Don Roth

Don Roth, Smart Chart Investor

Recent Market Updates

  • Blow Off Top?
  • Major Announcement!
  • Trade Alert (BE)
  • Important Notice
  • Weekly Market Commentary and Pre Announcement

Copyright © 2011–2026 · Smart Chart Trading, Inc · Privacy Policy · Terms of Use · Disclosure Information · Log in