Saturday, July 25, 2020
I need to get in the ocean. I need some salt water in my veins. I need to hear some fiberglass thumping on the water as I paddle around. I need more time with my kids and grandkids. I want the madness to stop. Peace would be nice. Maybe I’ll just go float in the pool and dream of better days ahead.
Broader Market Review
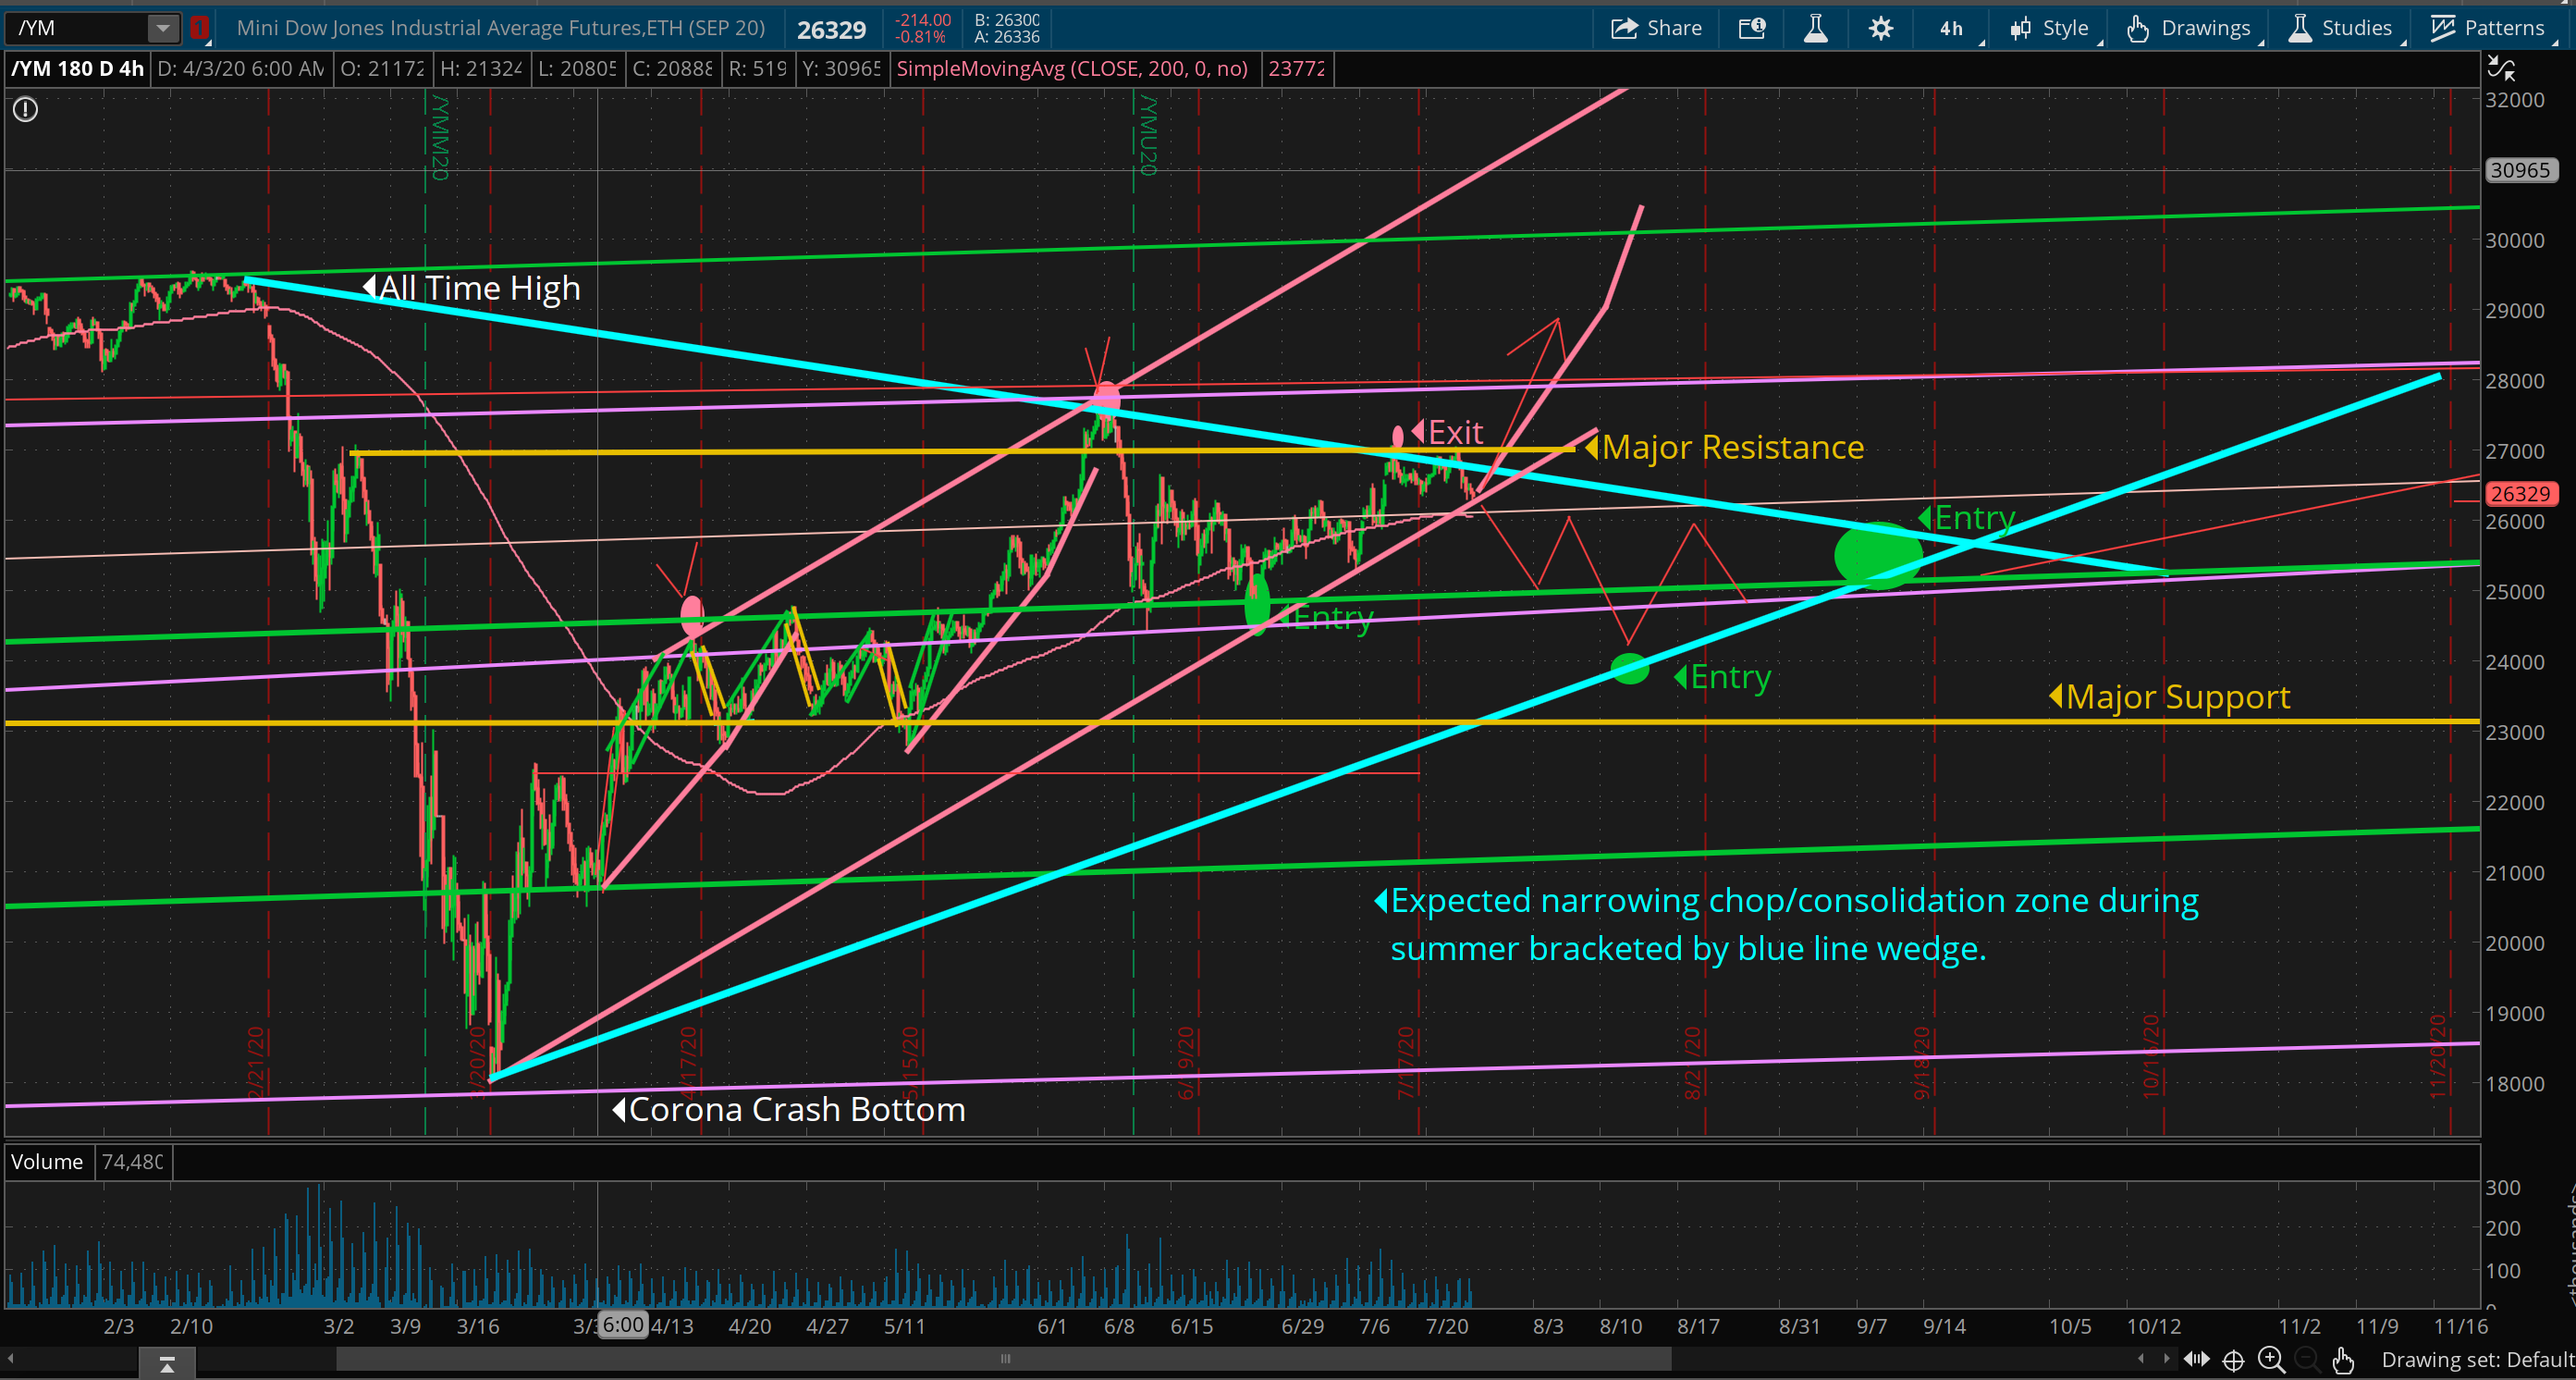
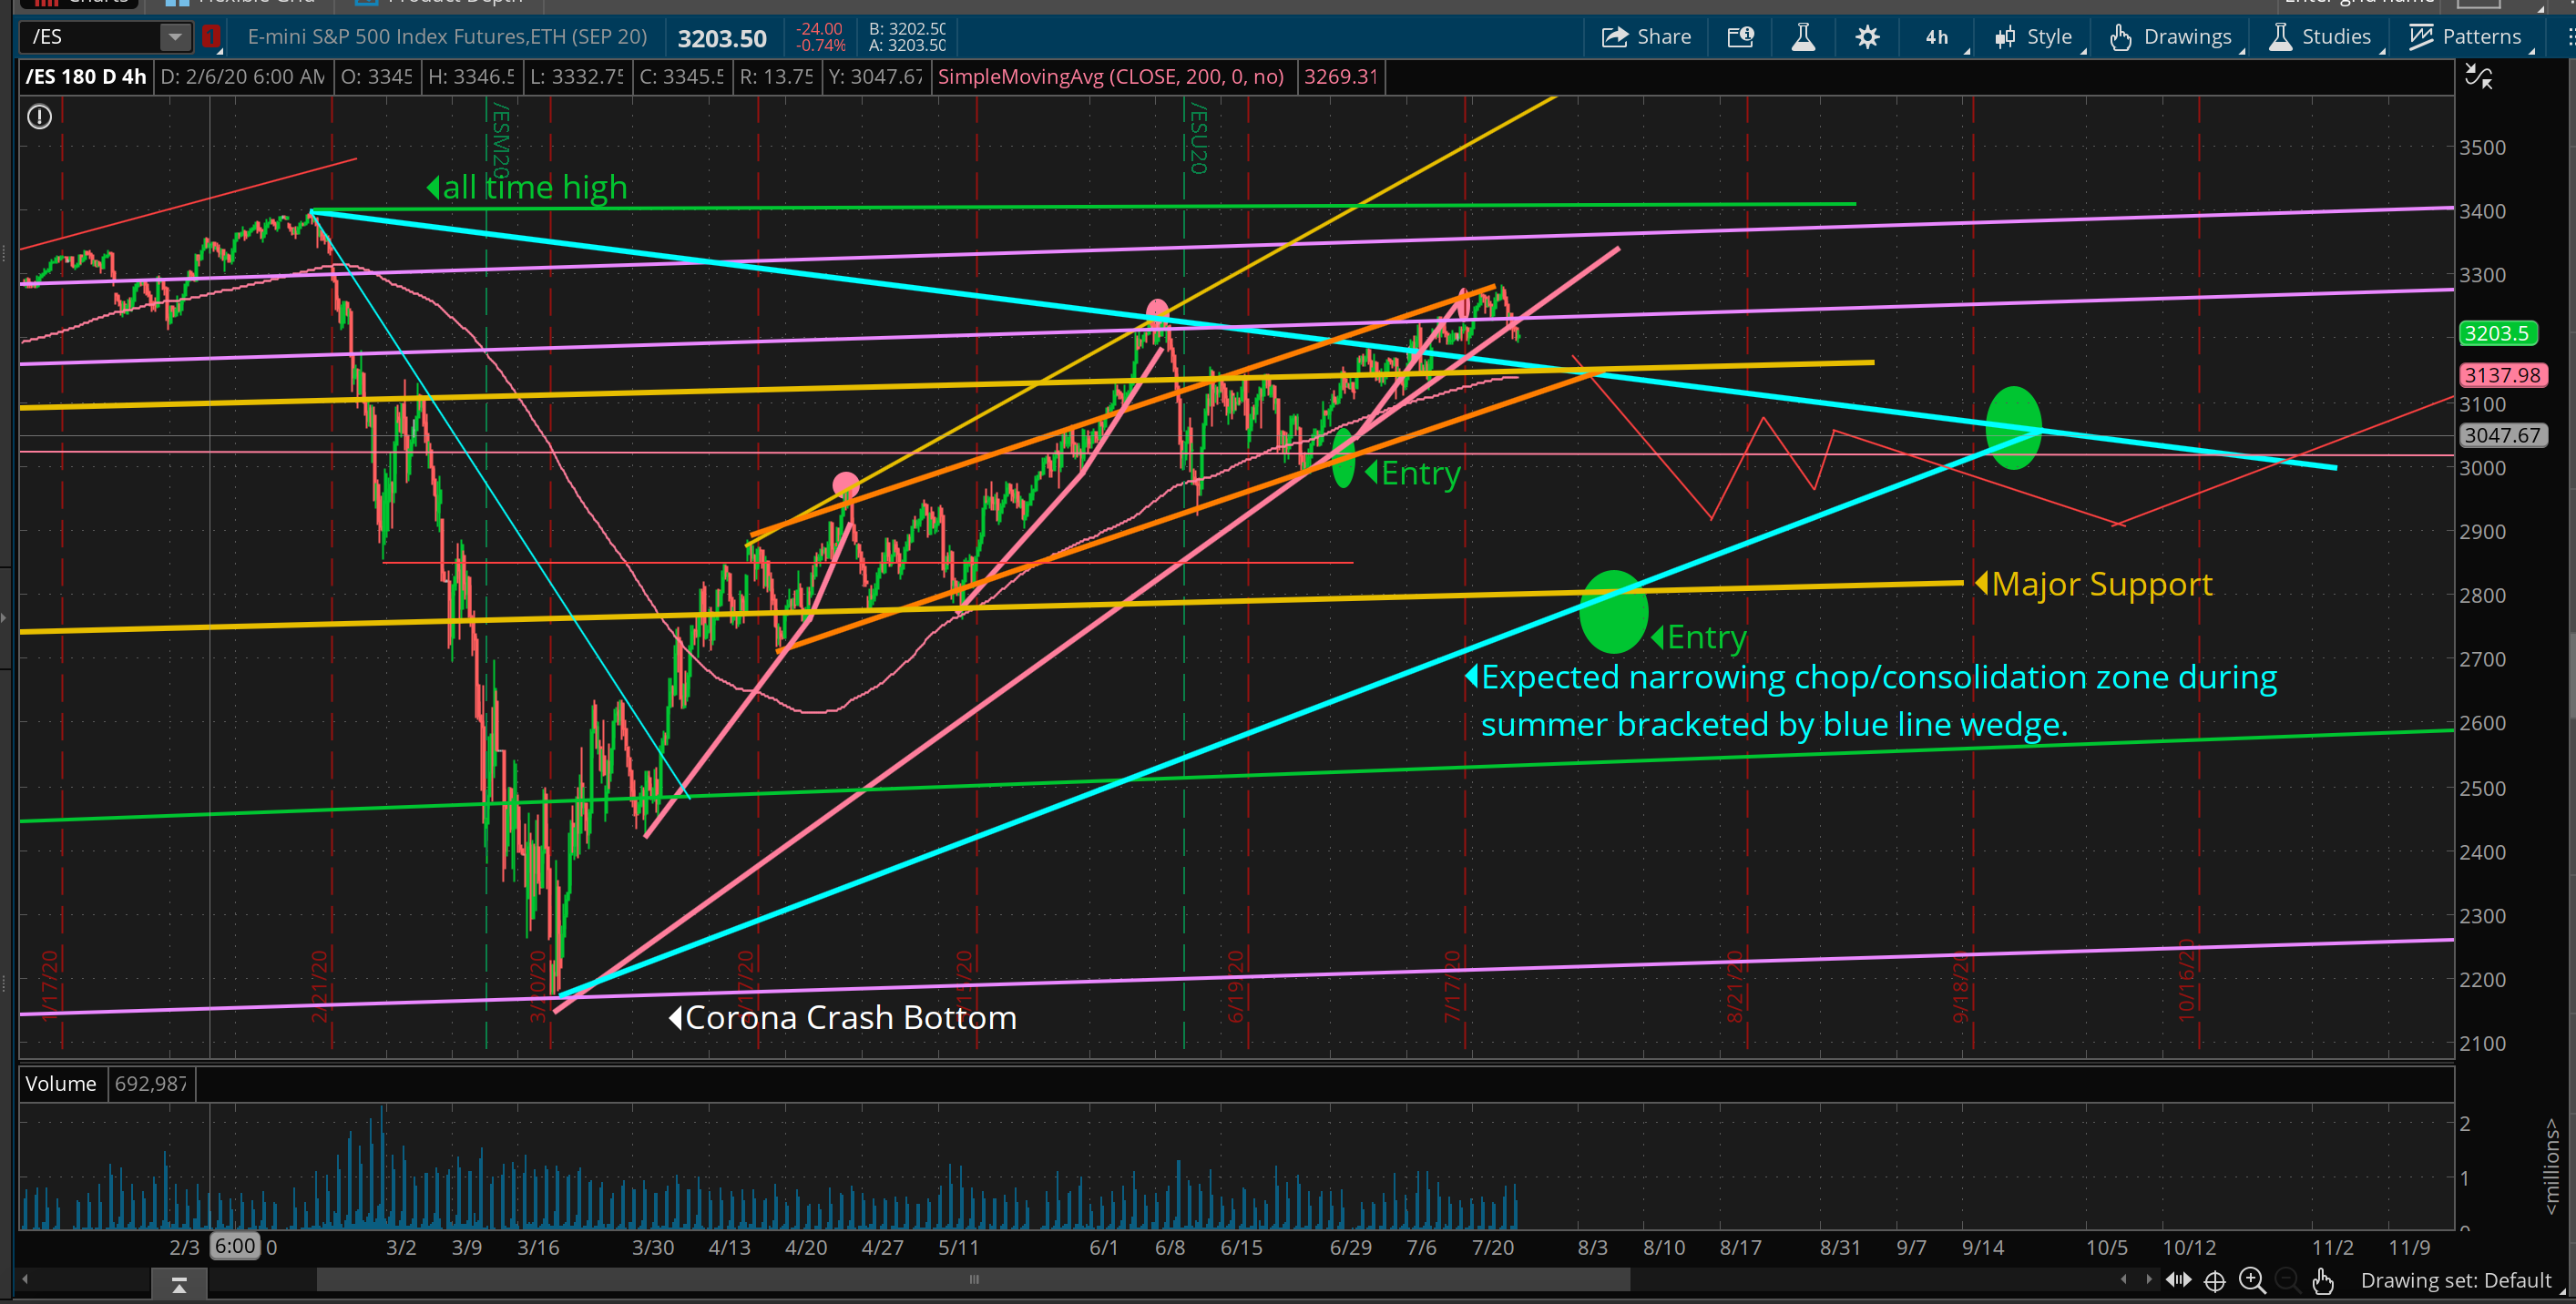
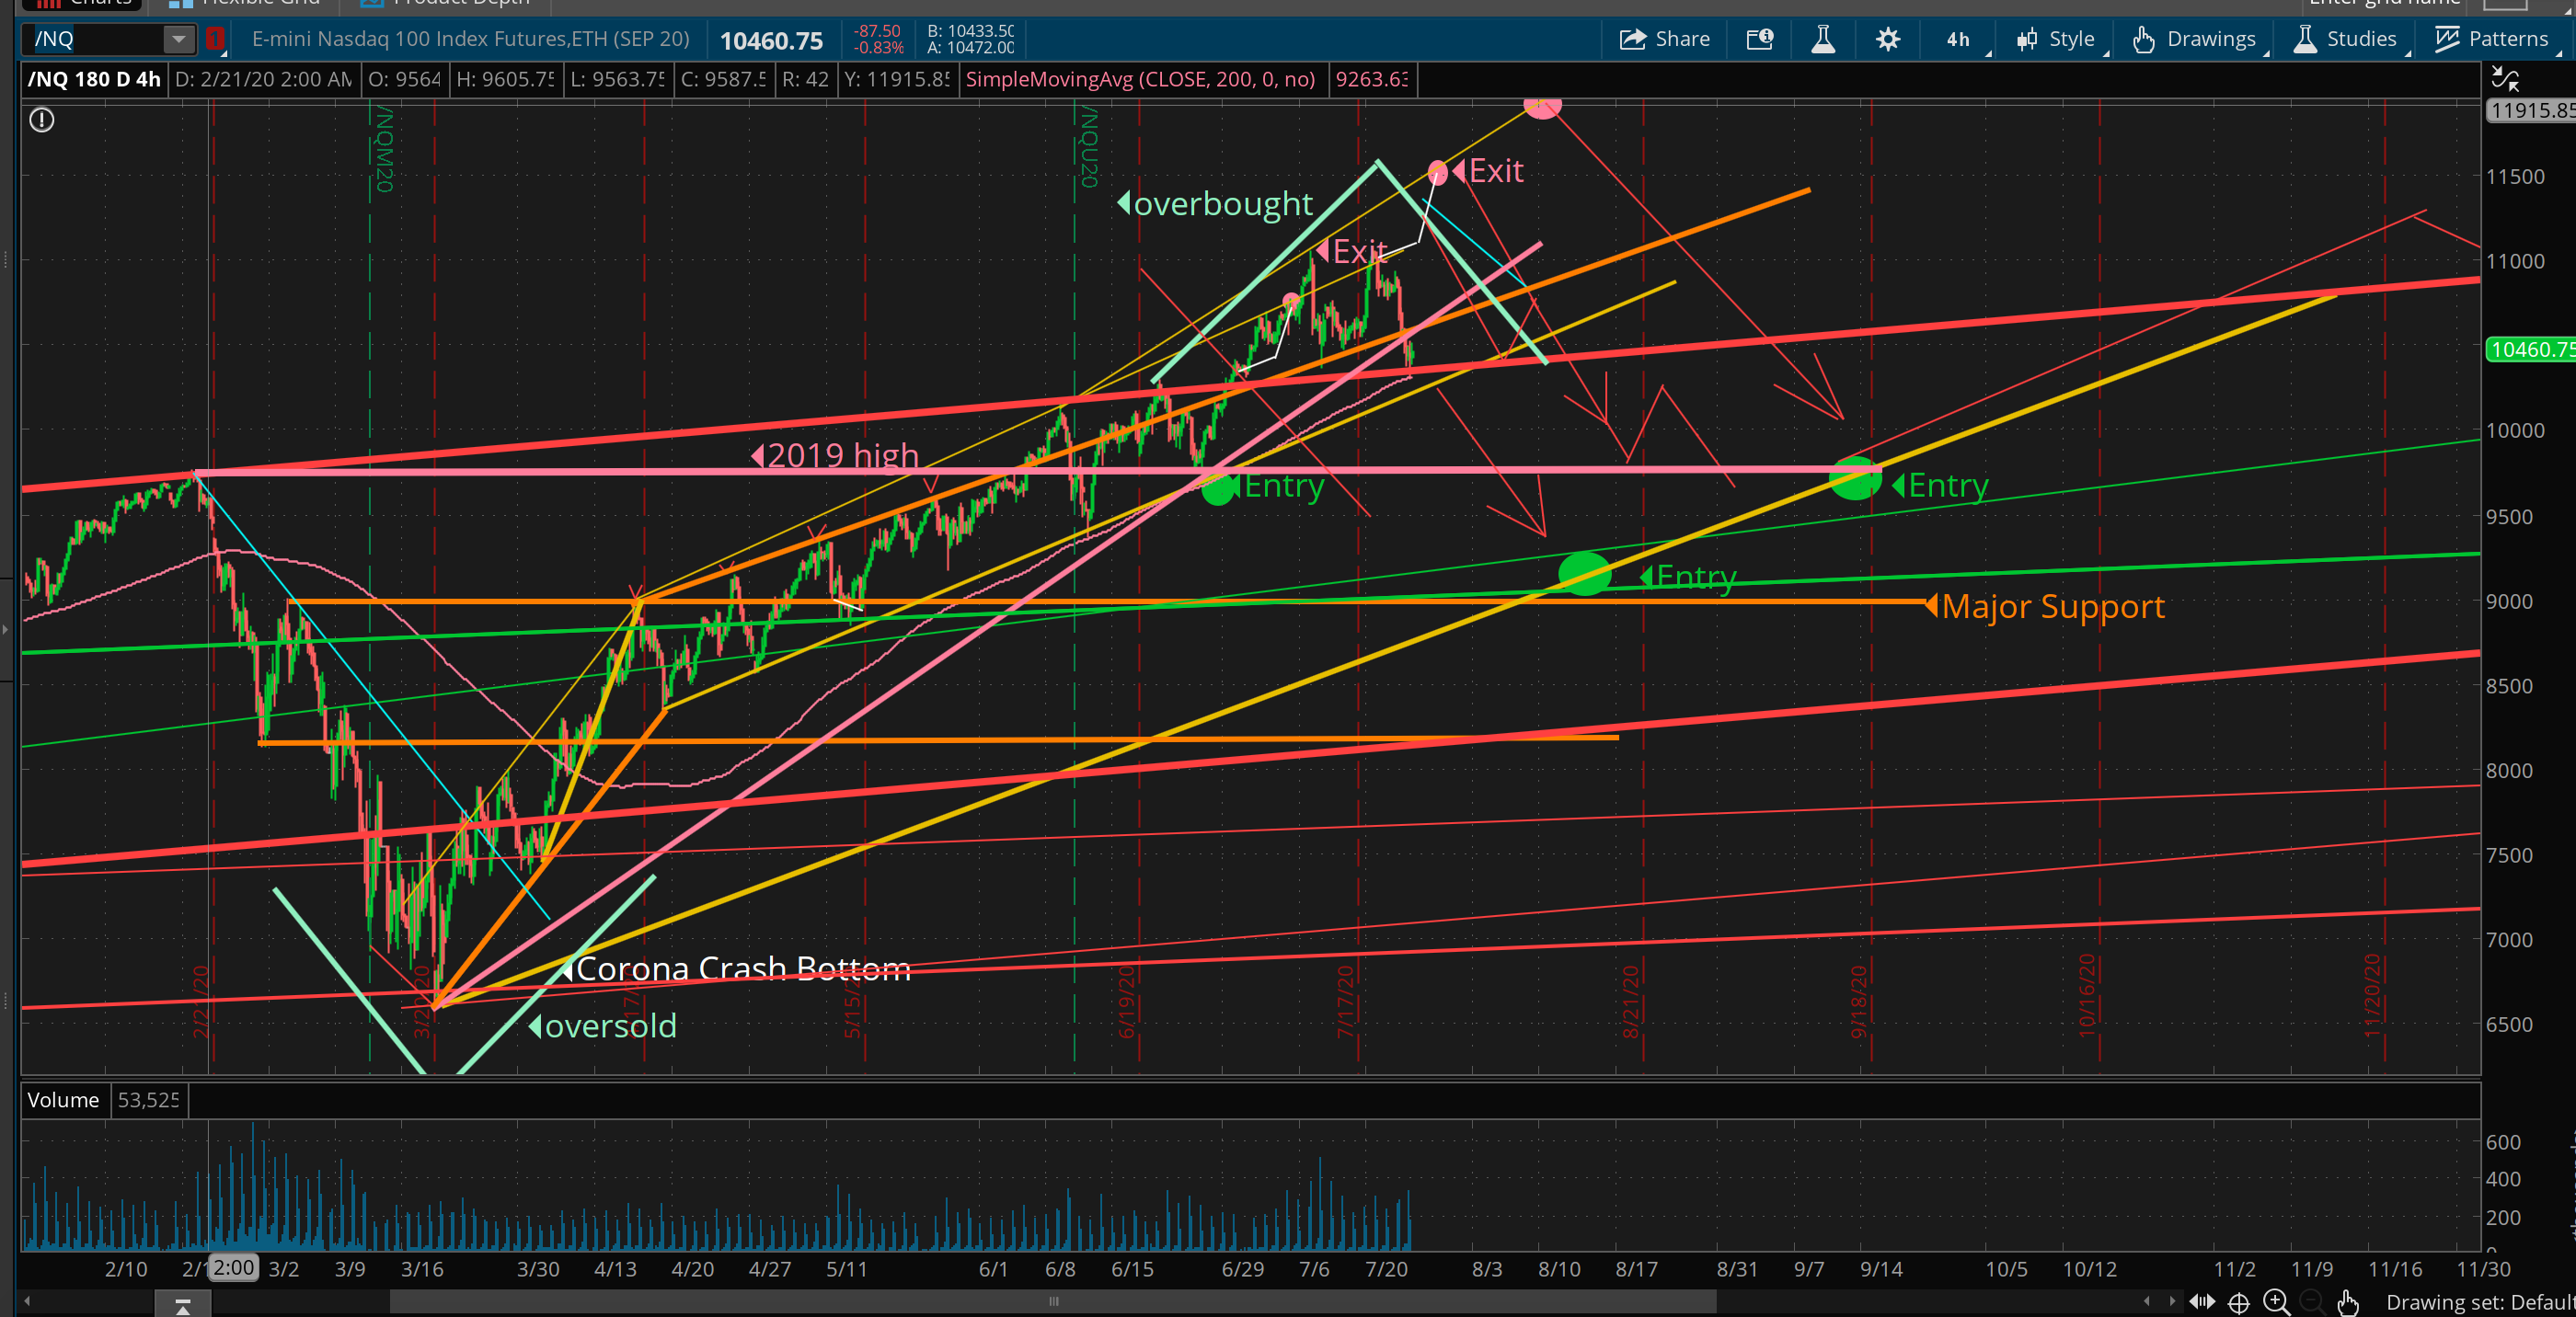
The Dow and Nasdaq have traded down into their lower support levels while the S&P 500 remains above and still has room below before the bottom falls out. For the month of July the Dow has been unable to clear important overhead resistance and is now compressing in a wedge formed by ascending support and descending resistance. The Nasdaq has broken below an important support level and has one more level to go before confirming the secondary collapse that I’ve been expecting.
If these current critical levels don’t hold it is likely we will trade down into the lower entry levels shown on the charts. If we reverse higher from near current levels we could see a final leg up before the summer swoon.
I continue to trim and exit positions. The only new positions I’m taking are short term trades to take advantage of temporary swings. I’m OK with missing any near term upside and prefer a more cautionary outlook for the next couple of months. I’m about 65% invested and expect to remain near this level with my longer term holds.
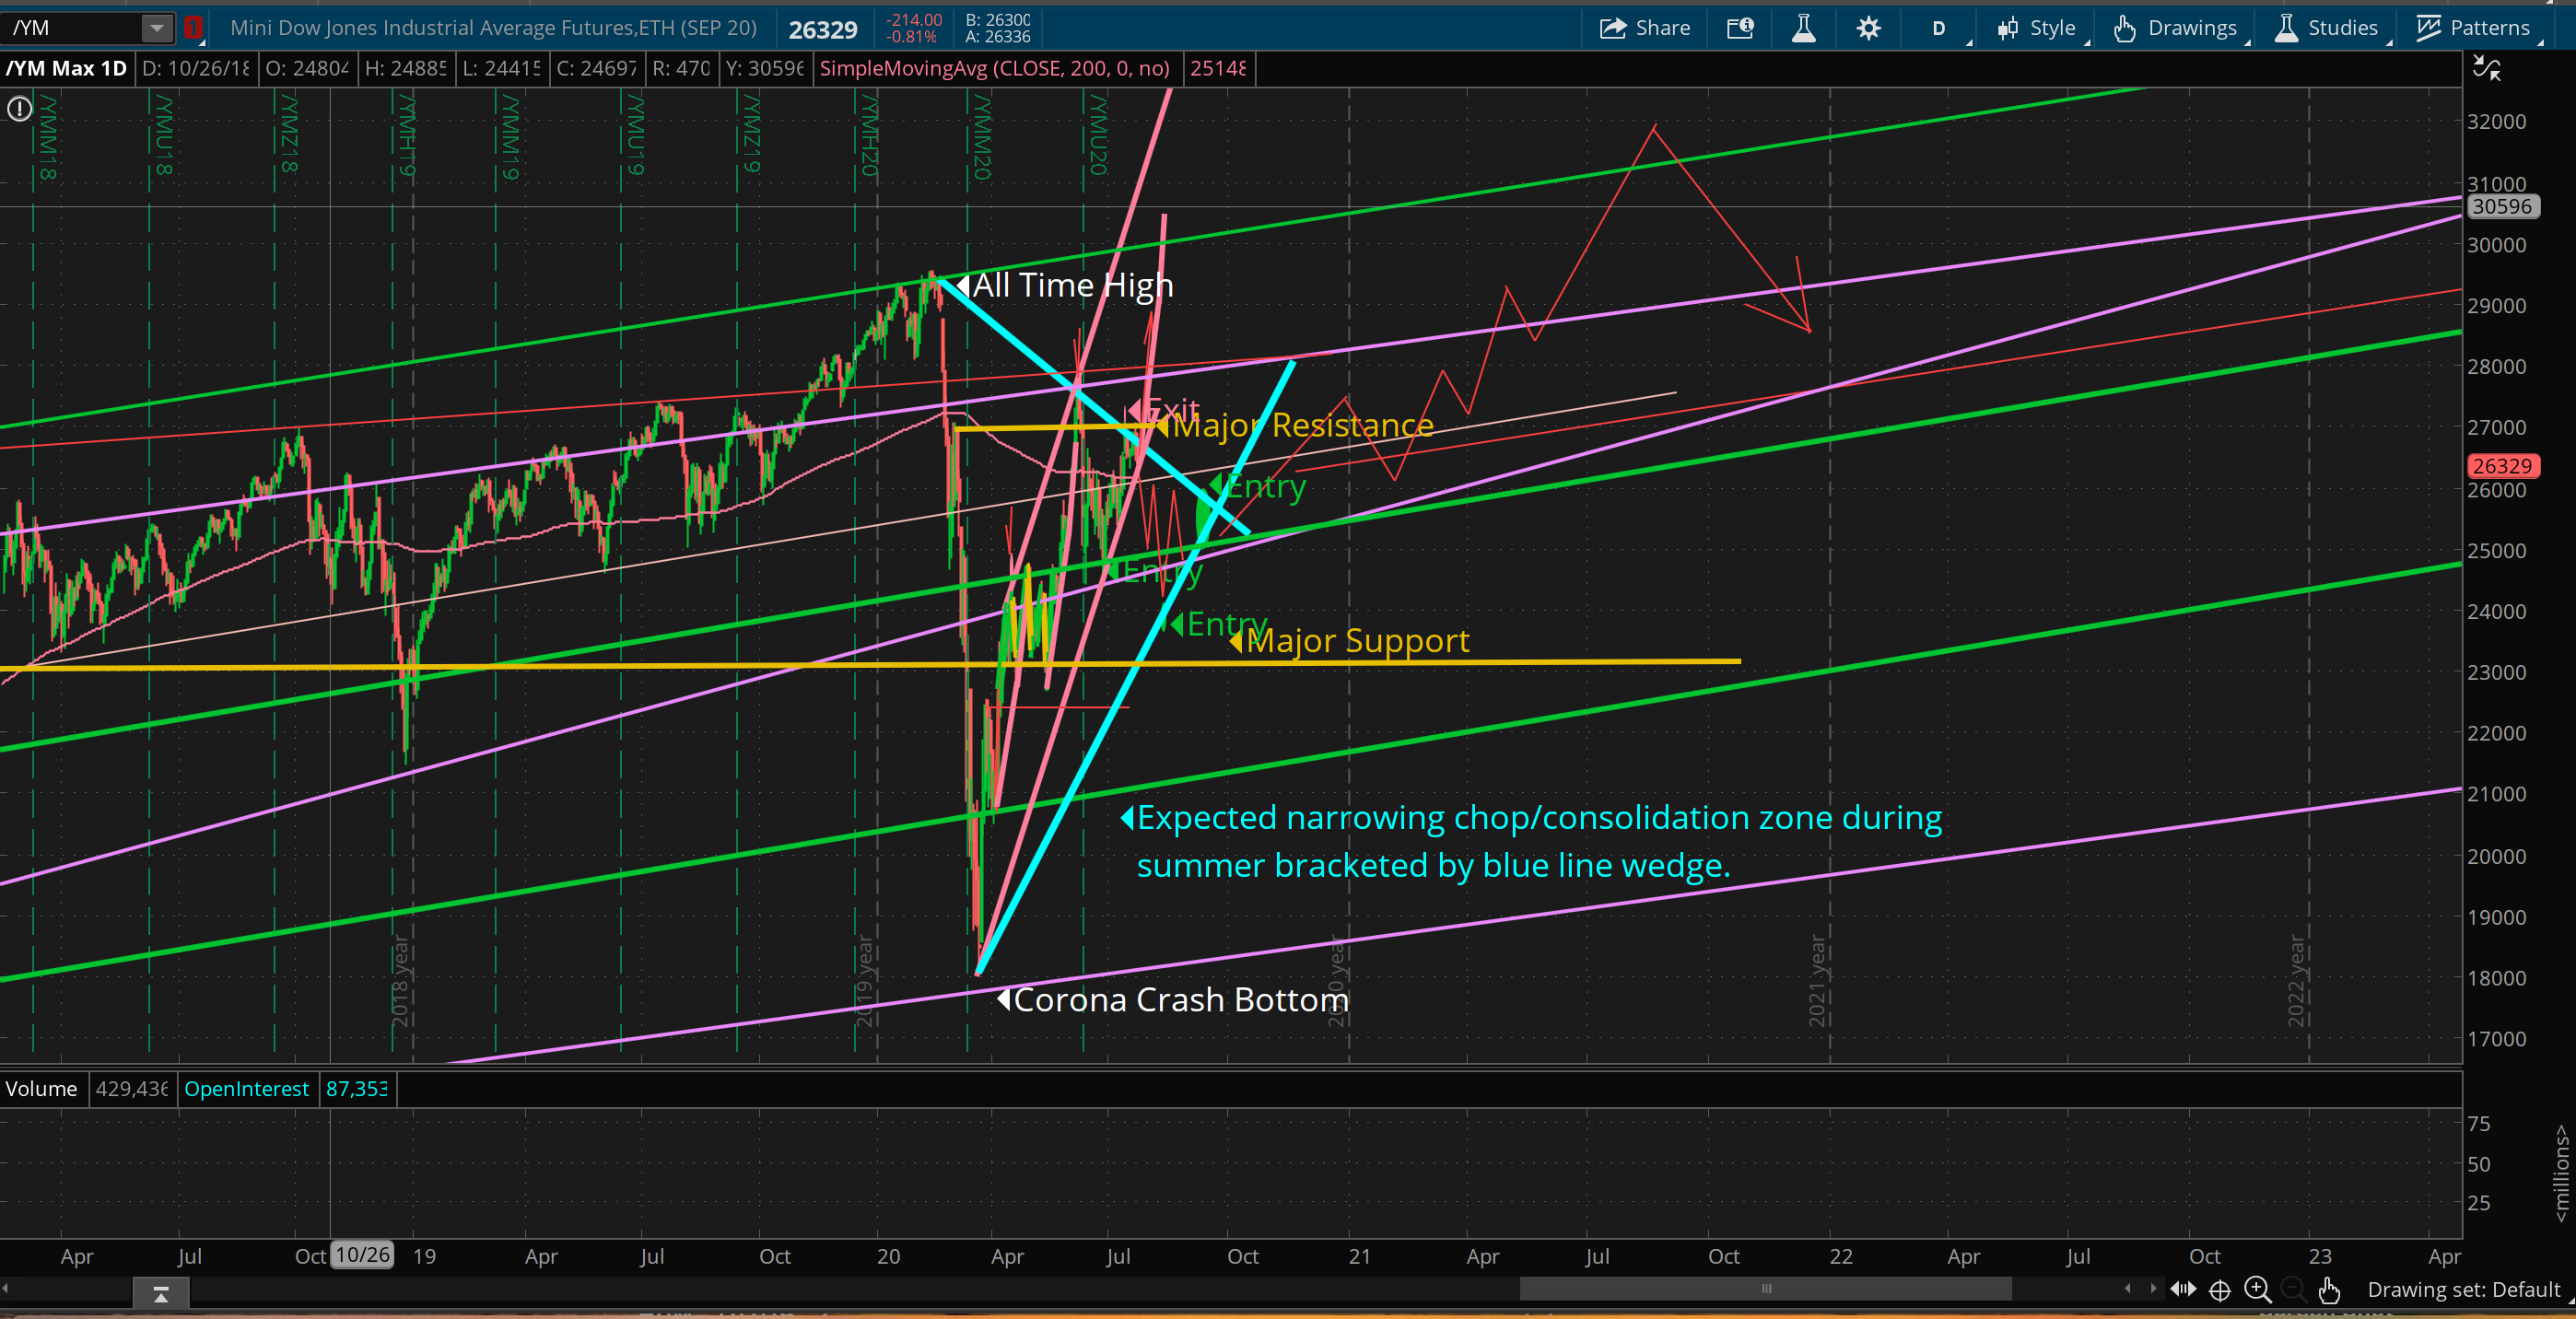
My forecast remains the same; a choppy summer with a secondary collapse into lower Entry levels followed by total uncertainty into the election and the real potential for higher prices into 2021 where the model shows the next significant collapse occurring.
The charts below show both near and longer term forecasts for the Dow S&P 500 and Nasdaq.
Dow short term forecast
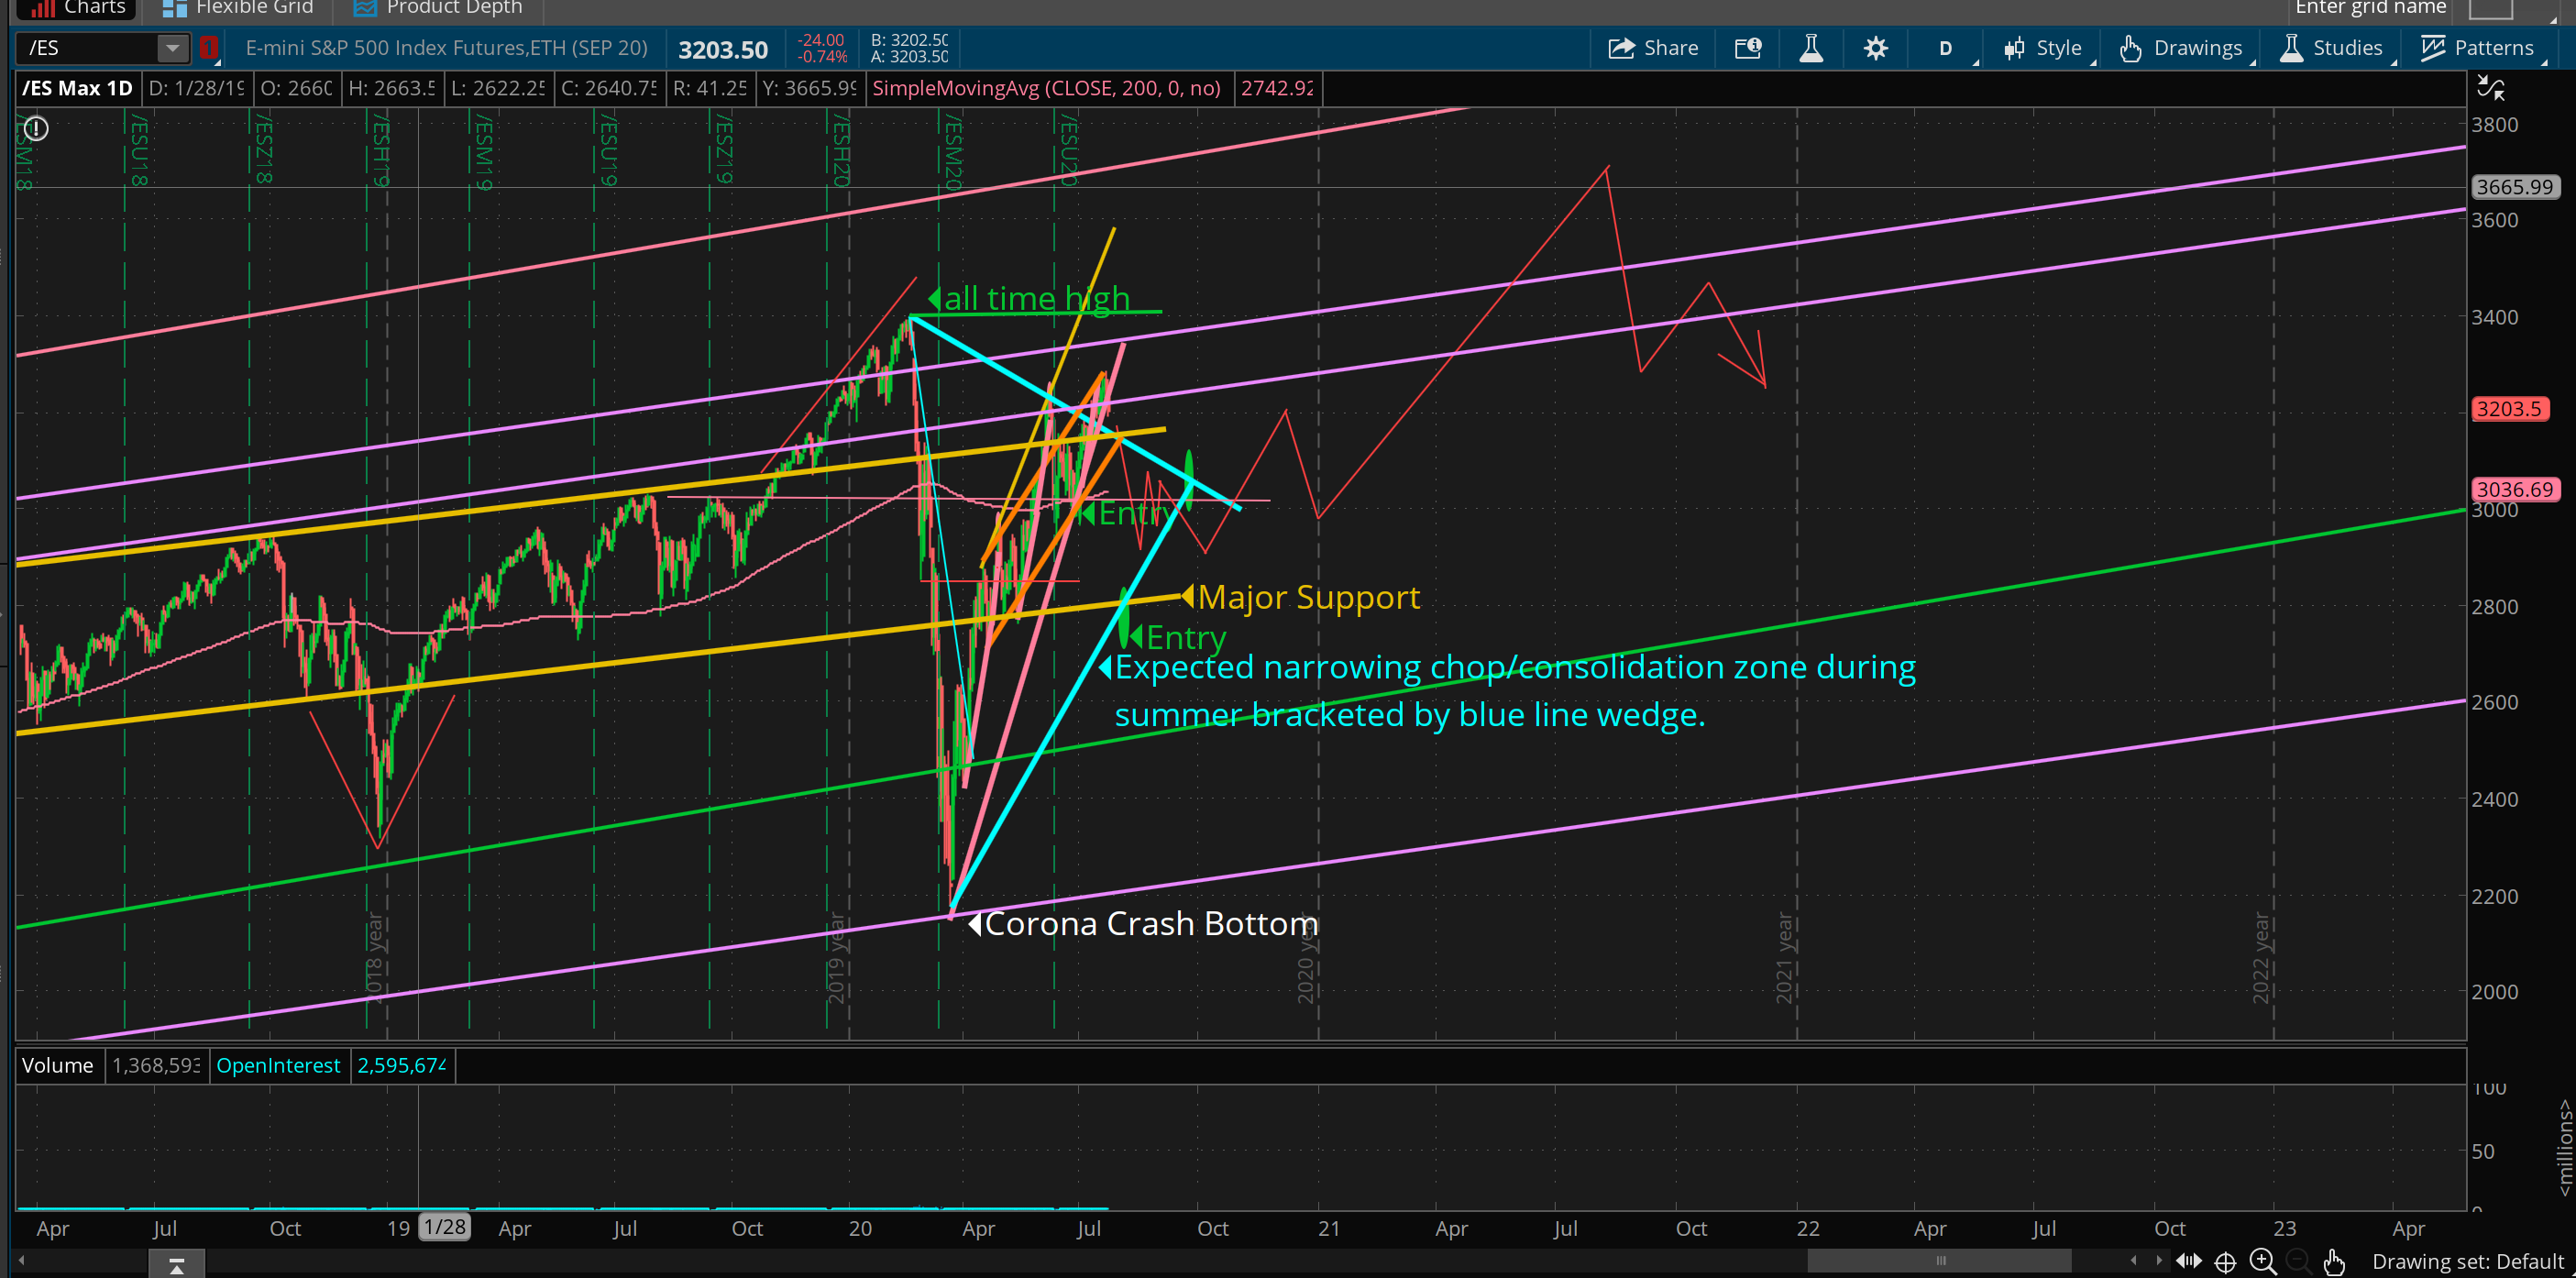
S&P 500 short term forecast
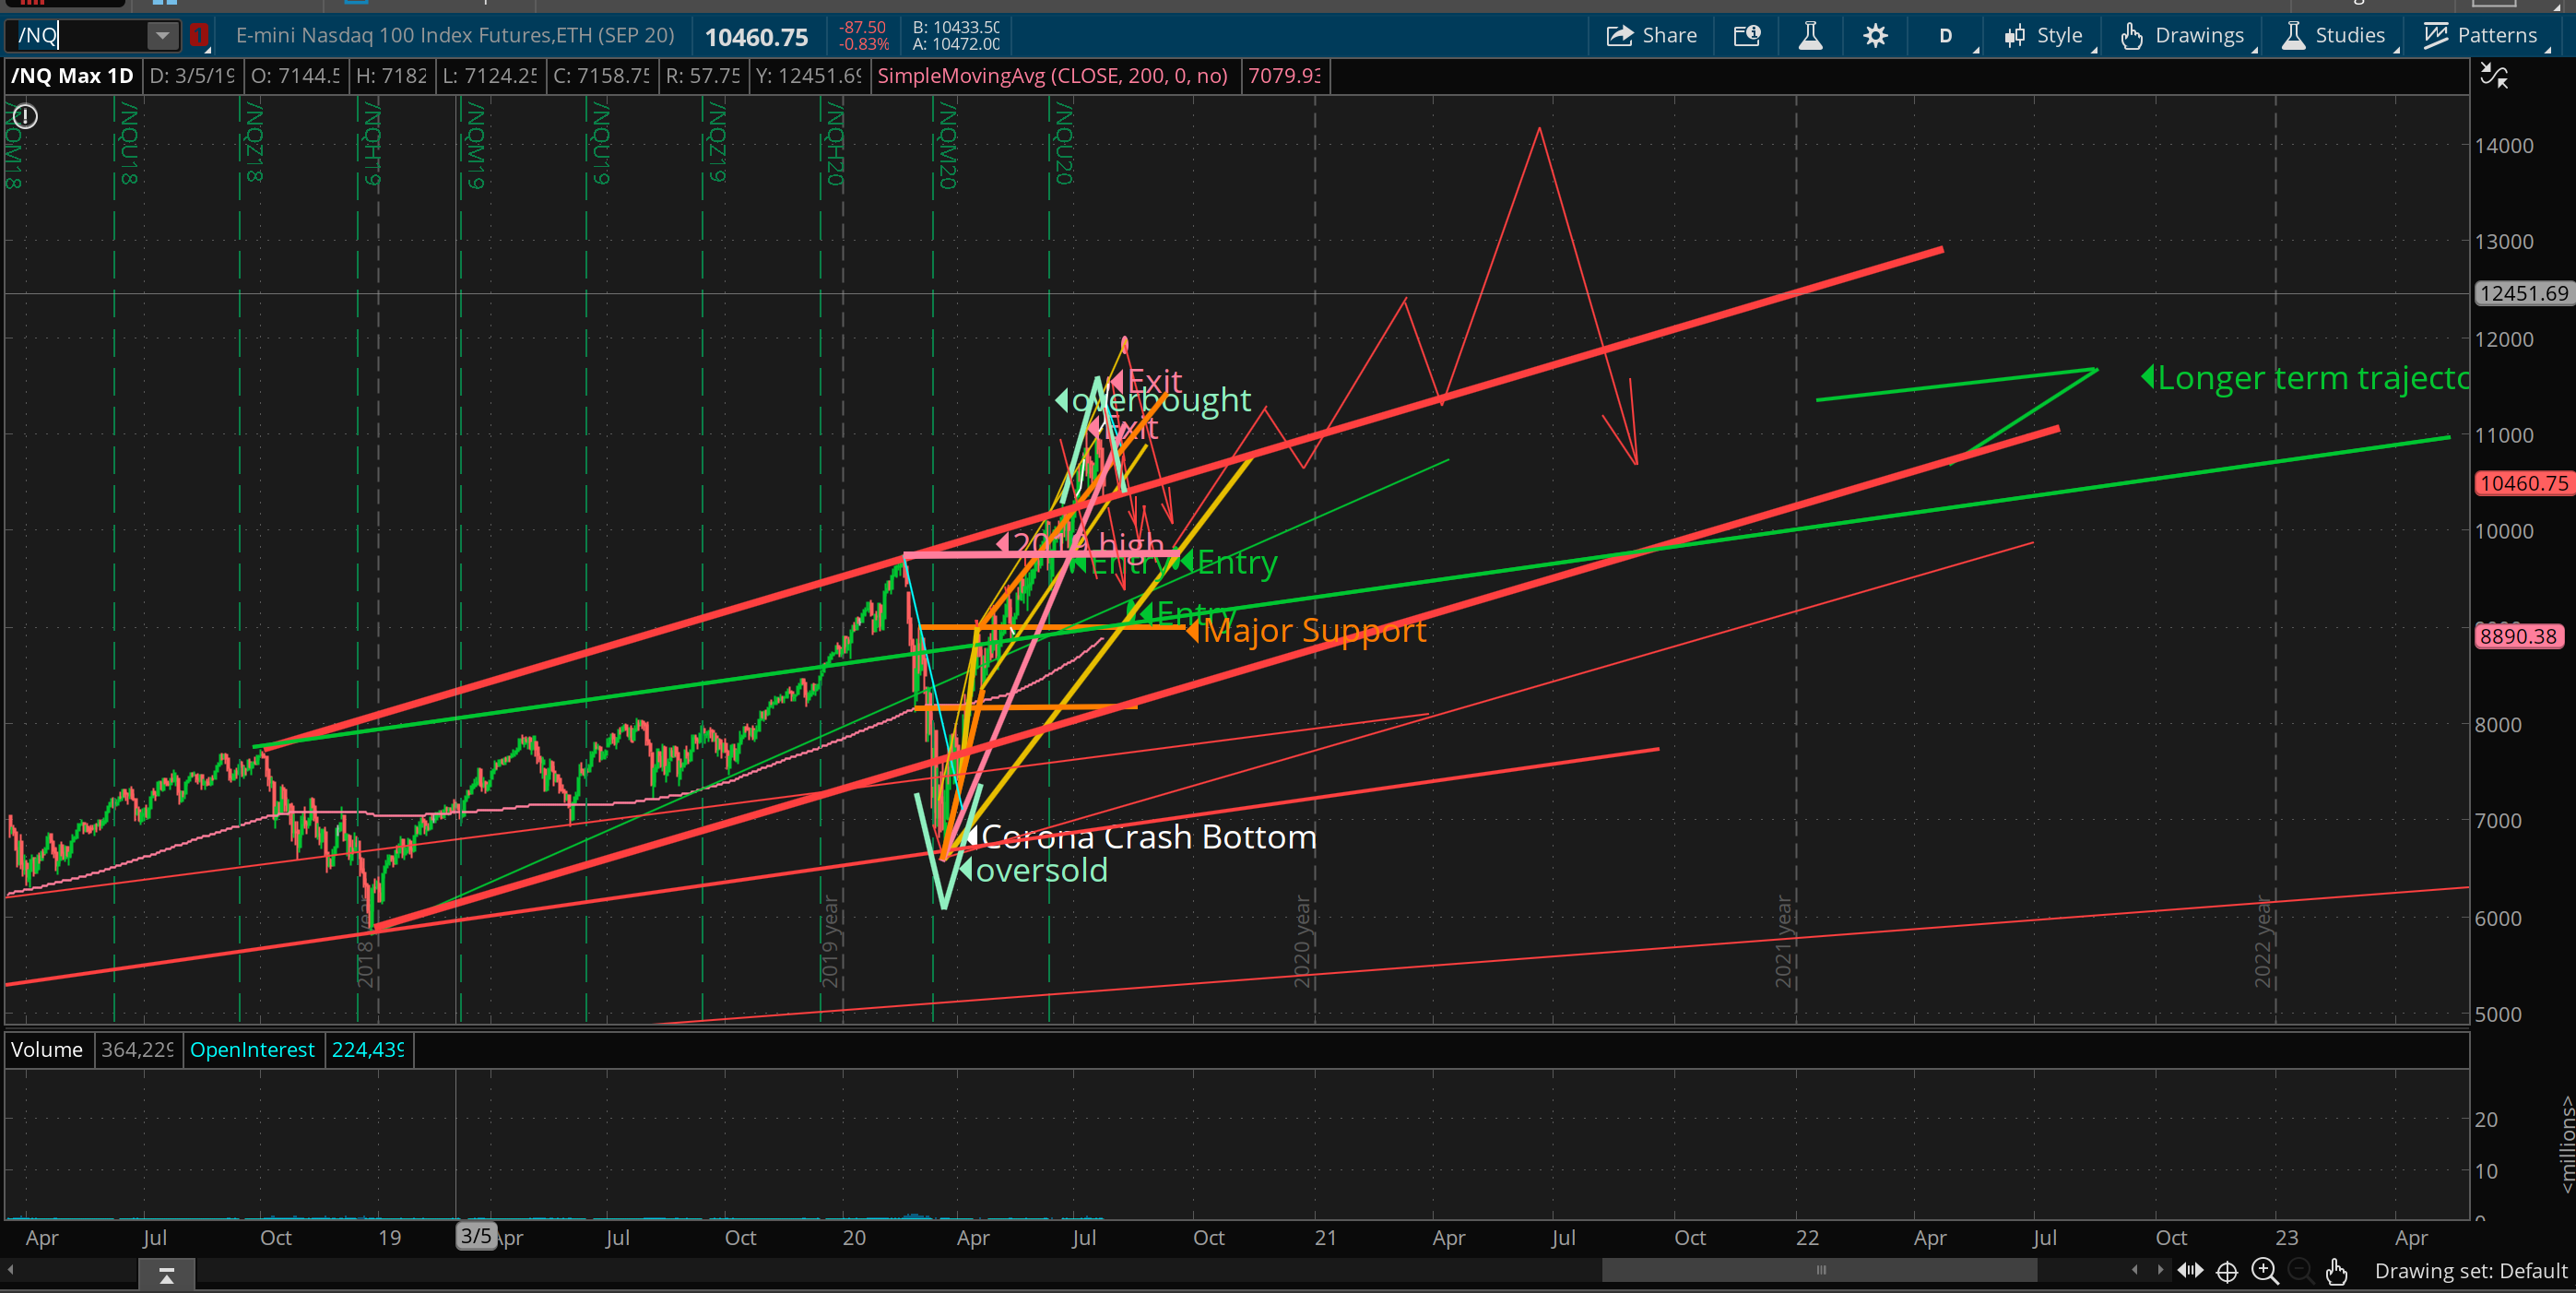
Nasdaq short term forecast
Dow longer term forecast
S&P 500 longer term forecast
Nasdaq longer term forecast
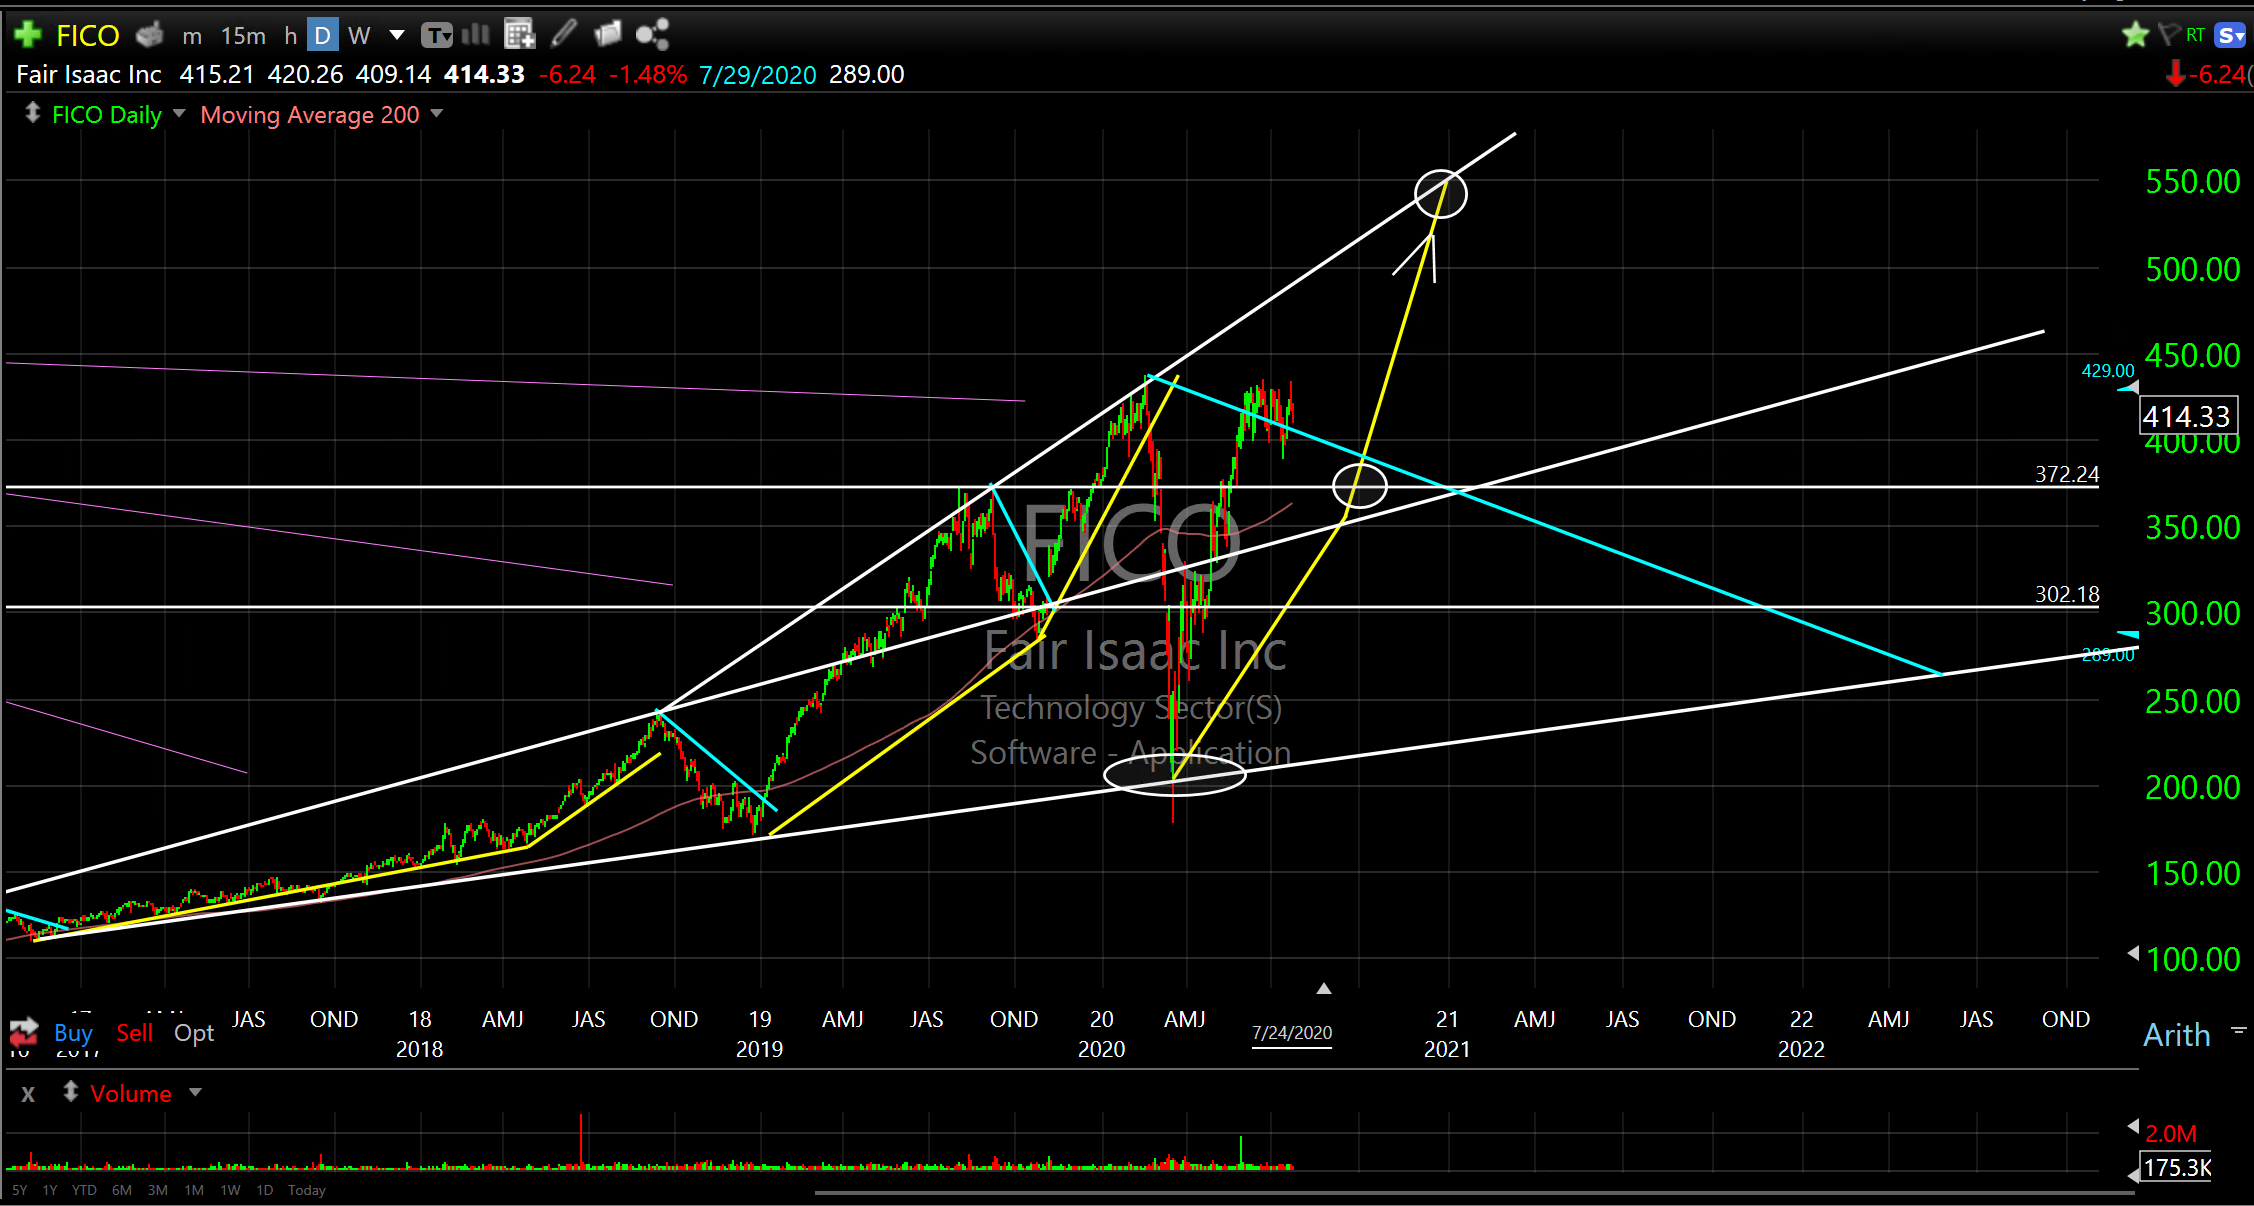
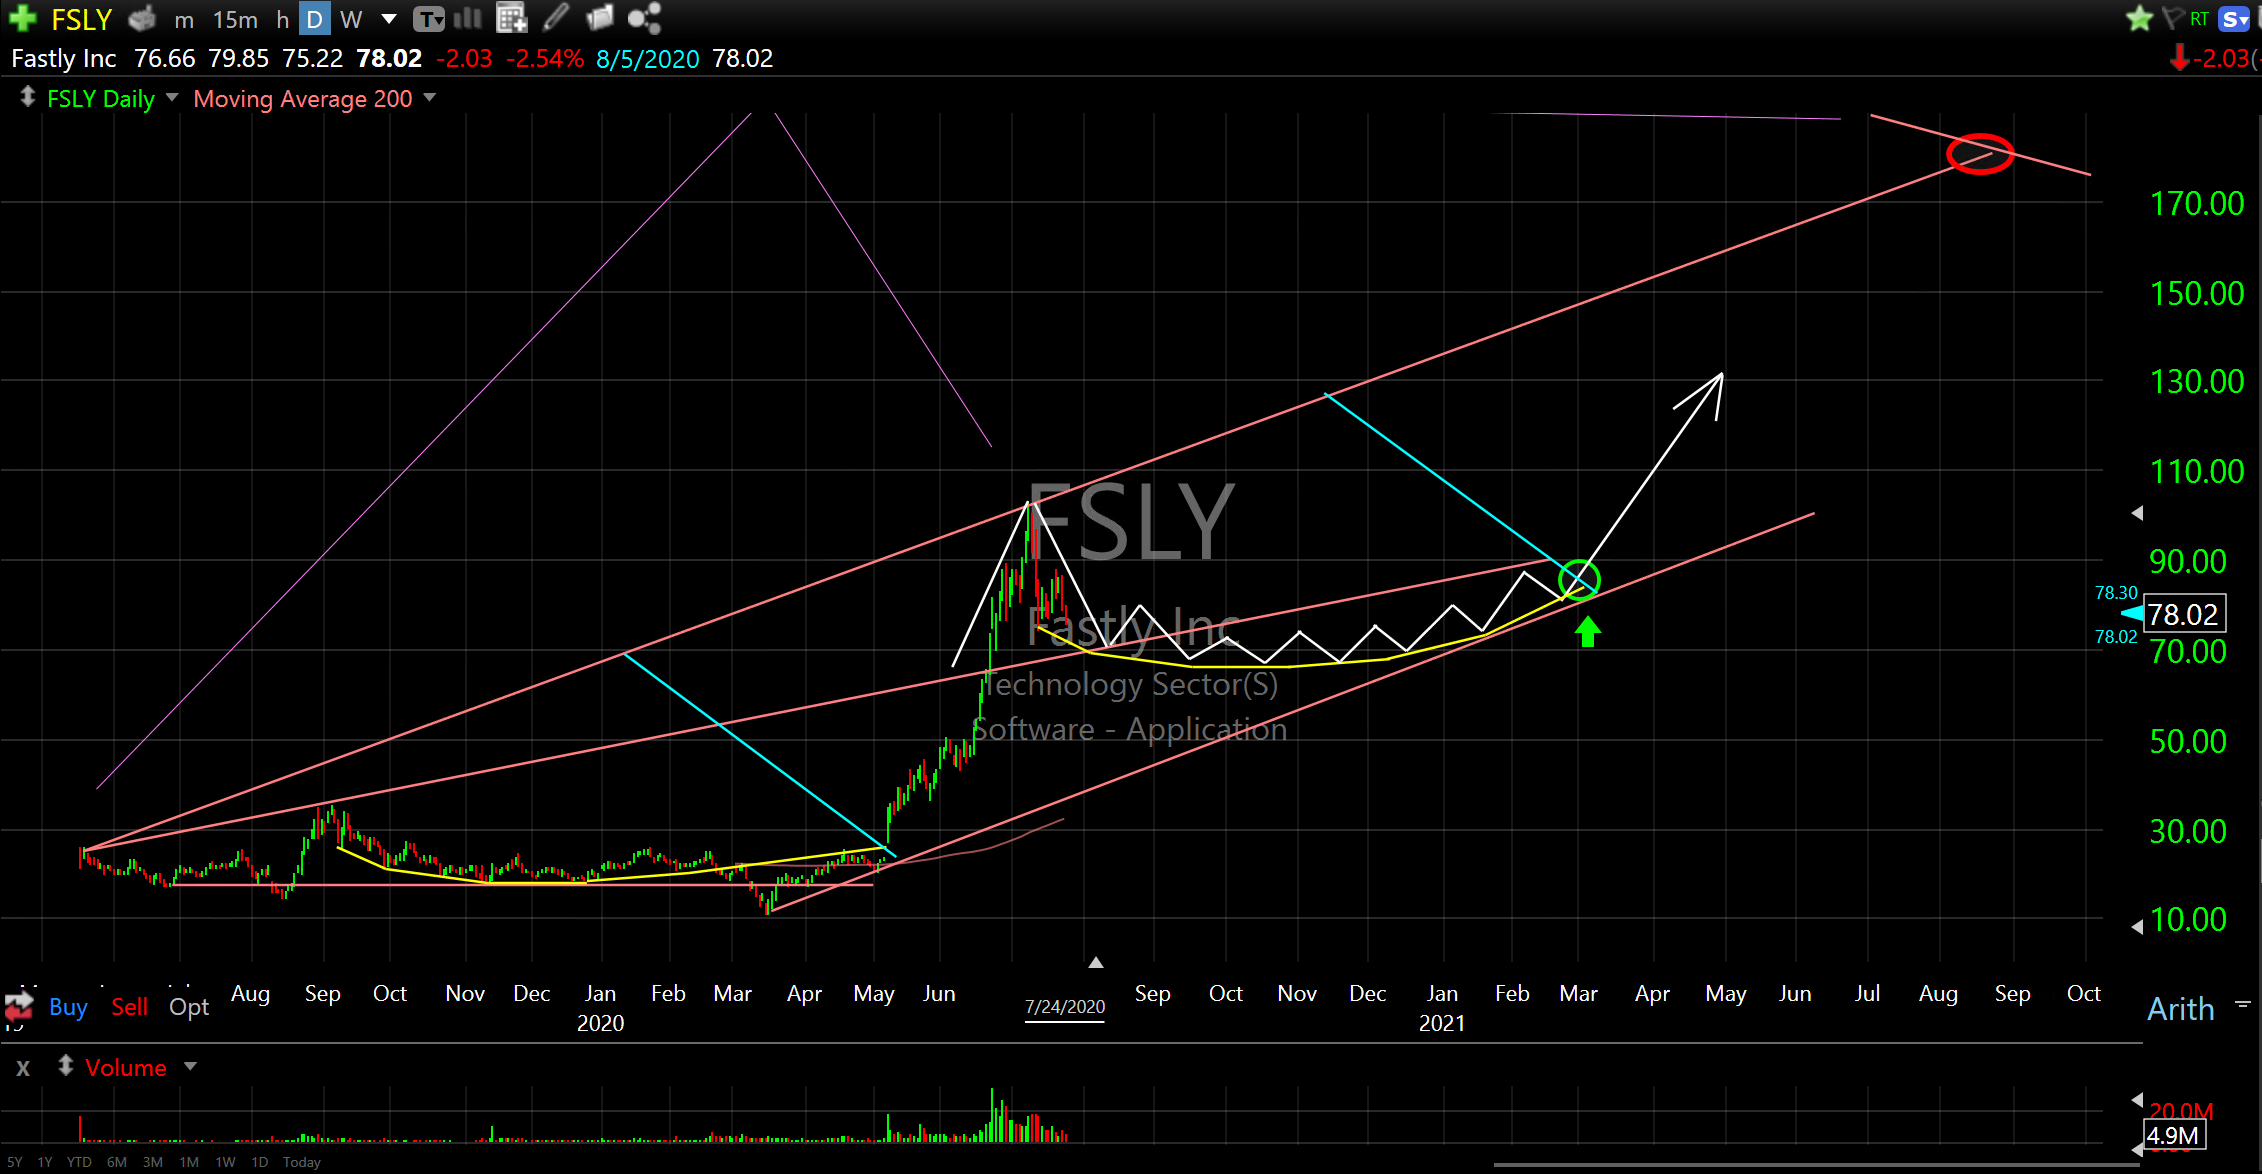
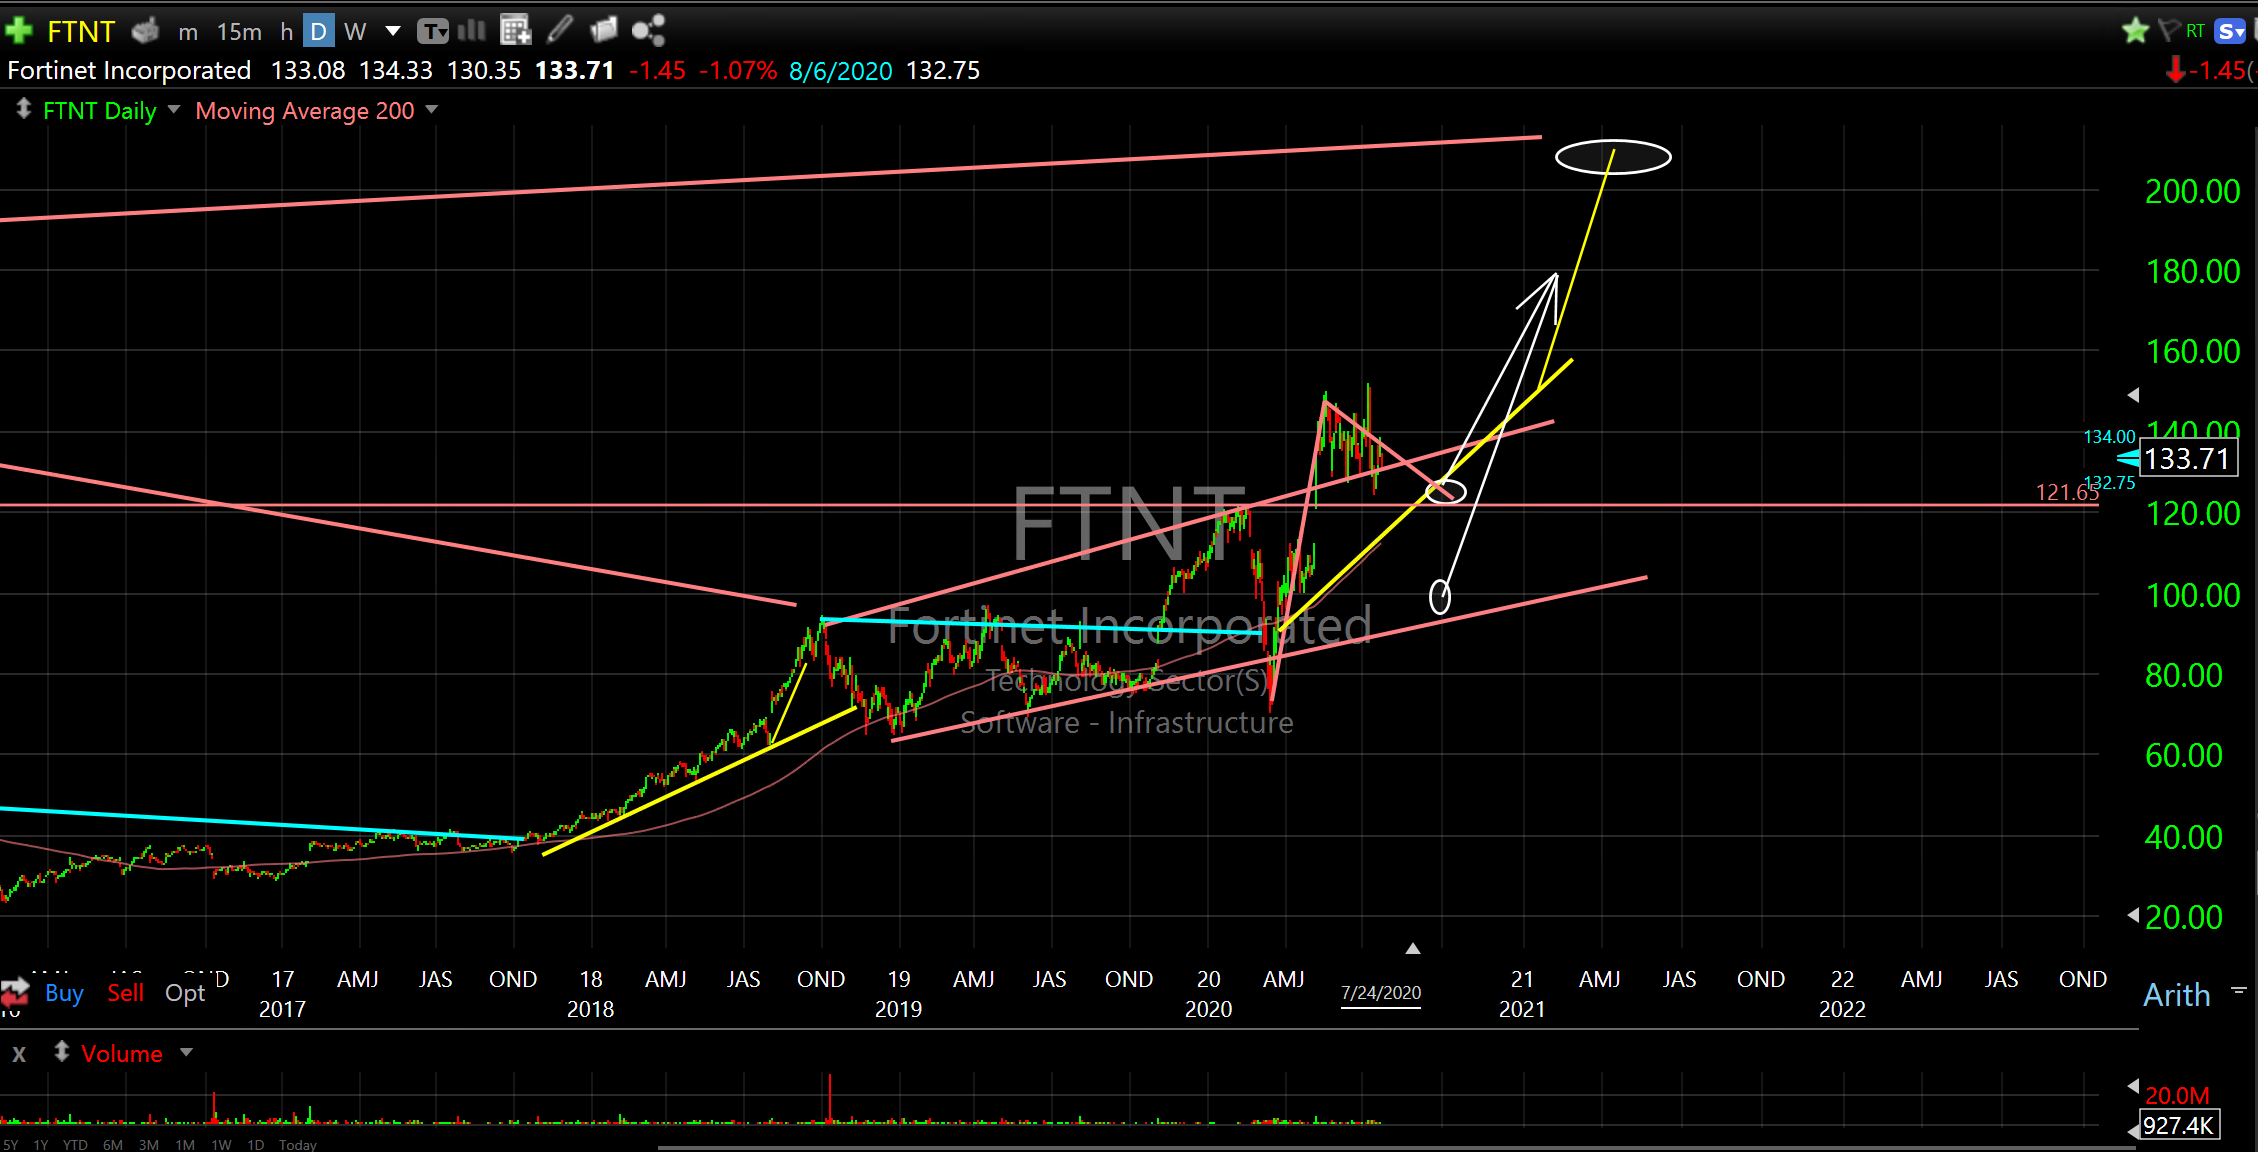
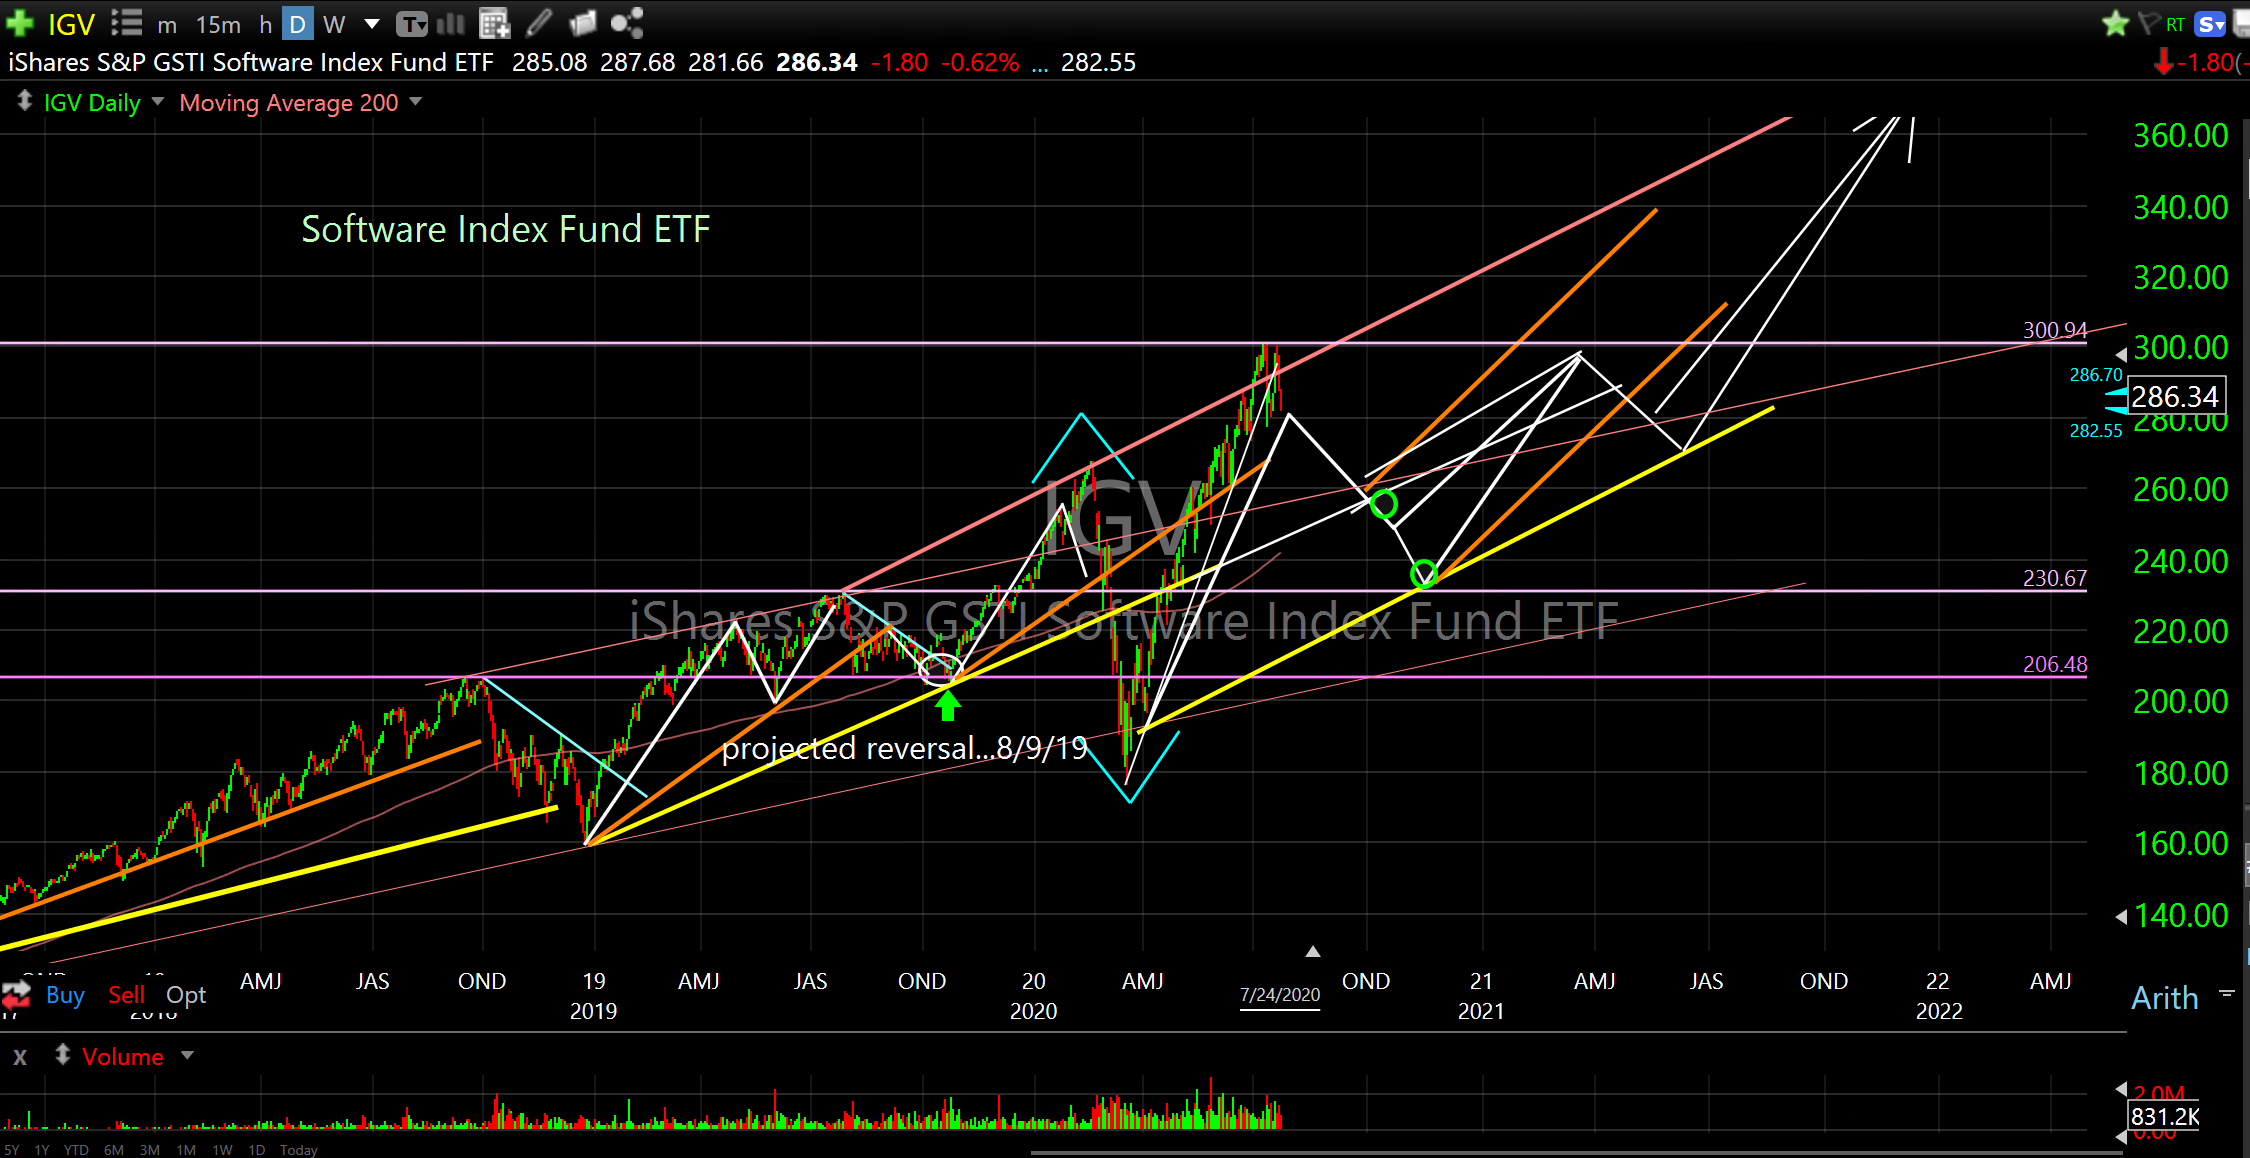
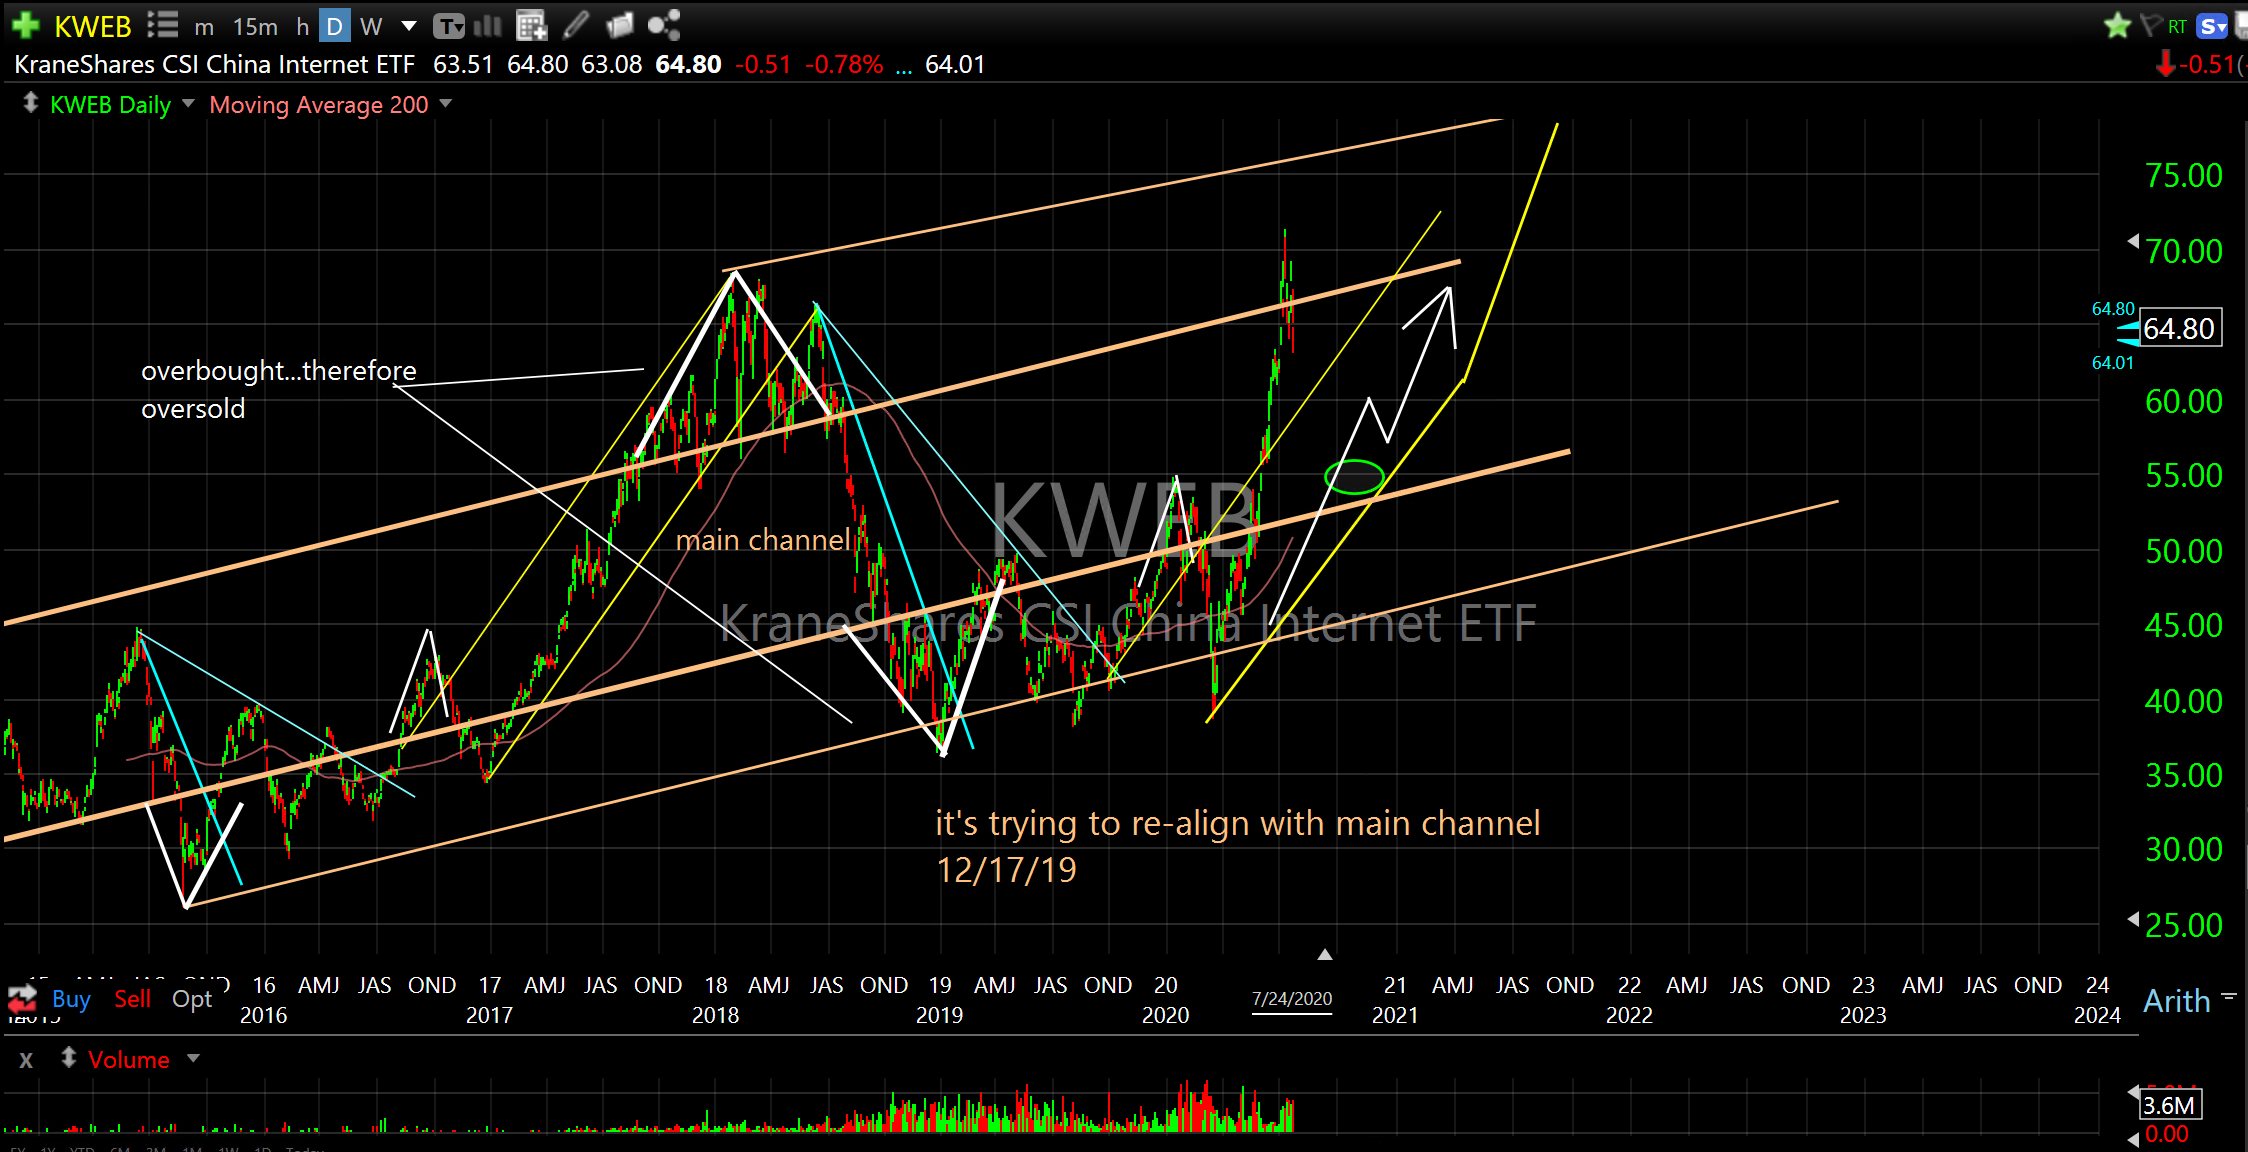
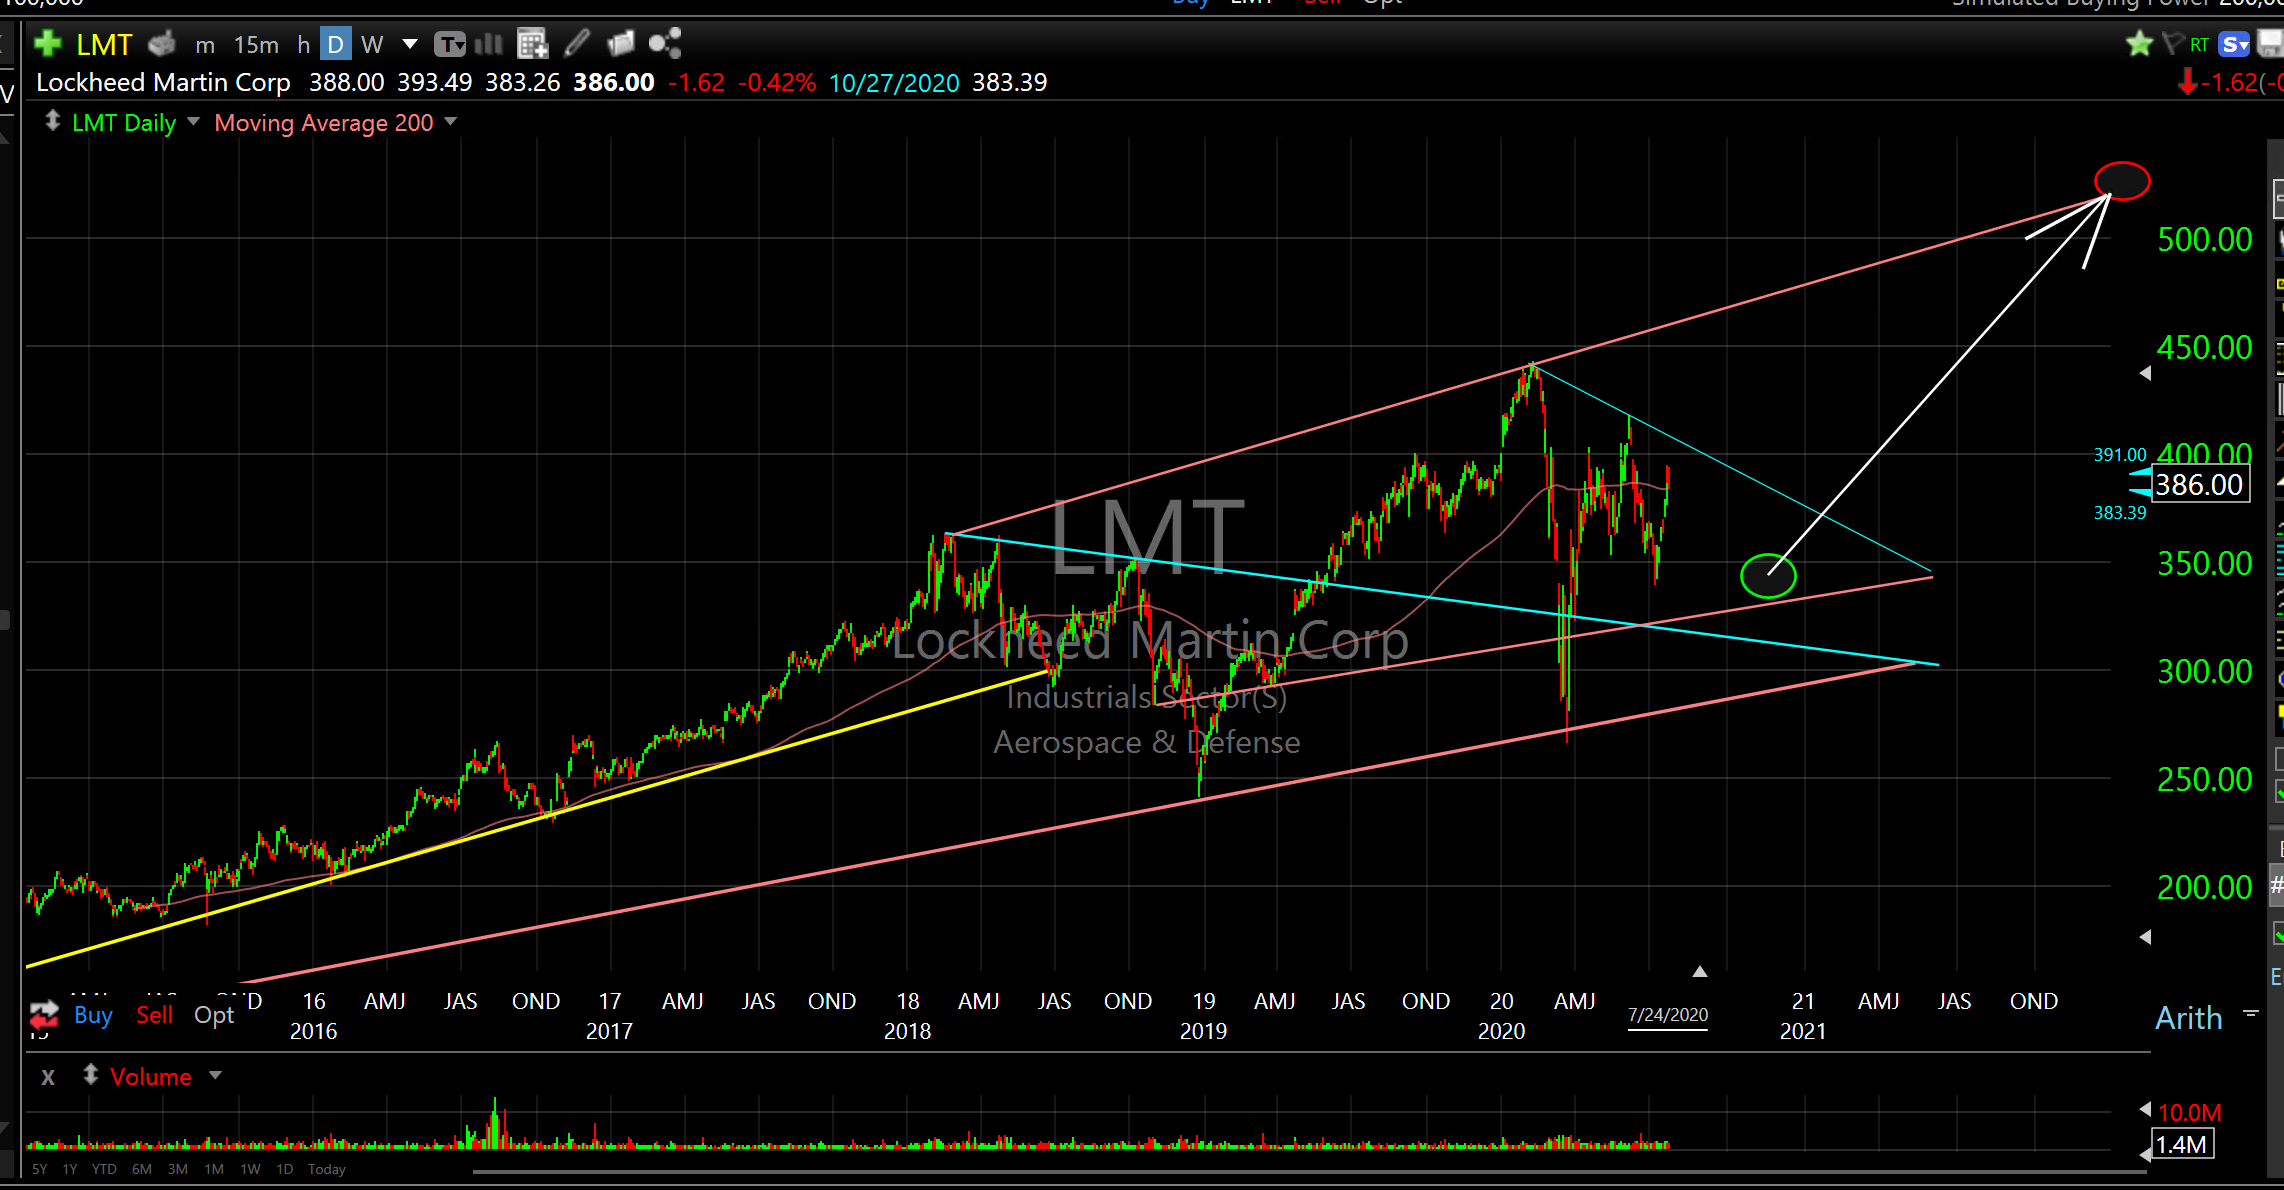
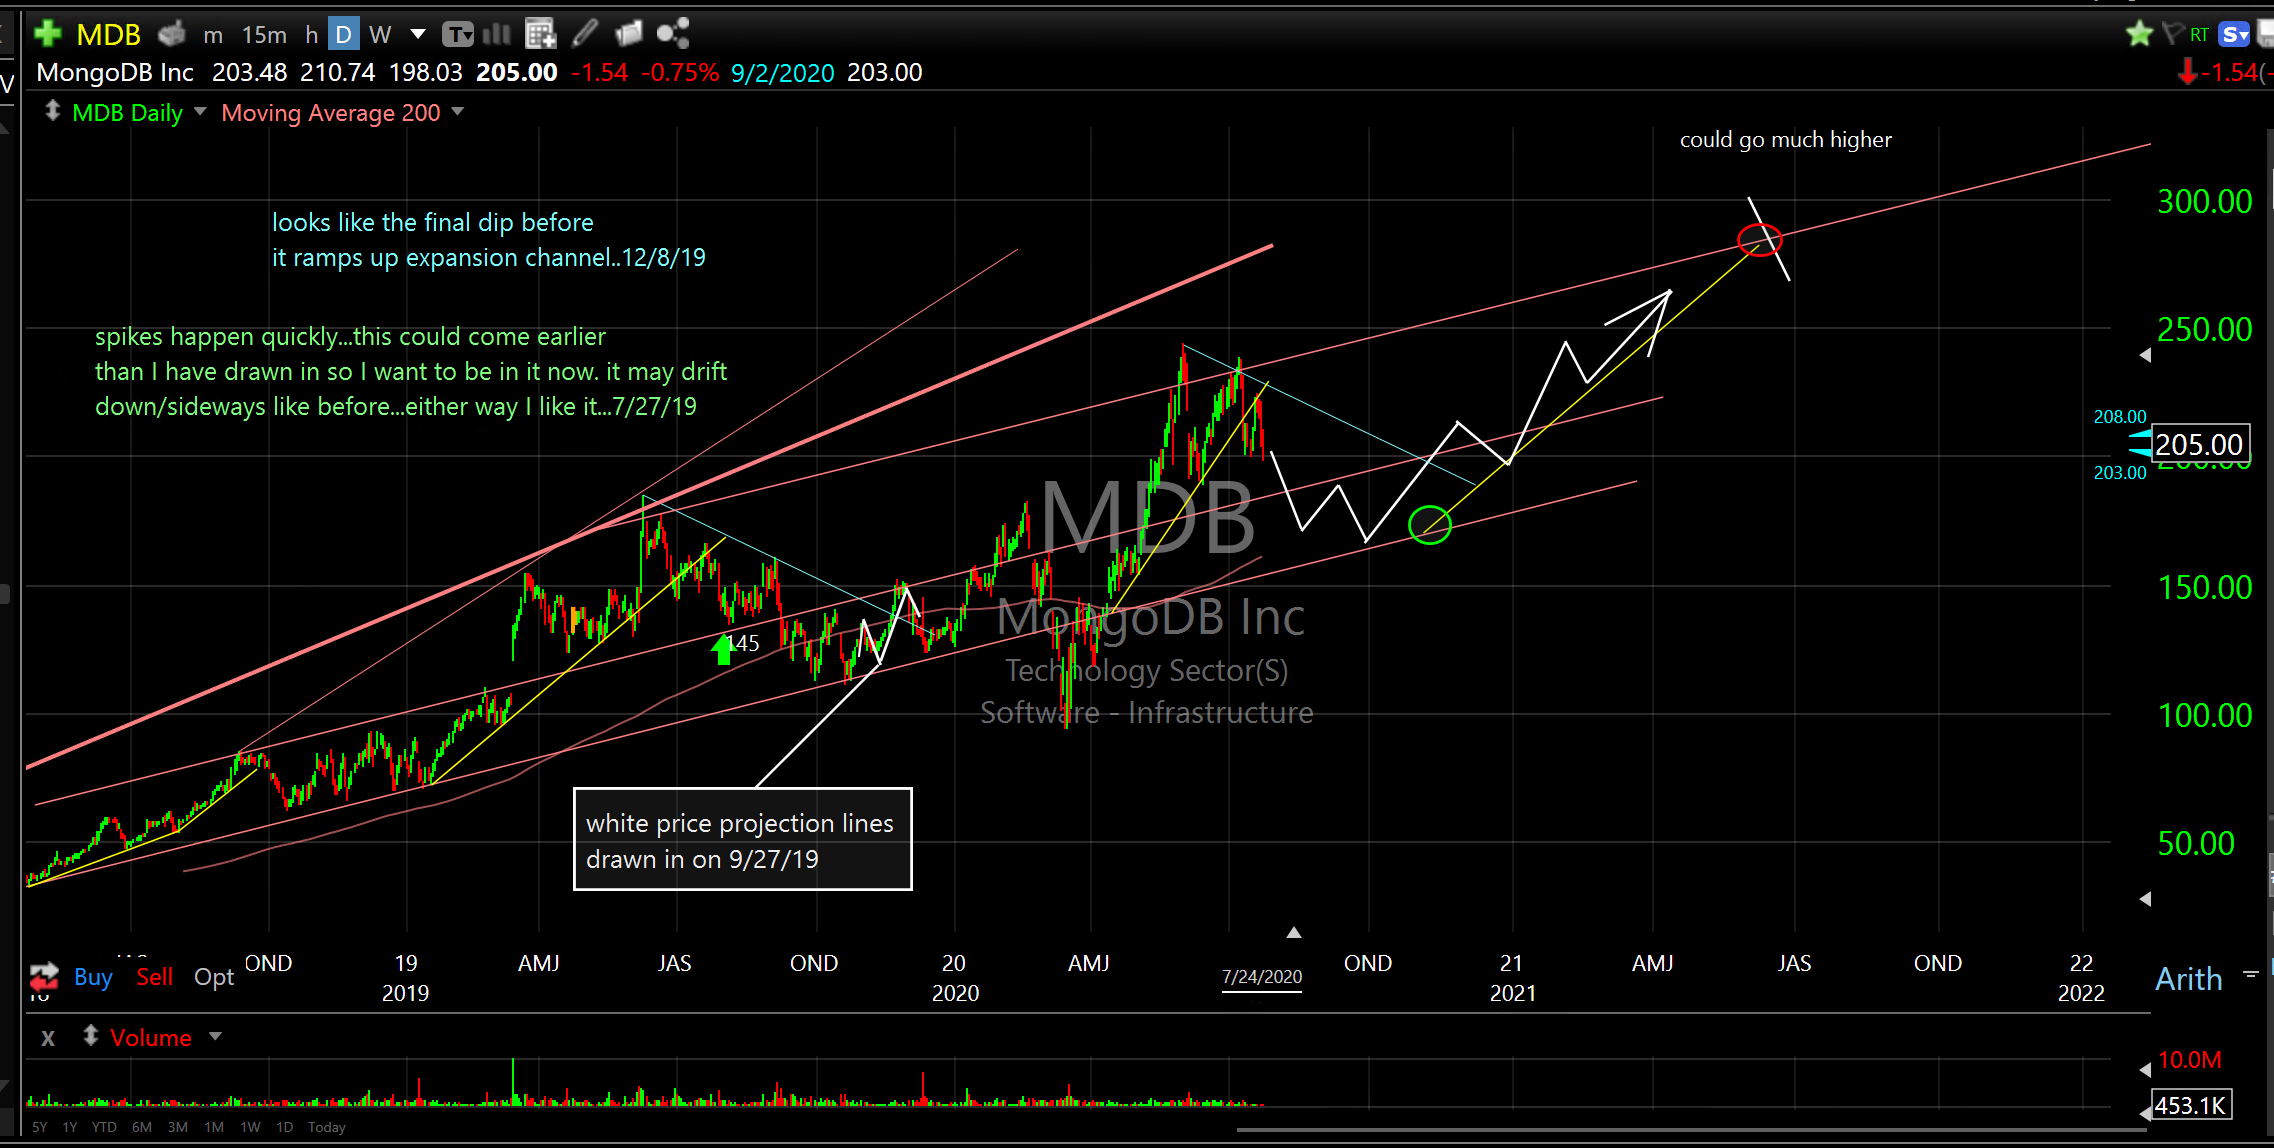
In anticipation of lower entries into the election this is week three of highlighting those individual stocks and ETF’s that I expect to perform the best during the next important leg up. I continue to love technology, especially software. While software companies are extremely vulnerable now, like they were last fall, I expect they will continue to outperform once we get the secondary dip.
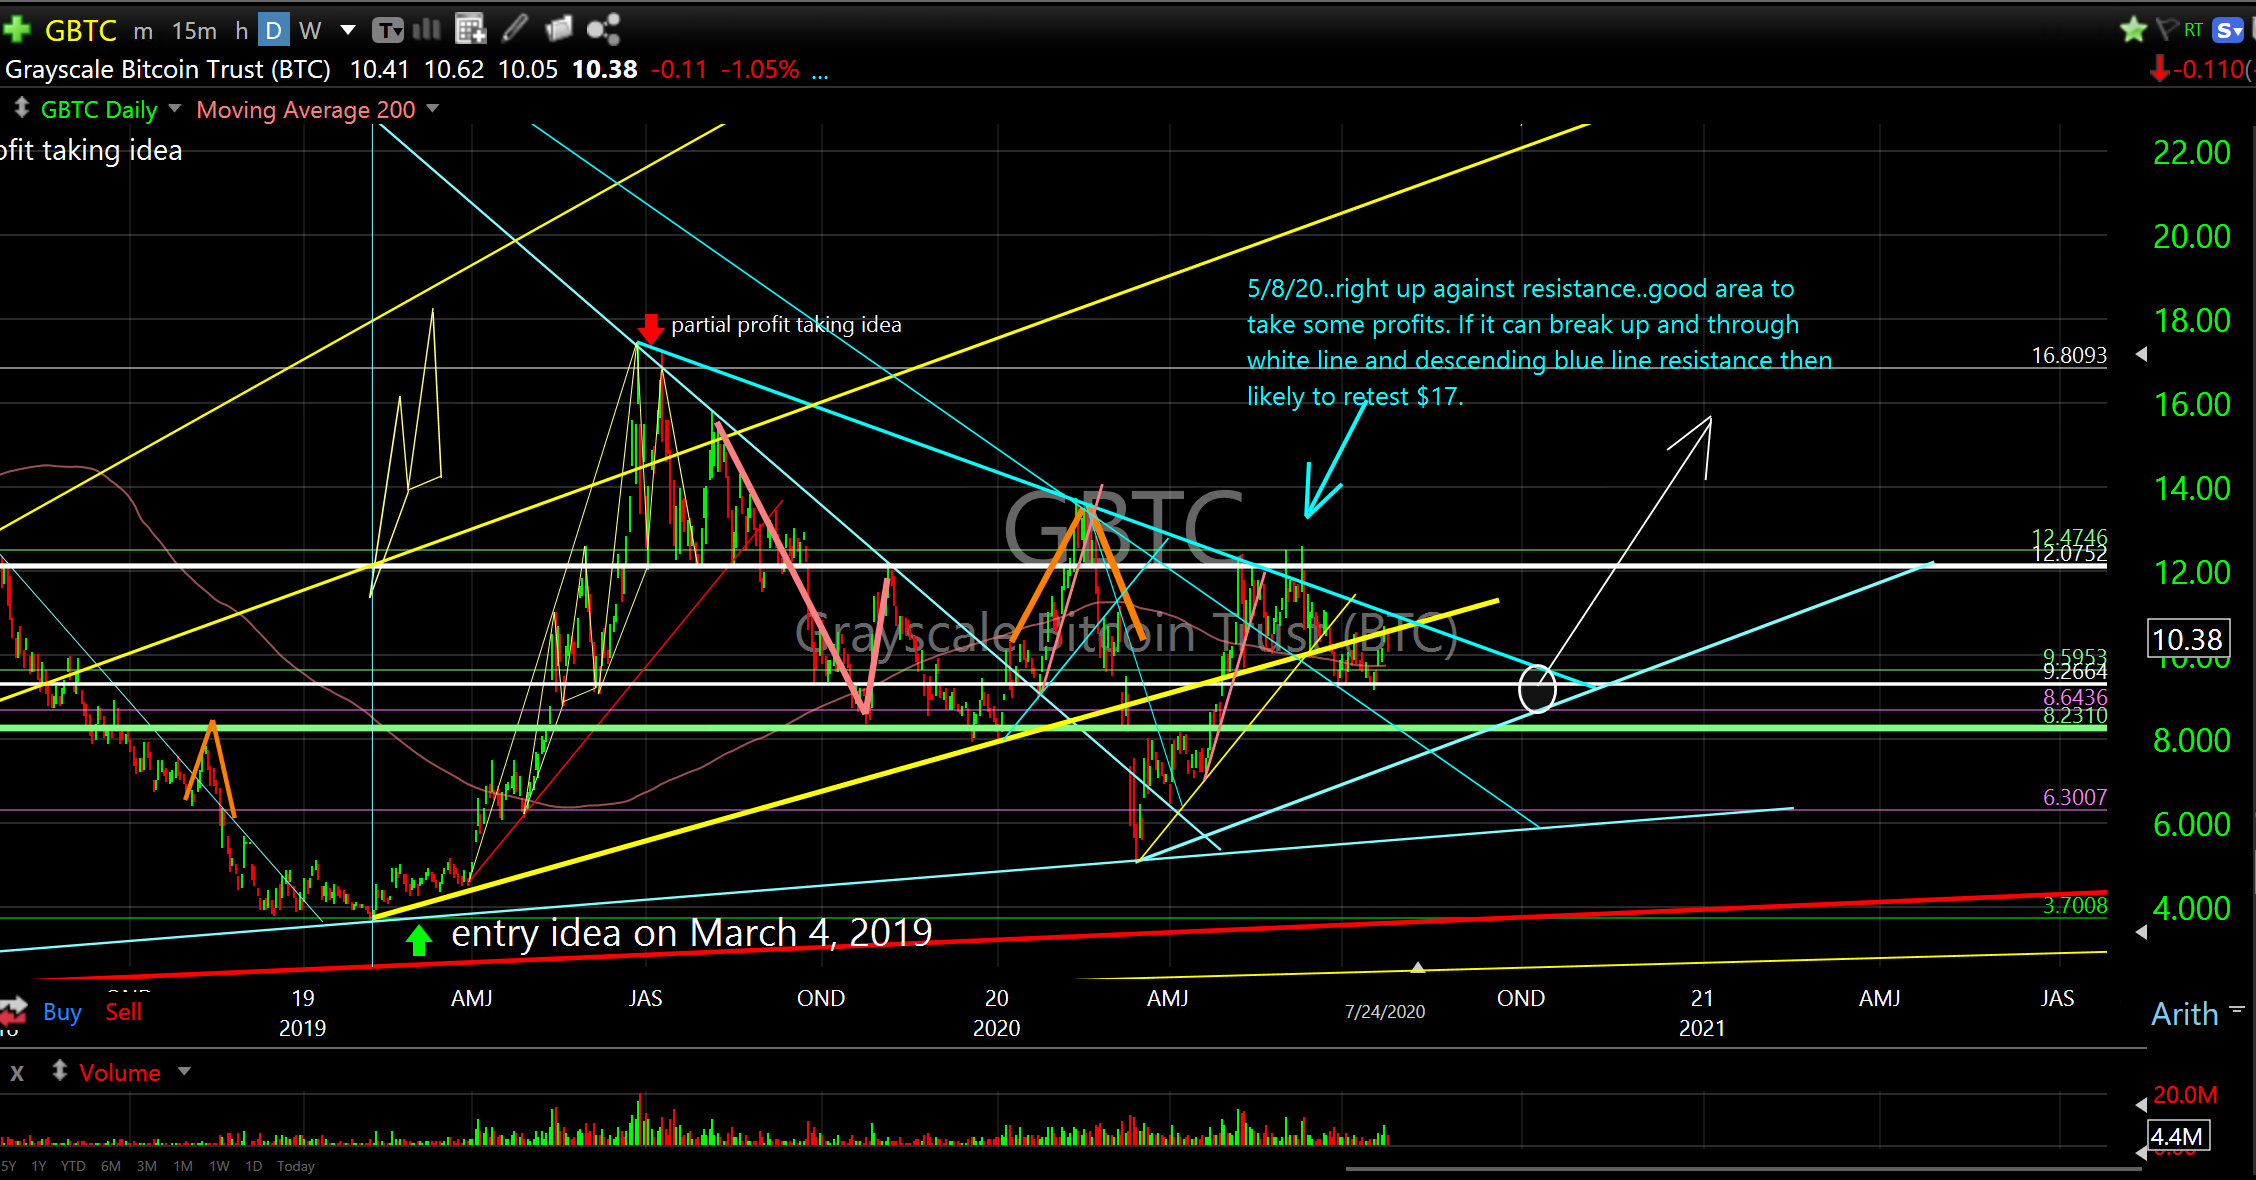
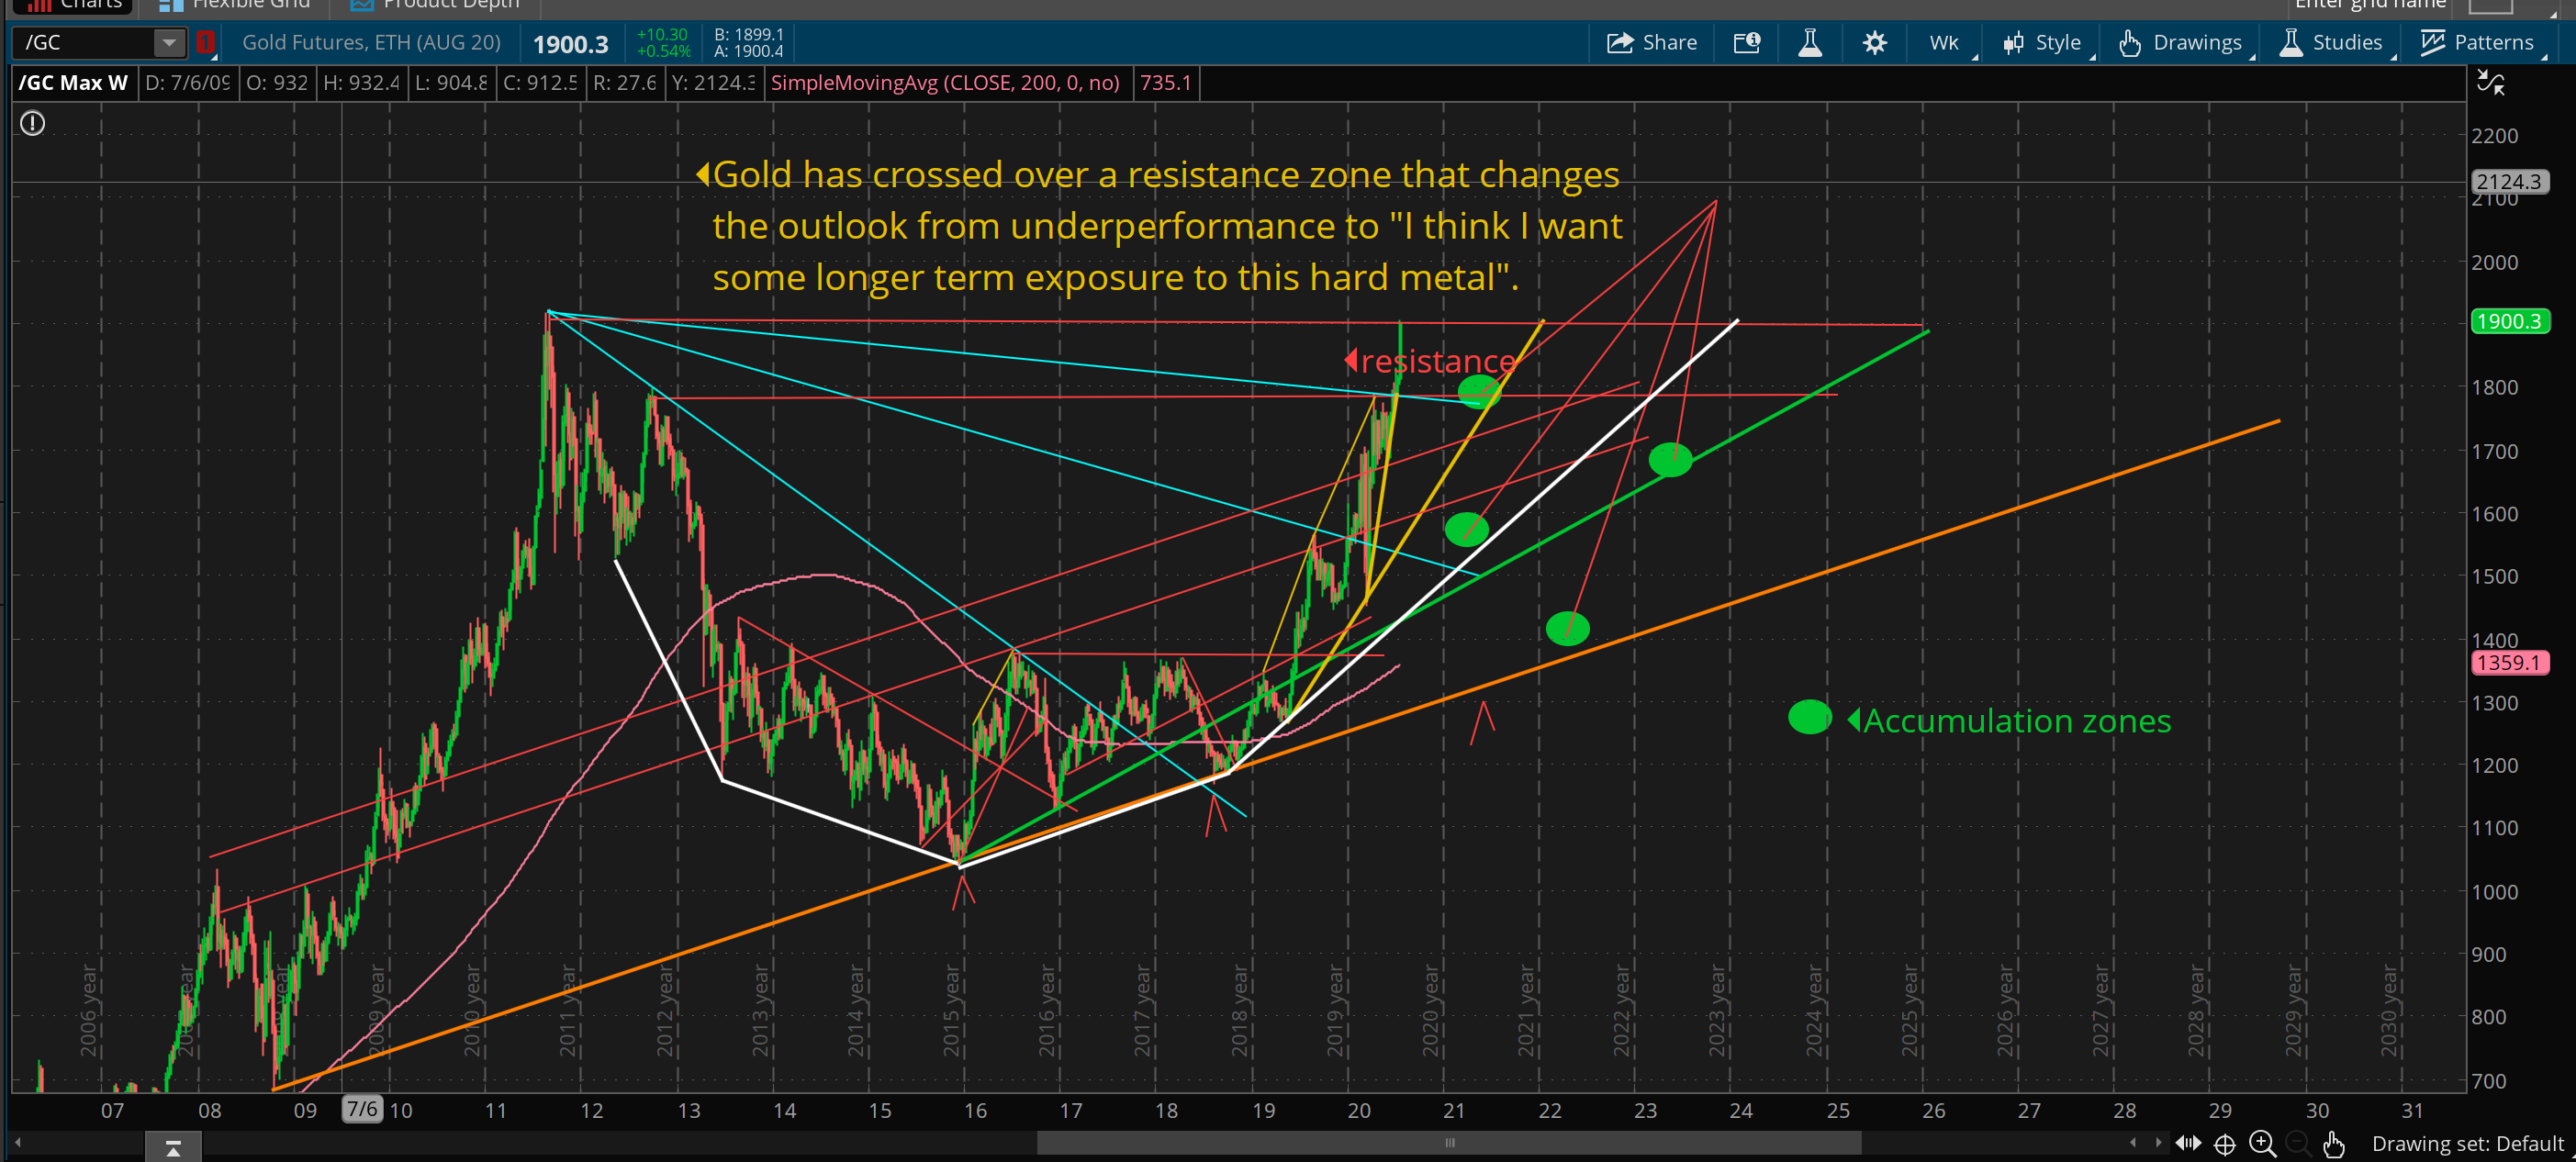
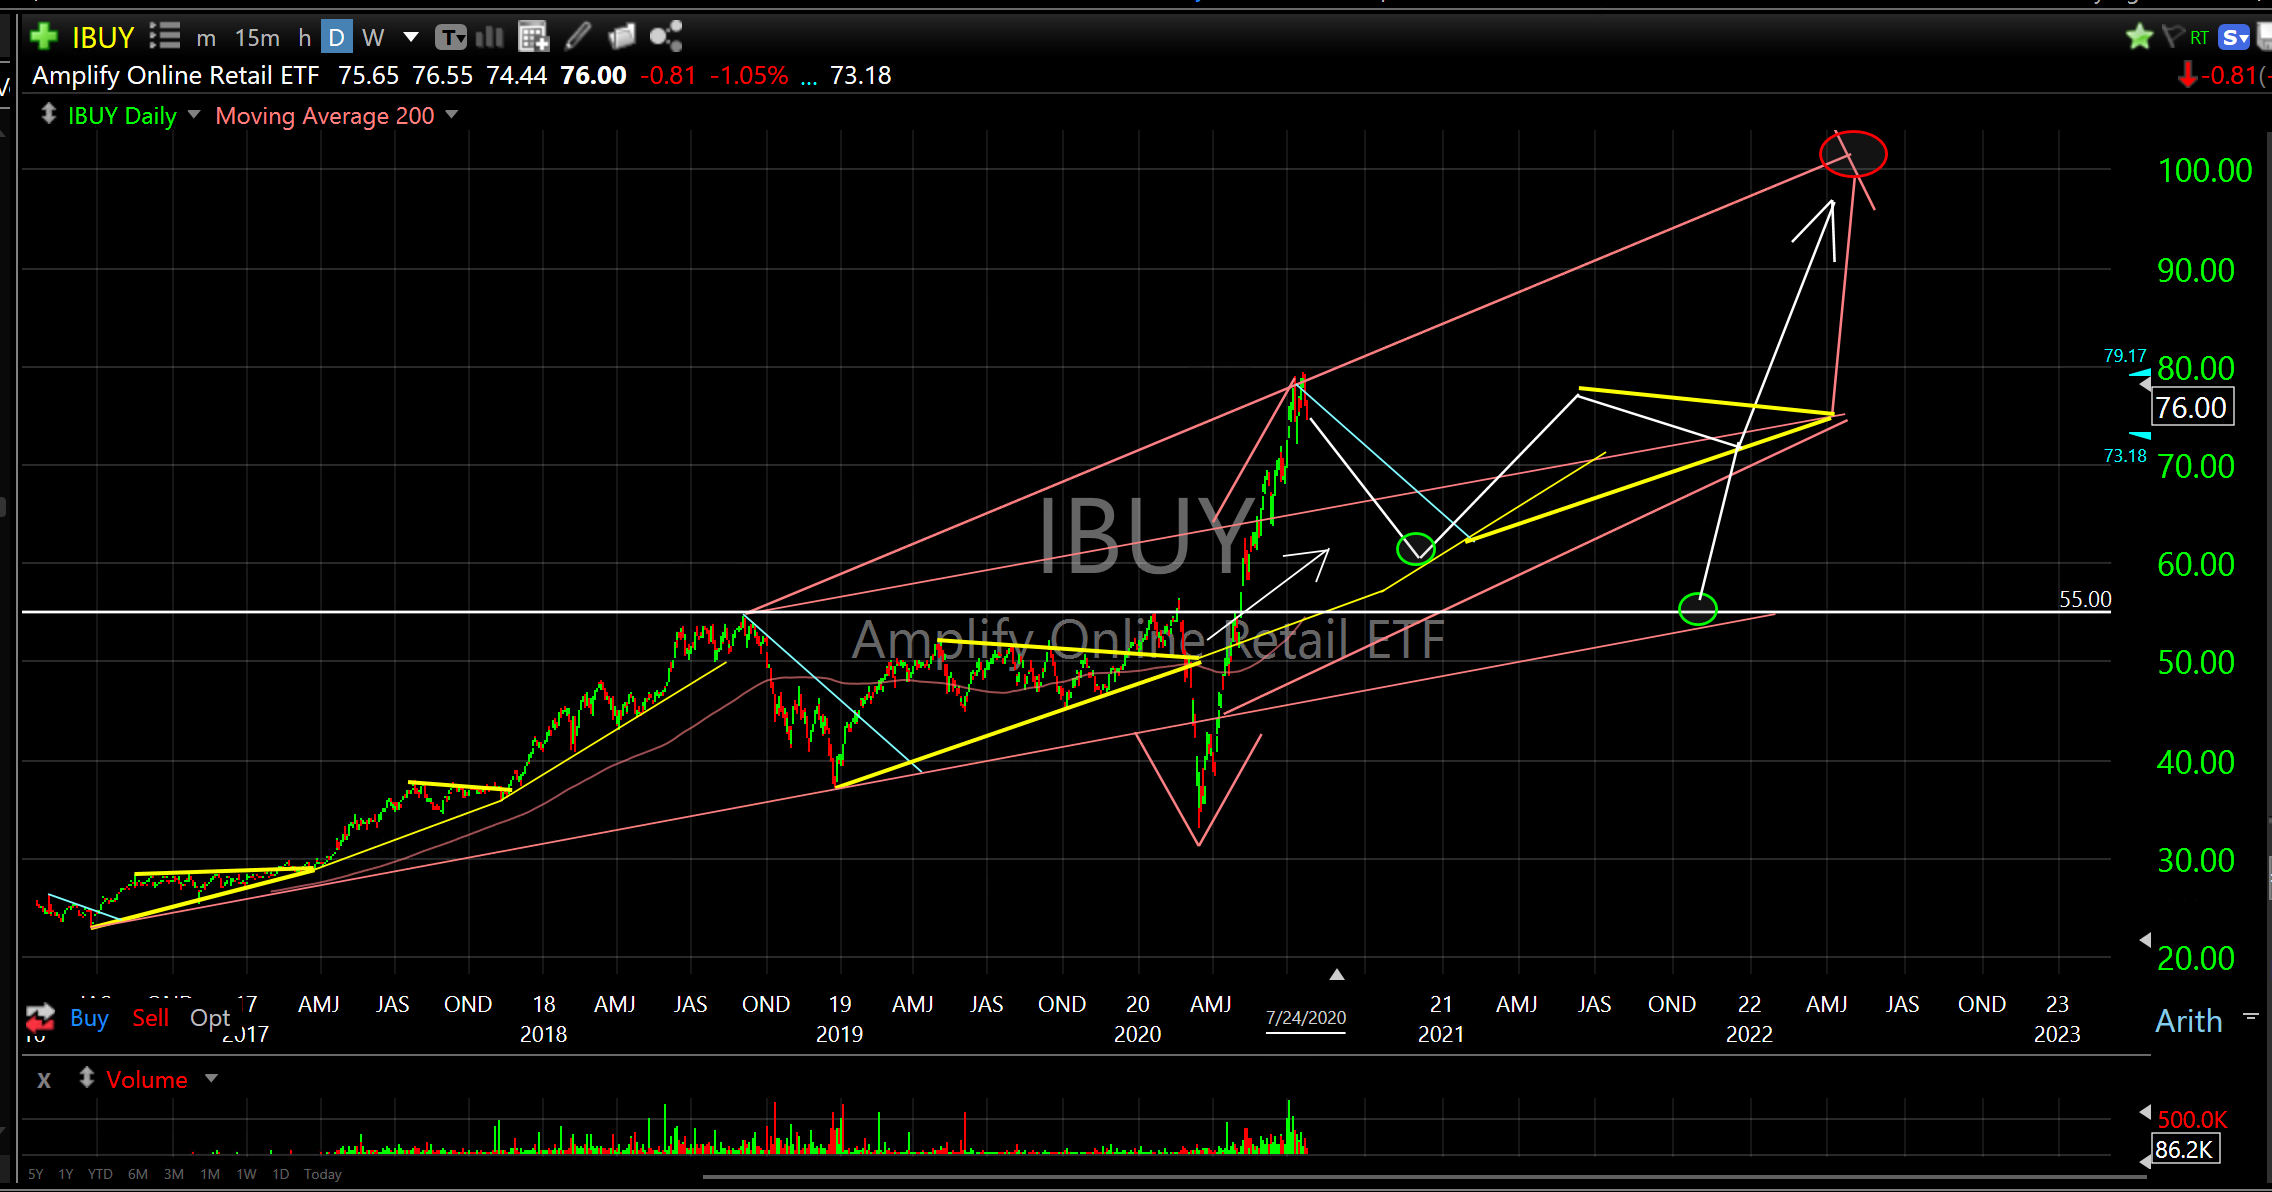
Please note the prime lower forecast Entry Zones/Reversals highlighted below.
FICO
FSLY
FTNT
GBTC
Gold
IBUY
IGV
KWEB
LMT
MDB
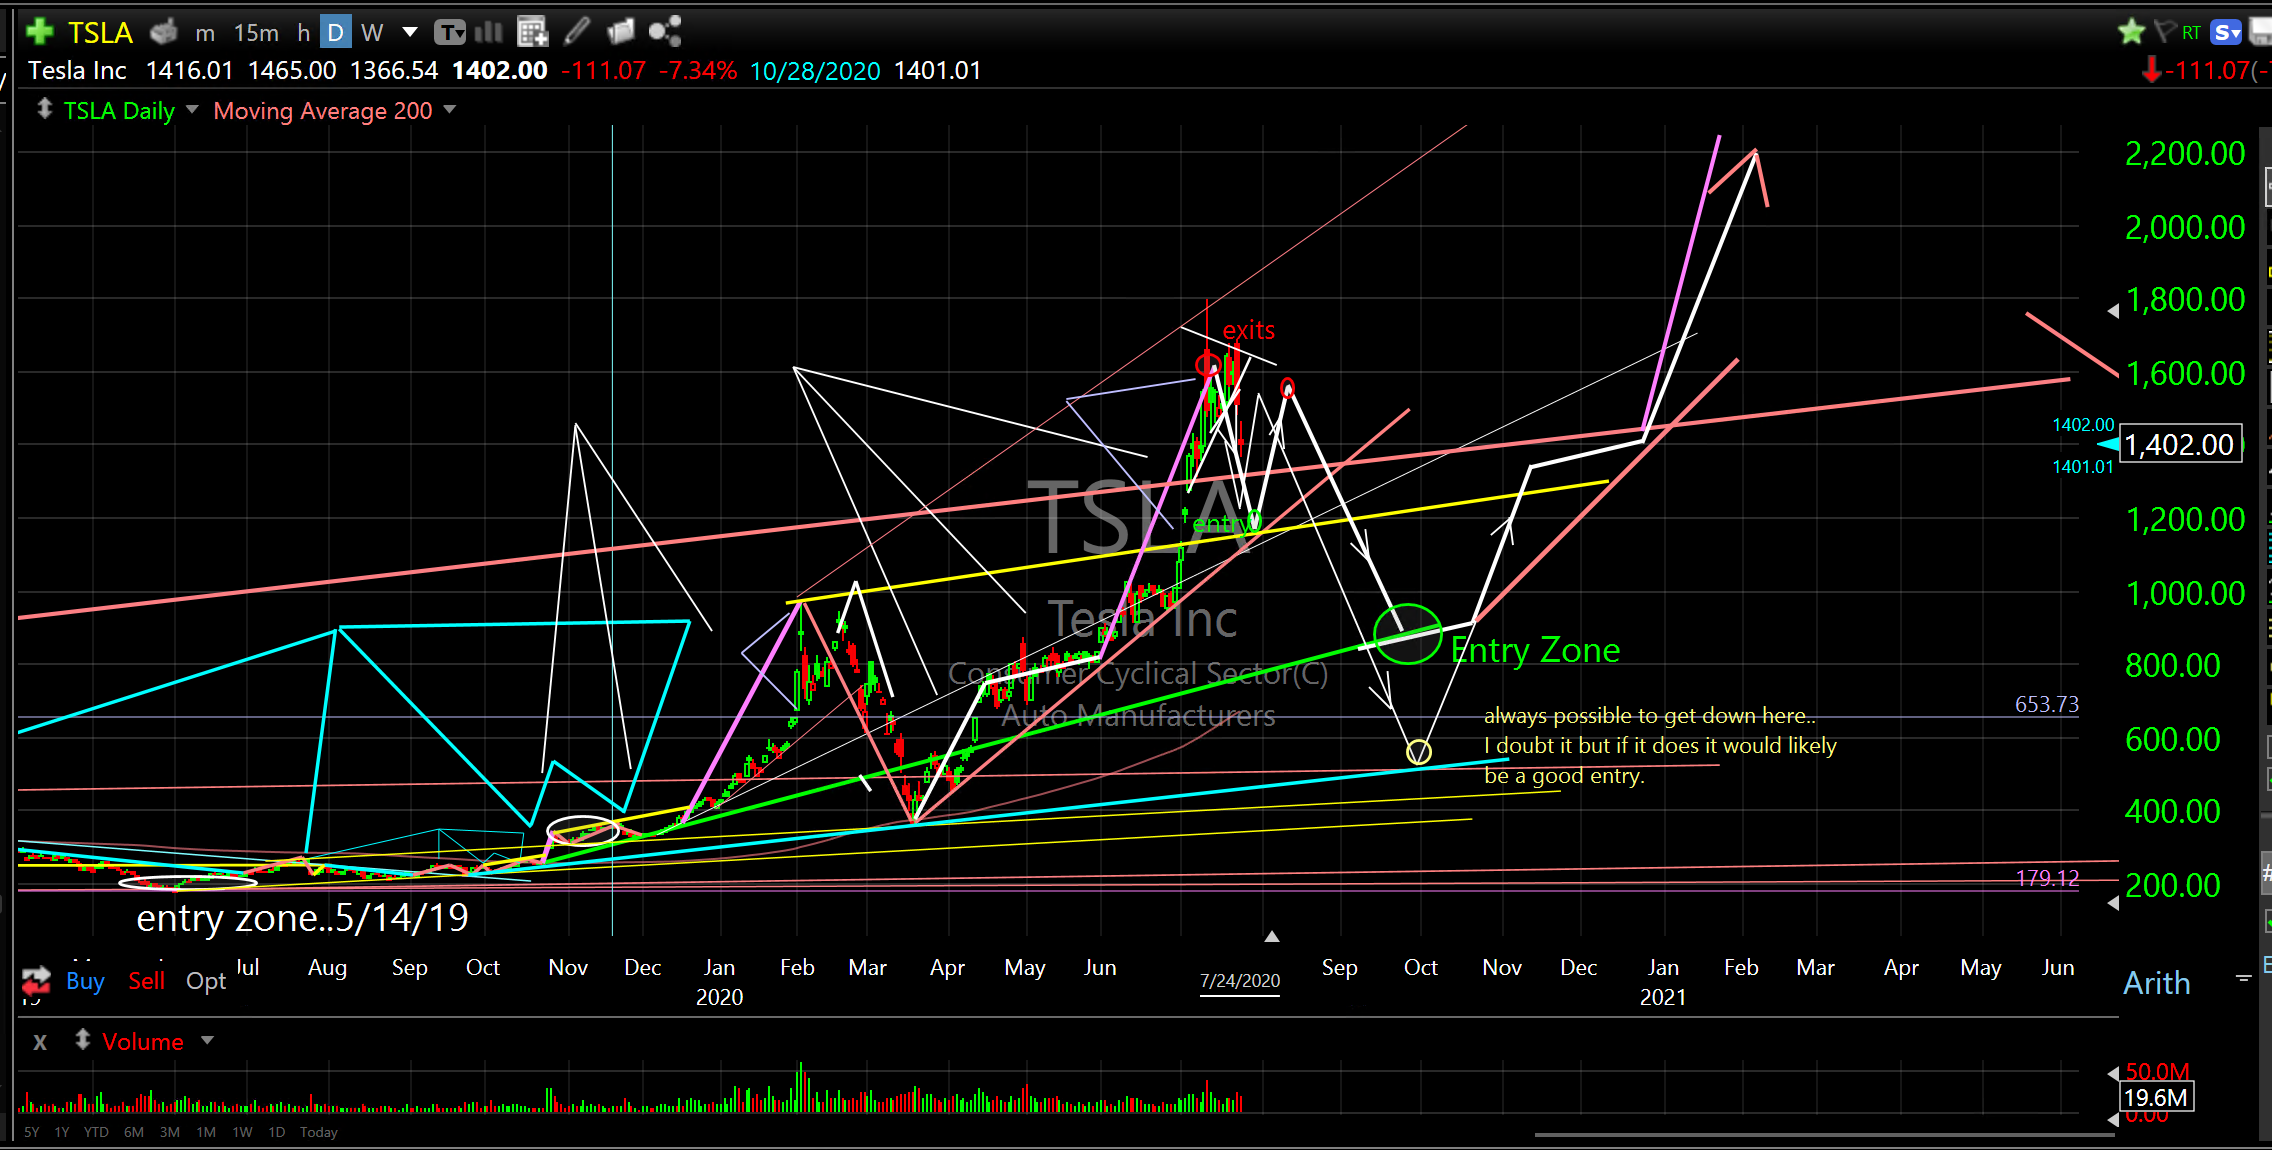
I include, again, my forecast for TSLA because I love all things Elon. Zoom Zoom
TSLA
There are many layers of analysis we should use in forecasting equity/debt prices. The layer I provide is not really even known to exist but in my humble opinion it is actually the most accurate.
That’s all folks,
Don