Friday, May 29, 2020
The Dow surged 1,000 points last week and is playing out as I described in my last commentary. It has broken up and out of the consolidation zone it has been in since early April and looks like it wants to complete the cycle from the Corona Crash Bottom like it began, with a reflective surge.
Short term we might get a small pullback early in the week down to the 24,800 level but it sure looks like it is headed up to challenge 27,000 which is strong resistance and a major inflection point.
Dow futures (YM)..5/30/20
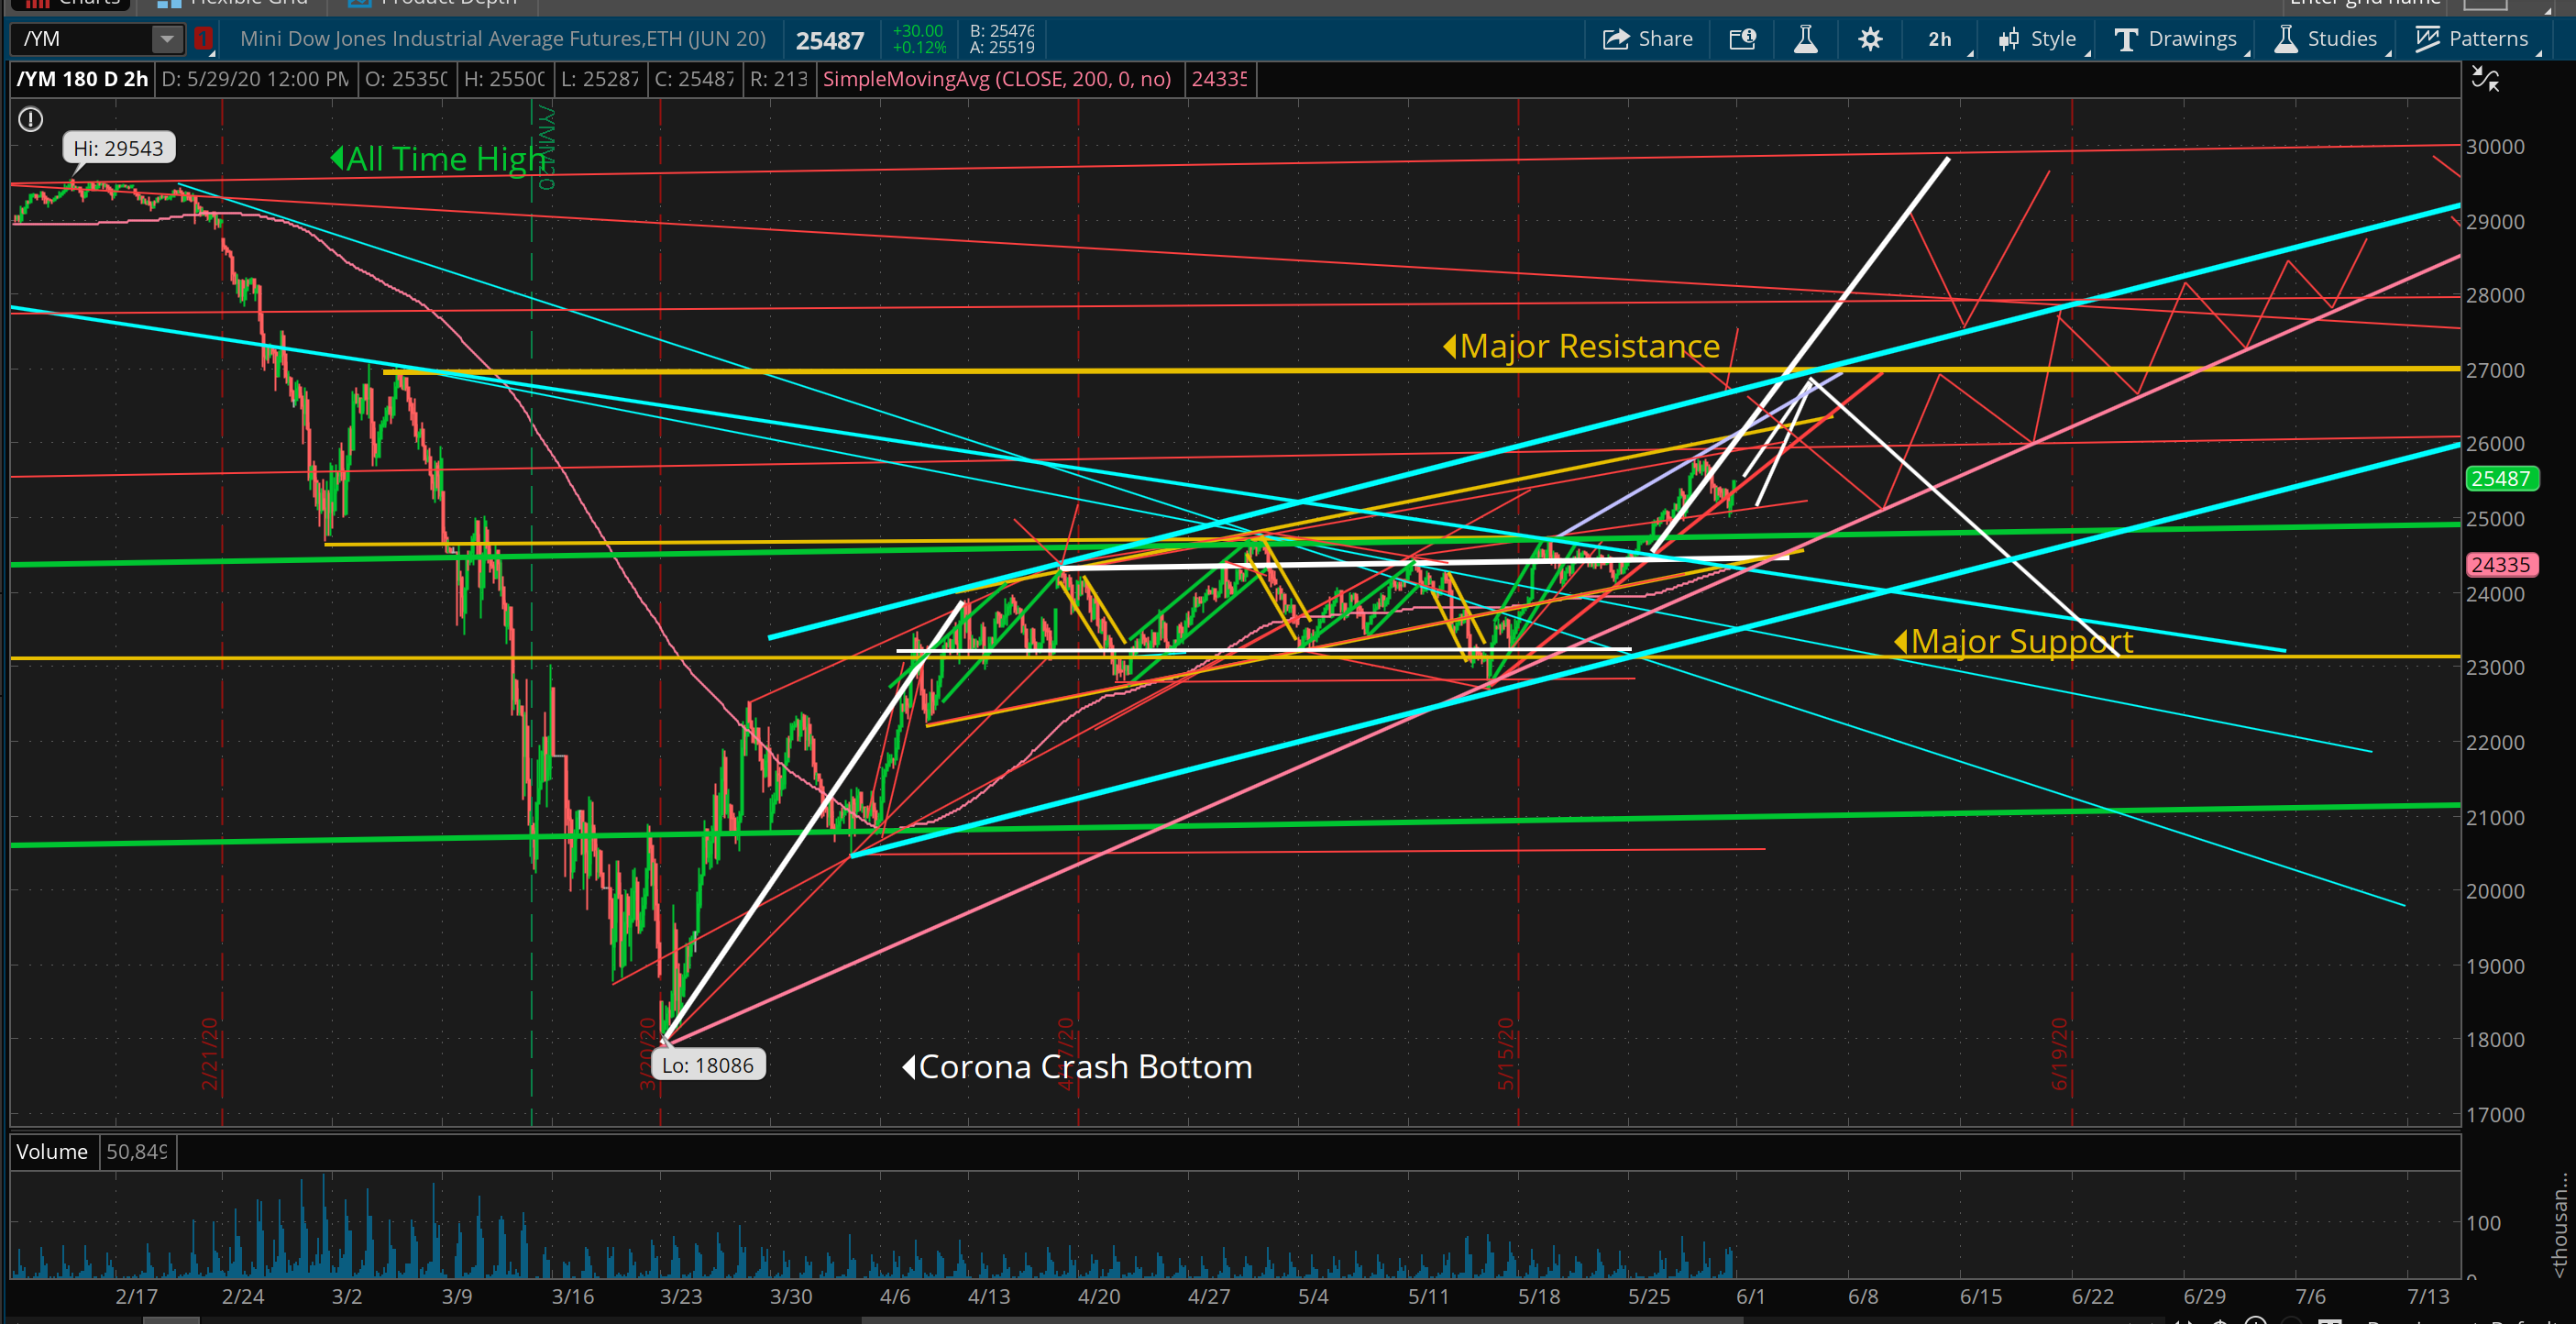
If we fail to break up through 27,000 we could get a pretty robust sell off from this area. If this does occur, the current support zones are the pink, green, blue and yellow lines, in that order. Each of these support zones can be viewed as incremental buying zones. Major support is around 23,000 (yellow line) but I don’t think it needs to get that low.
Dow futures (YM)..Inflection Point
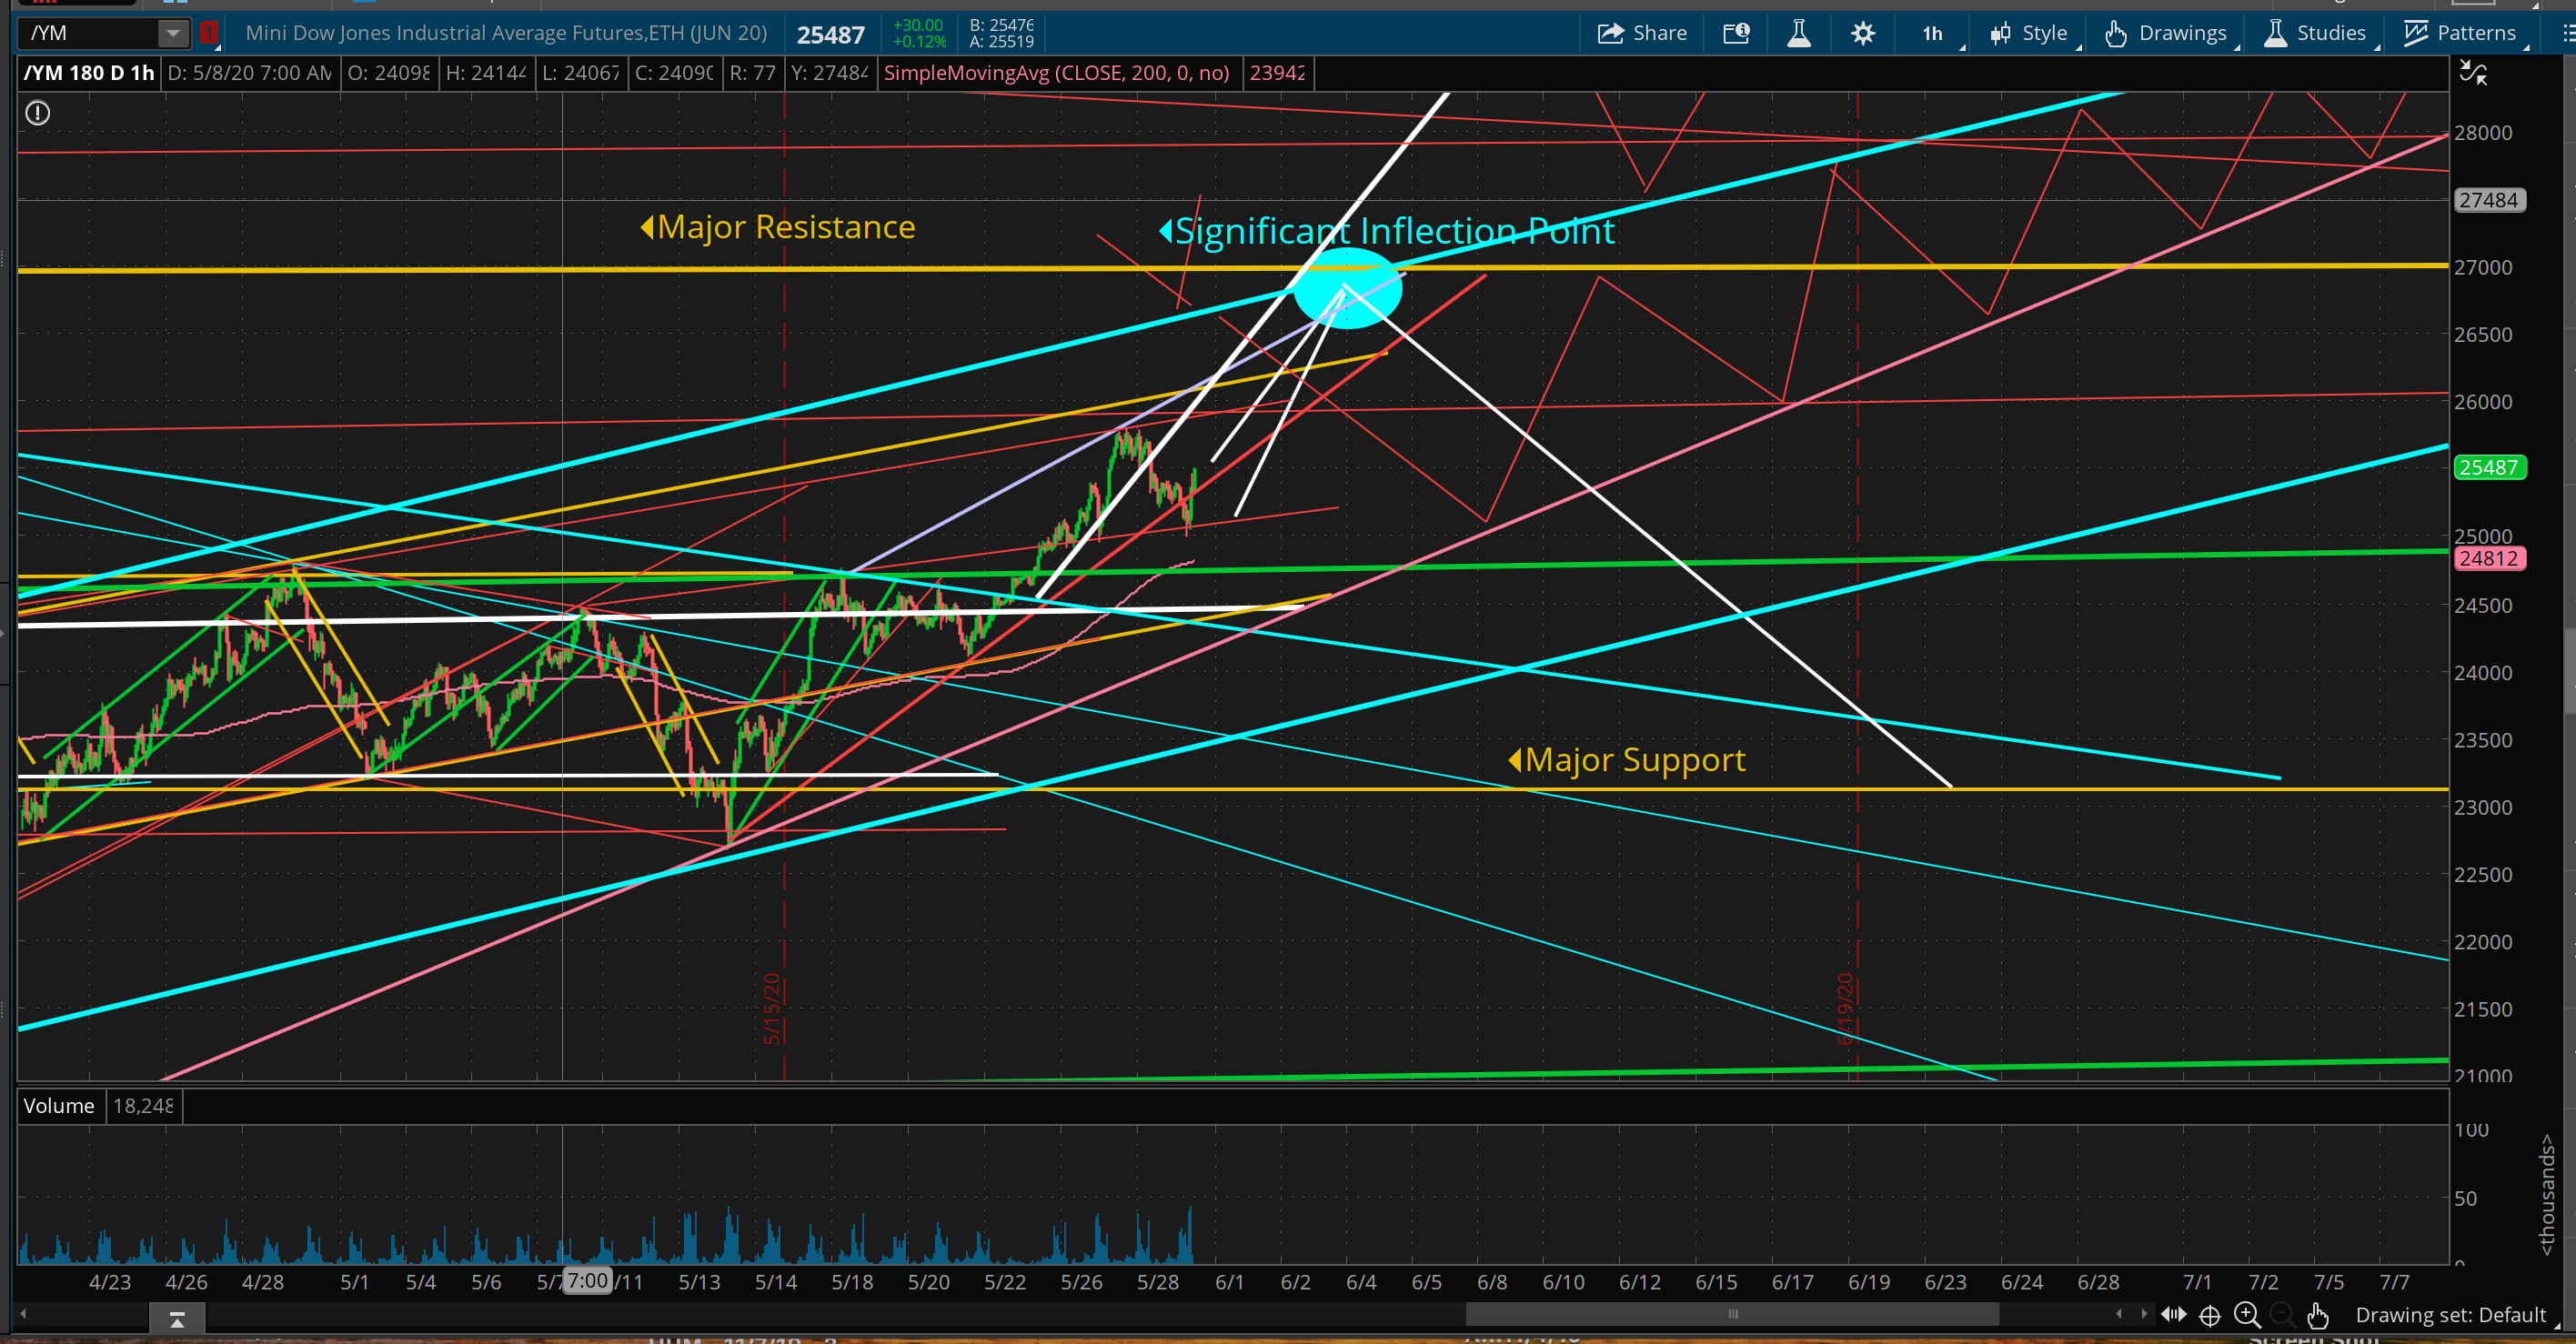
Between now and 27,000 can be viewed as a selling or hedging opportunity and as we approach this significant inflection point the risk for a correction increases. As we knew the Corona Crash Bottom at 18,000 was a significant reversal inflection point even before it happened, we know that 27,000 is a significant inflection point where a reversal becomes likely.
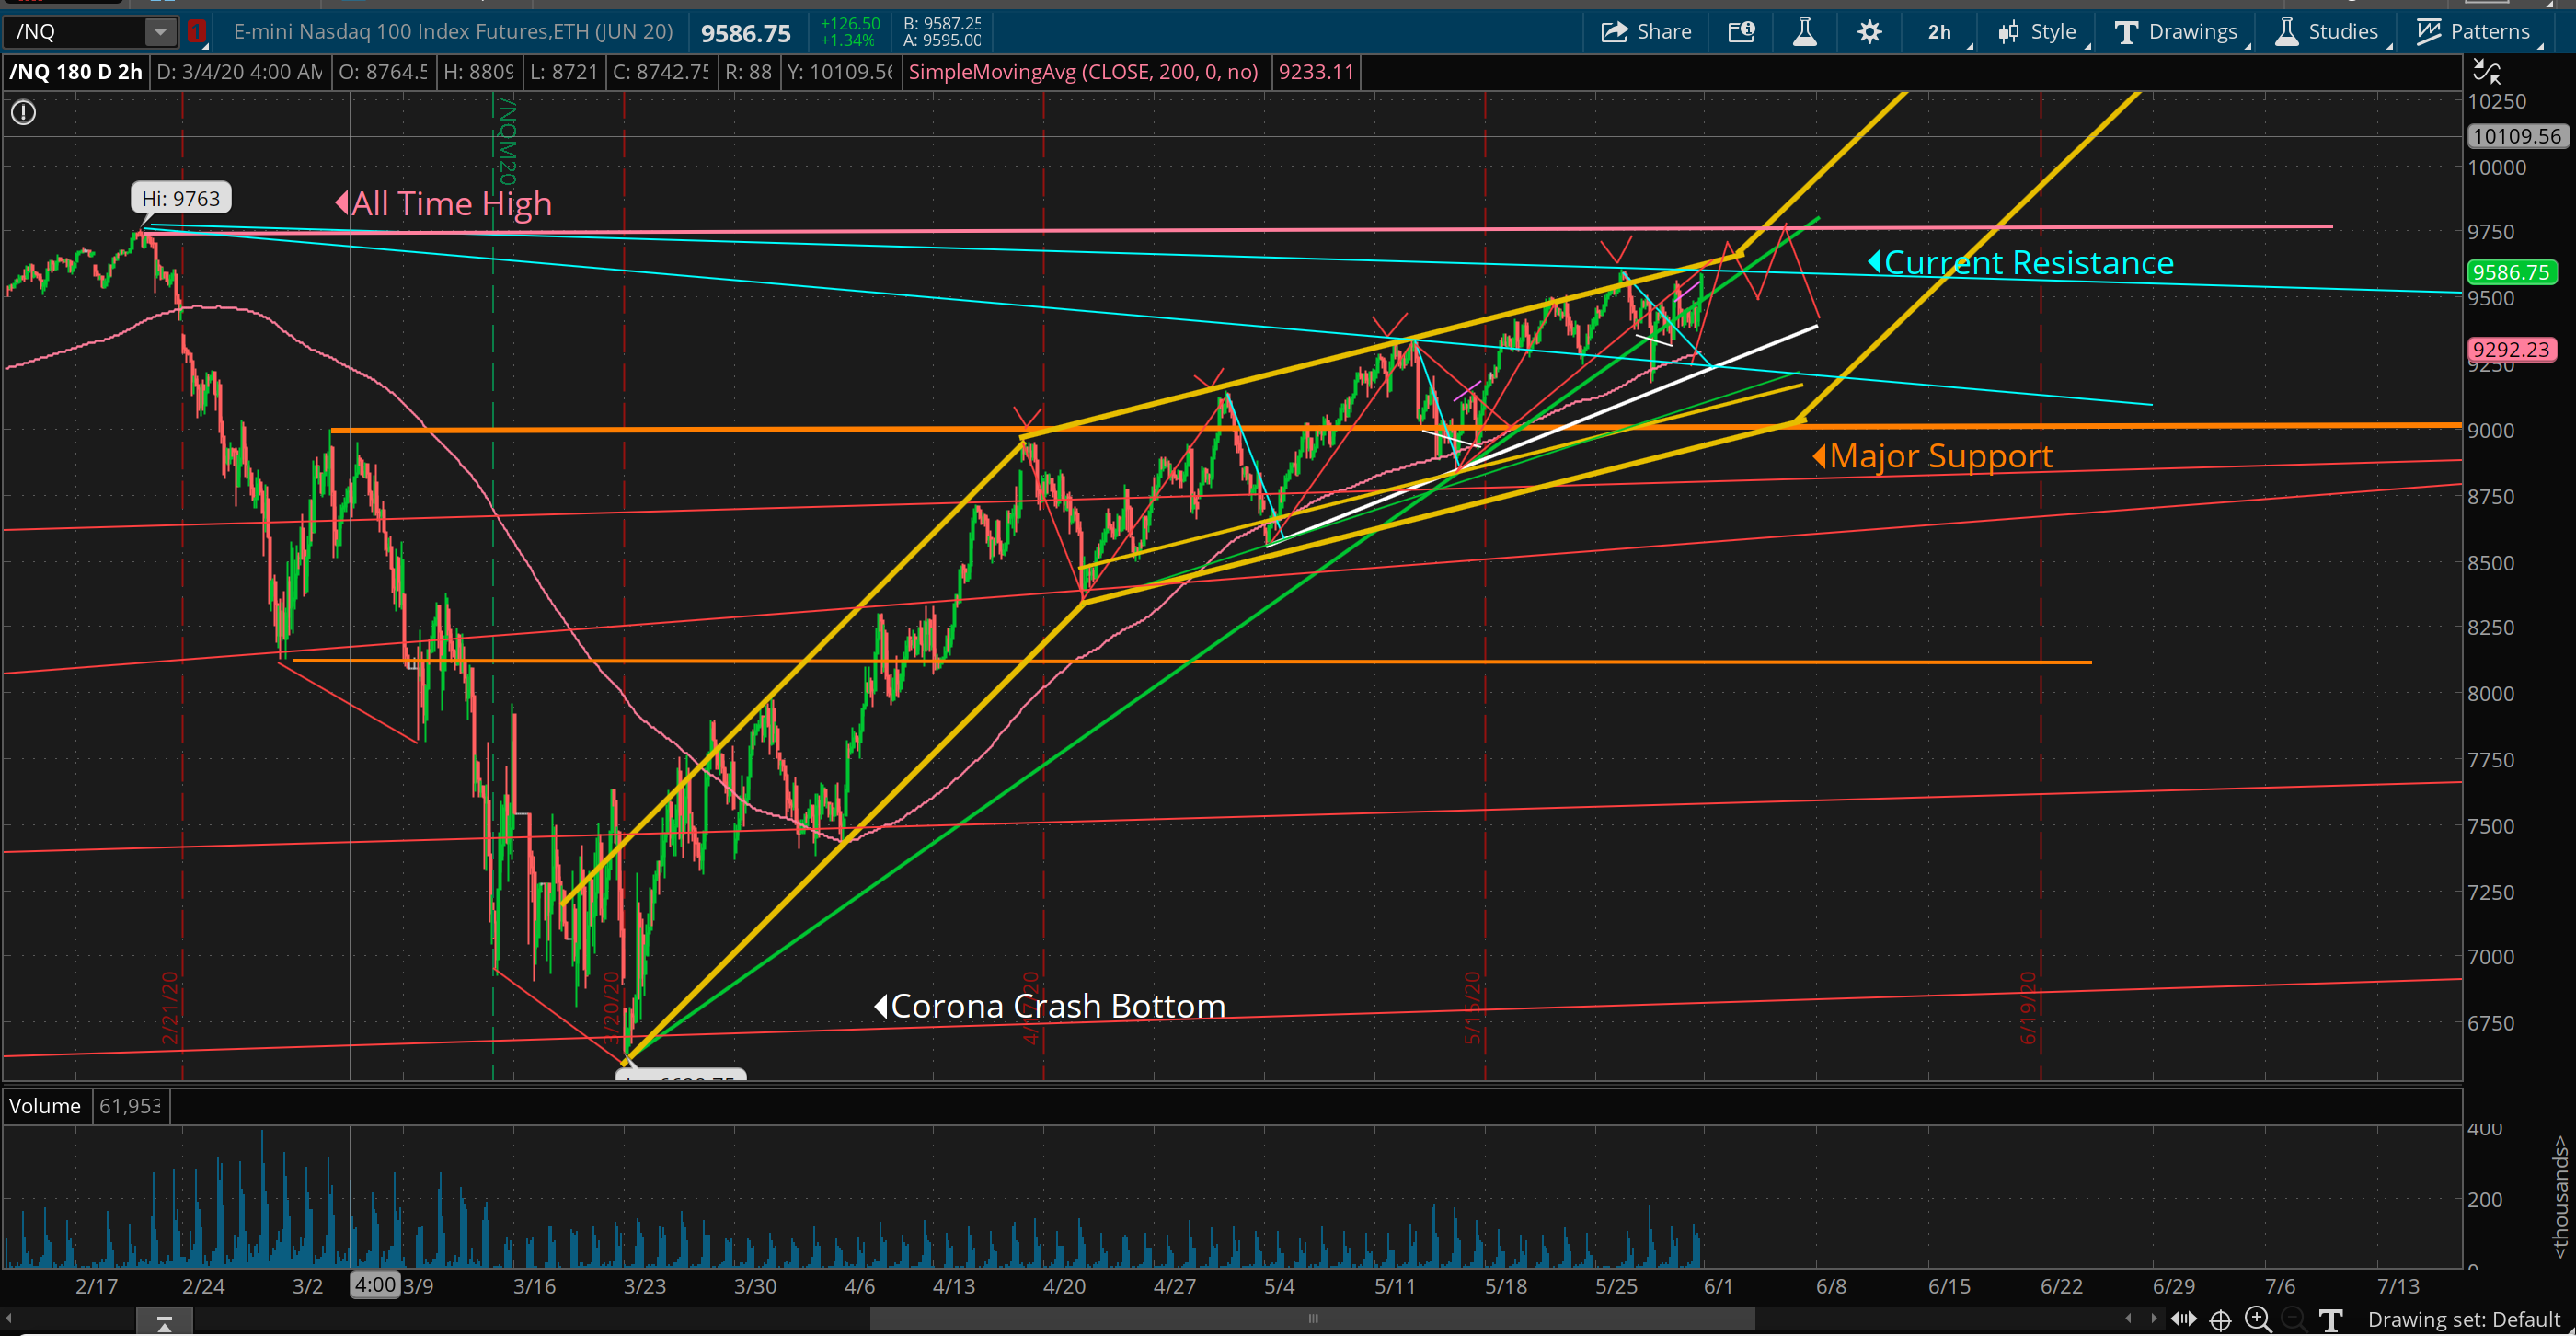
The tech heavy Nasdaq has been leading the broader market like a rocket off a launchpad and is only 1.8% from the all time high made just prior to the pandemic pause. It is likely to squeeze up that last little bit to the previous high where it will face some serious selling. So, if you are inclined towards hedging or profit taking this would be a good time.
Nasdaq futures (NQ)..5/30/20
Longer term, my thoughts remain the same. Into the end of the year or beginning of 2021 I expect an overbought surge higher to reflect the extreme oversold condition we experienced with the Corona Crash. Look for multiple opportunities over the summer to buy dips that should result in much higher prices looking out into next year.
The Chart Room
My favorite saying about Costco (COST) is “If they don’t carry it, I don’t need it.” Well, that was mostly true until the Great Toilet Paper Hoarding Era.
Earnings were released Friday in line with estimates and no major changes are expected with growth forecasts remaining higher than whoever its peers are. Who has better cookies and clothes than Costco?
The longer term chart shows the “gentle” curve upwards over the years occurring in linear segments with periodic mean reversion accumulation opportunities.
Costco Wholesale Corp (COST) 2000-2021
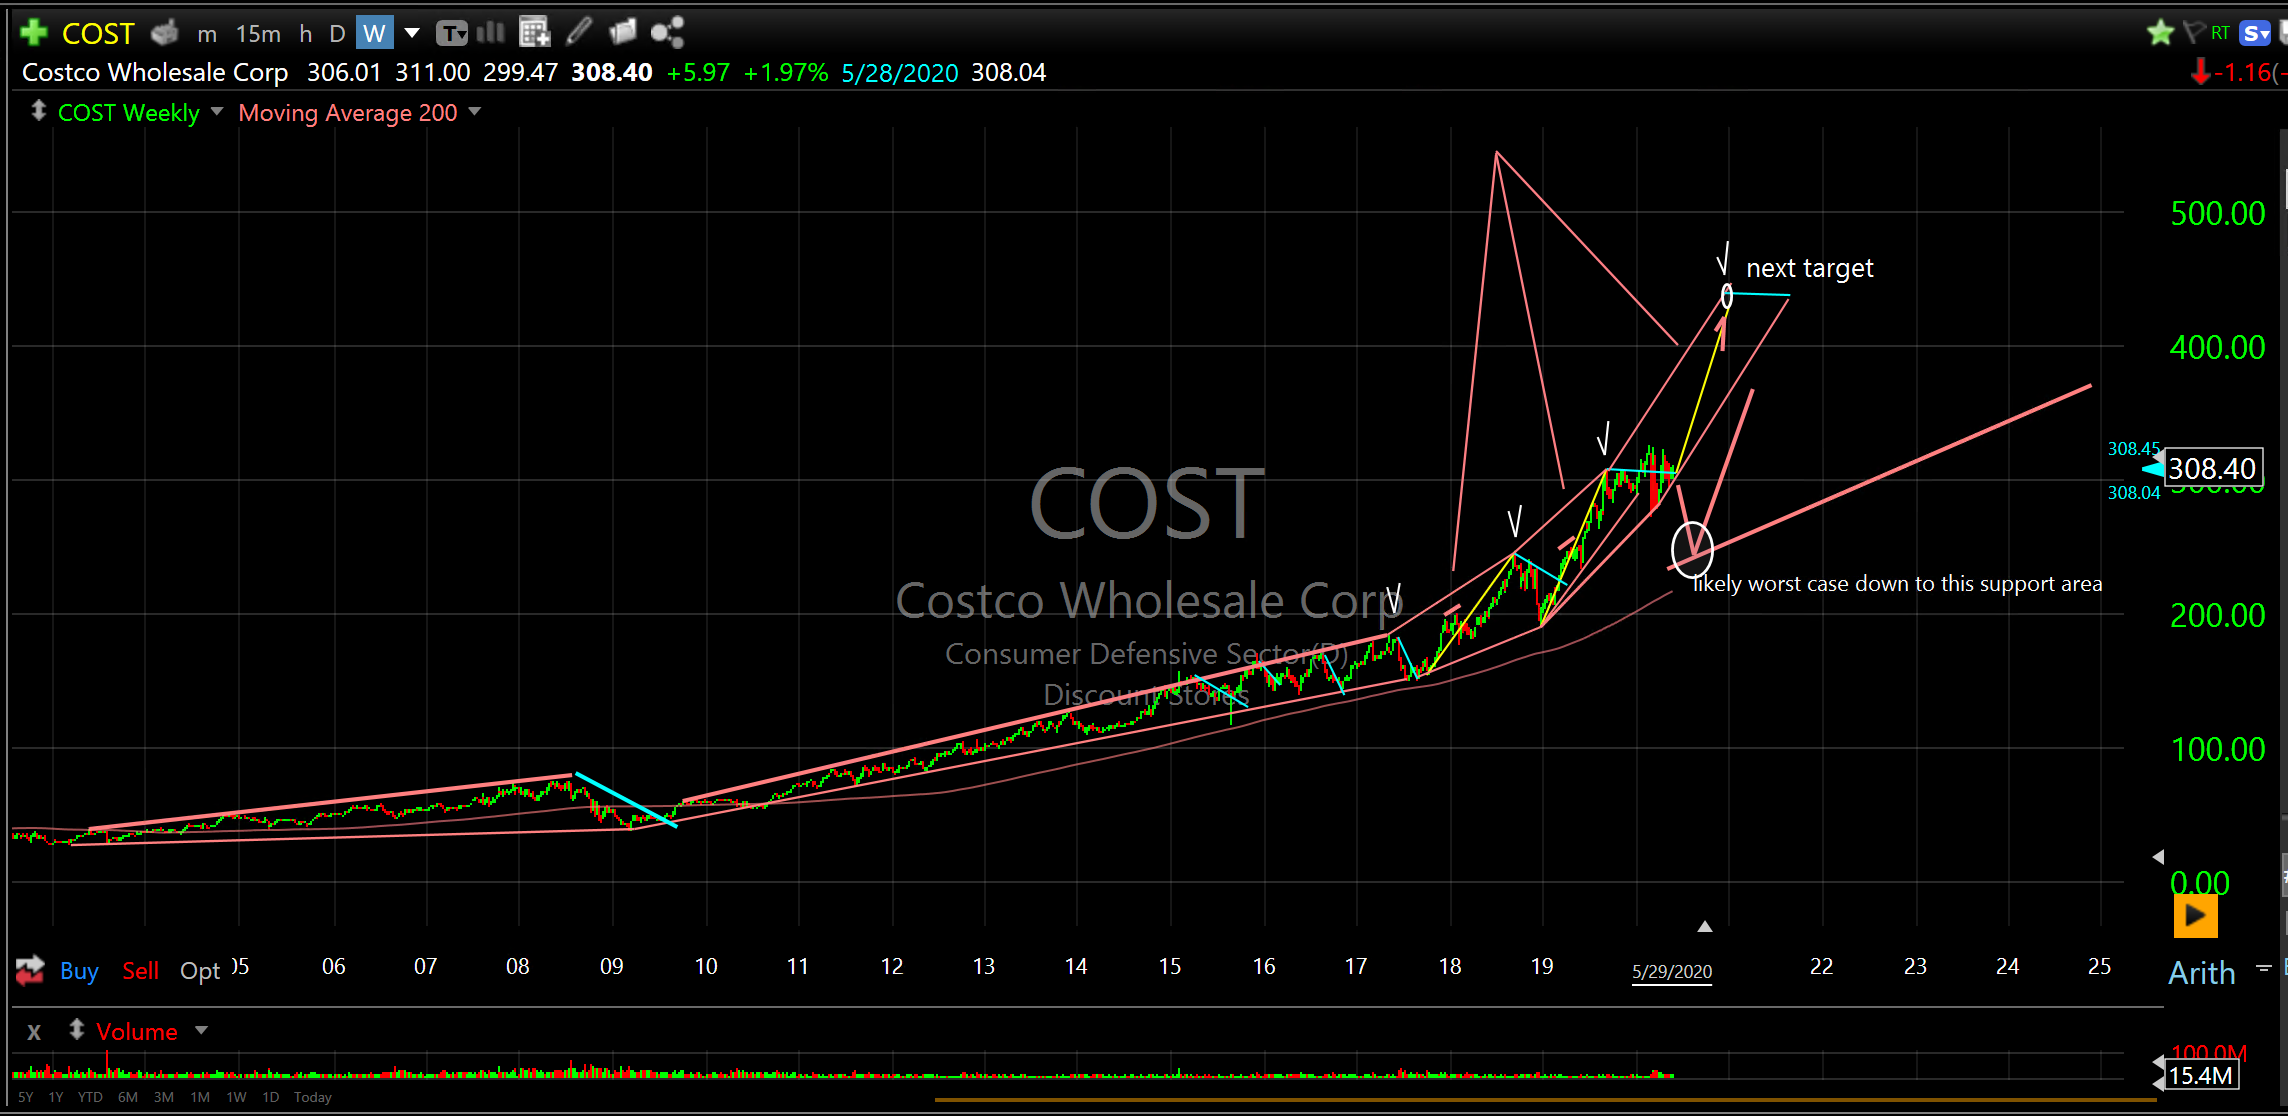
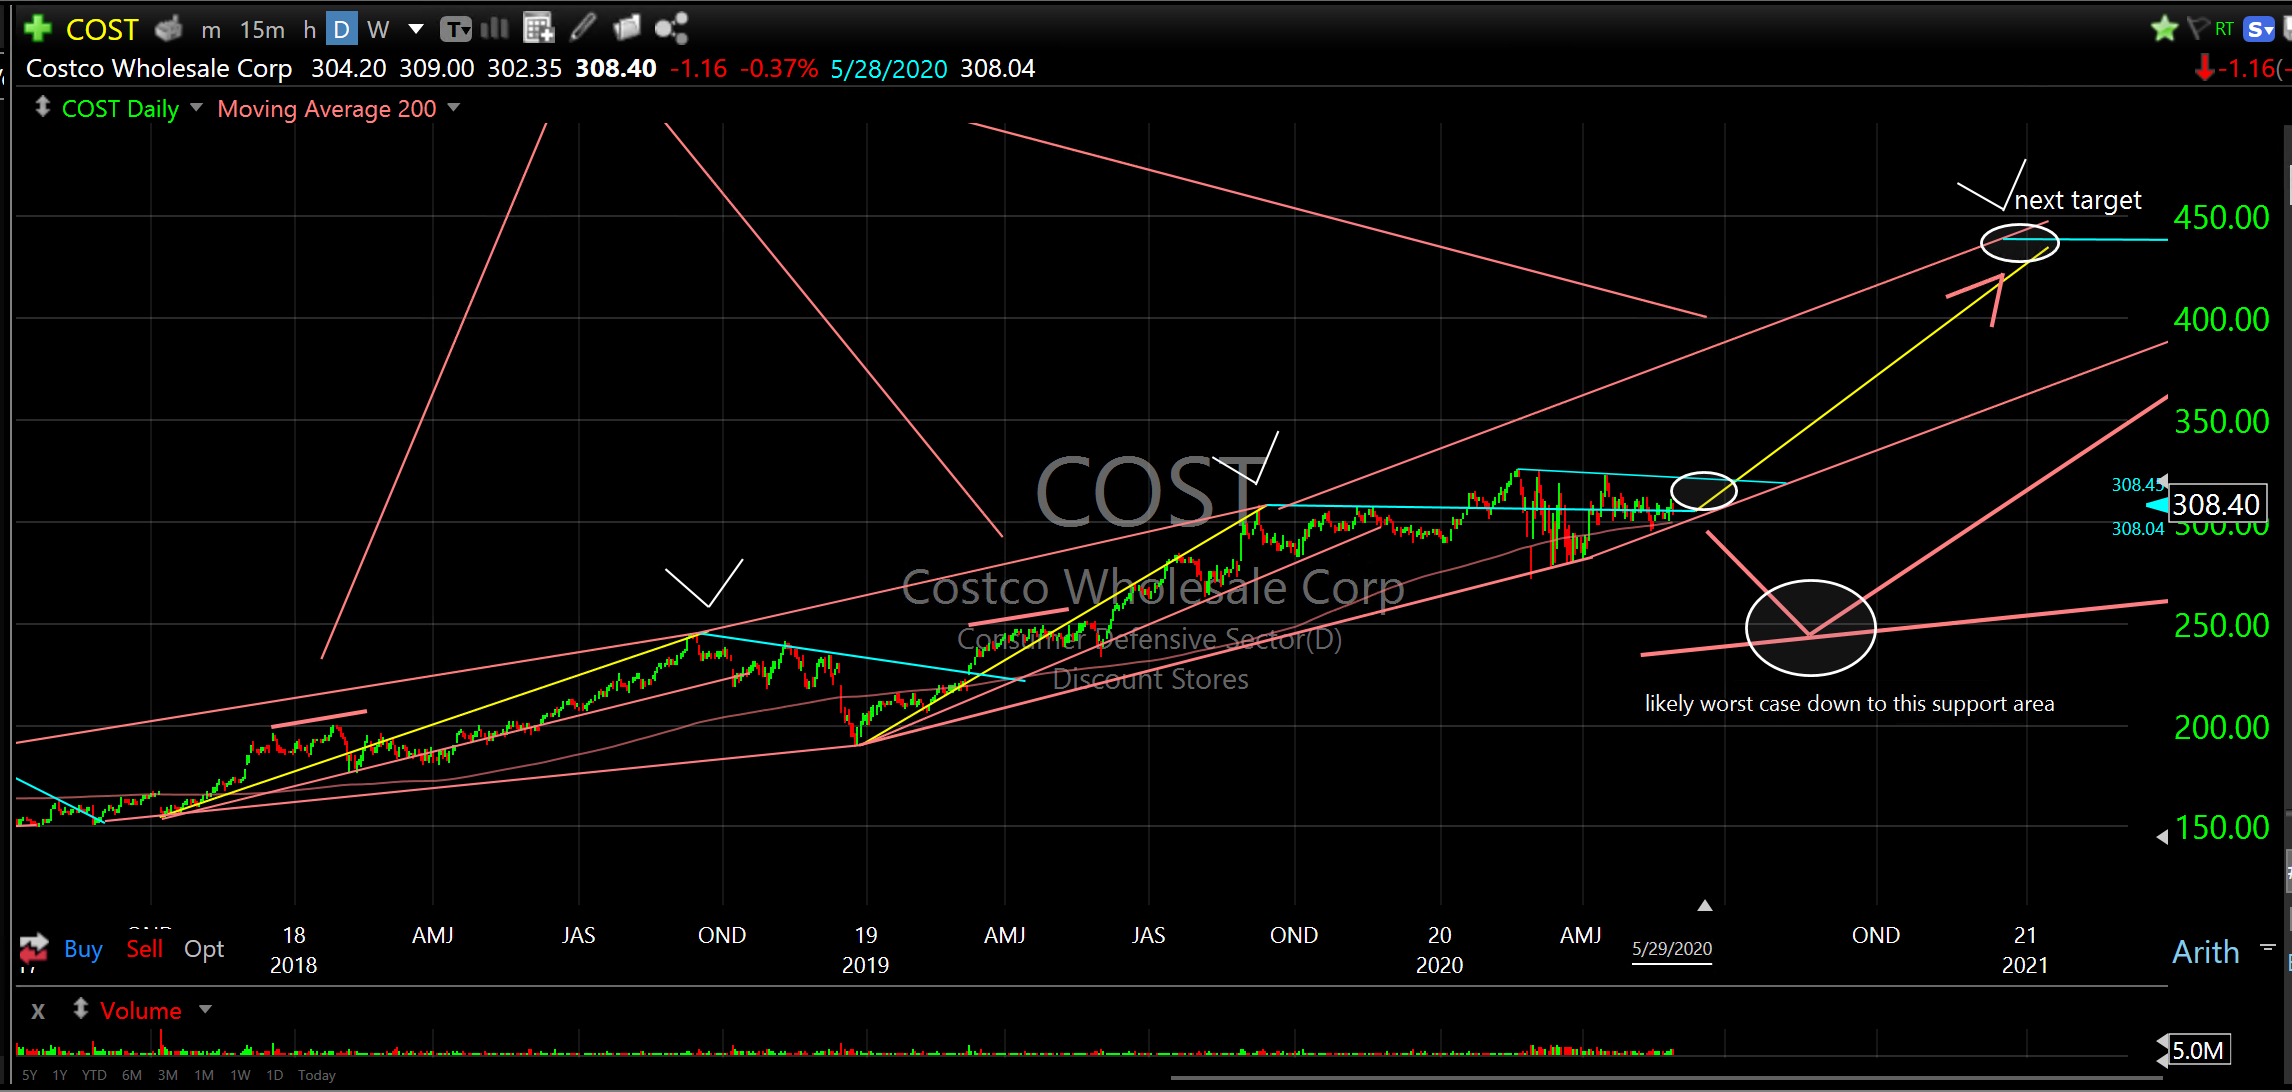
The shorter term chart shows price is attempting to break out of consolidation from October 2019. If it can hold $300 support and break up through blue line resistance it should run up to $450. On a worst case basis there is support at $250 and if it even gets down there, which I doubt, it should reverse higher near the larger reversal circle I drew in.
Costco Wholesale Corp (COST)..2018-2021
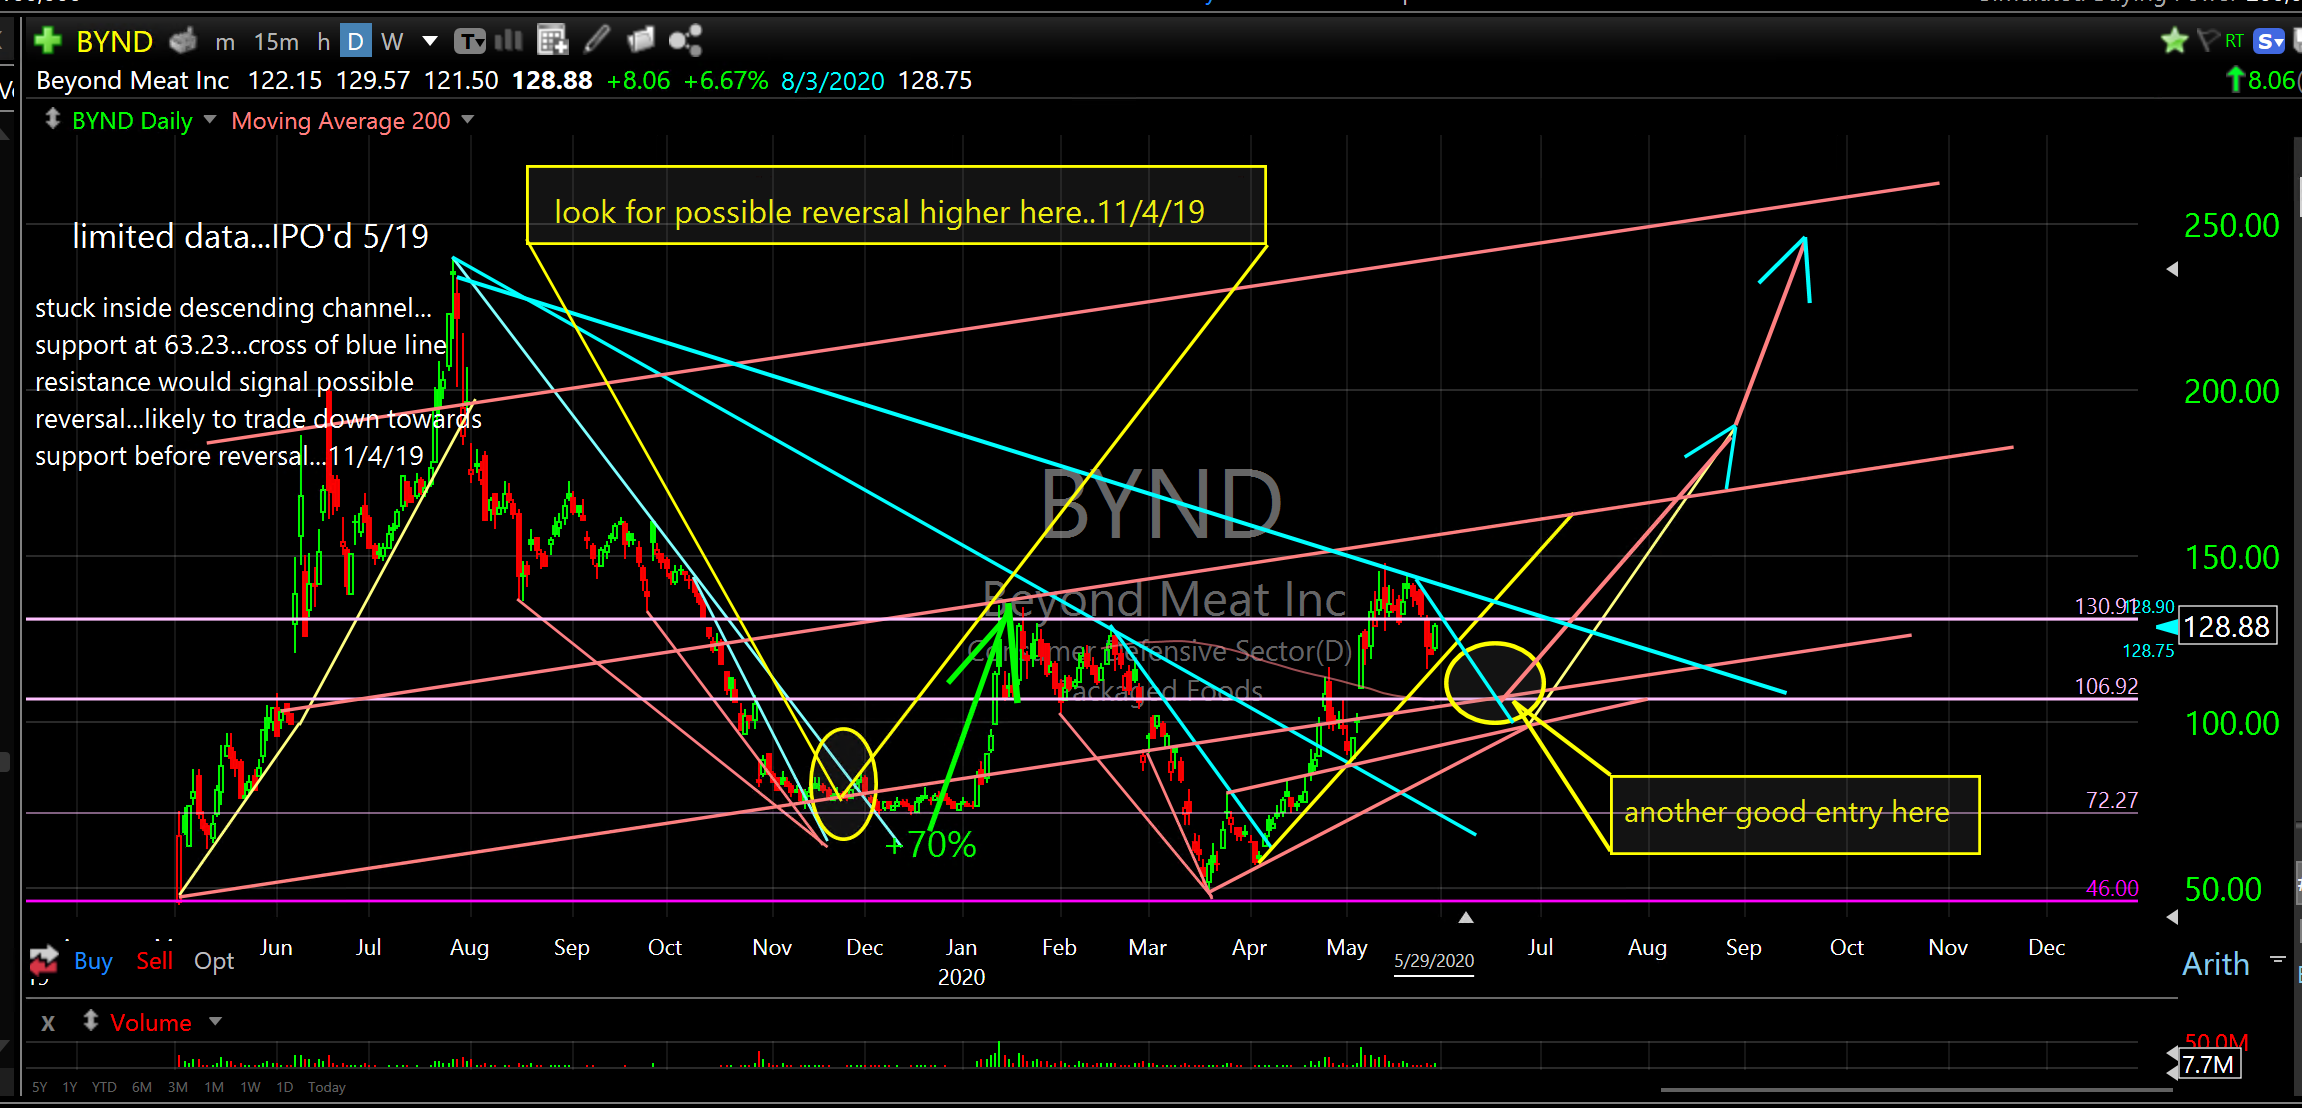
Speaking of cookies, Beyond Meat Inc (BYND) looks to be providing a nice risk reward opportunity. It looks like it will trade down towards $107 and position for another leg higher. While it could ramp higher from current levels the yellow circle would be a really nice entry opportunity with a target of $250.00.
Beyond Meat Inc (BYND)..5/31/20
I wish you the best during these challenging times,
Don