Sunday, April 19, 2020
“Don’t tell me the moon is shining; show me the glint of light on broken glass.”
― Anton Chekhov
In May, 1886, Chekhov wrote to his brother Alexander, who had literary ambitions: “In descriptions of Nature one must seize on small details, grouping them so that when the reader closes his eyes he gets a picture. For instance, you’ll have a moonlit night if you write that on the mill dam a piece of glass from a broken bottle glittered like a bright little star, and that the black shadow of a dog or a wolf rolled past like a ball.”
When I first saw the chart I was stunned. It was one of those moments when I knew my world was forever changed. I think I smelled smoke drifting out of my ears. Mind you, I have found many golden nuggets in my years of charting but this one shook even Richter’s scale. It was a find that would surely be unrecognizable to younger, less experienced eyes..and probably still is. It was a lost treasure found. Blackbeard would be so proud.
Here is a selfie taken on the day of the find..

I could have easily missed it had I not trained for all those years. Year after year, pouring over all those charts piled up behind my desk (pre computer era) so high my wife constantly worrying they would spontaneously combust in a blinding poof.
This chart was different. It was reflective and symmetrical. It was non linear in a linear world. It was fractal in a world where time equaled price. The axis’ were actually in sinc. So much was revealed. So many unanswered questions were answered. I was stunned. I was grateful. That was the day my work and lady luck collided.
Neil deGrasse, the famous astrophysicist, author and science communicator has a saying, “one of the great challenges in this life is to know enough about a subject to think you’re right but not enough about a subject to know you’re wrong.”
We are all susceptible to educational bias which shapes our understanding of how we see the world. He talks about our need to question what others say and be objective with our truth. A proper skeptic recognizes what they are unsure of and recognizes when presented with valid evidence to change your mind. It doesn’t matter what others think as some things are true whether or not we want to believe them.
Most technicians are still linear in their thinking. I was too until that fateful day. The chartists tools have been passed down through the years with little innovation and are now old and rusty. I don’t say dismiss those old tools. I say make sure they really work. I say make sure they are practical in the real world. I say know when they don’t work. I say don’t dismiss what you don’t, at first, understand.
Over the years, I have tried to present valid evidence to help reshape your view about how to think about the markets, to train your mind to see the markets from a different perspective and equip you with methods and tools to turn raw price data into information, information into knowledge and knowledge into wisdom. A wisdom that converts lines on a chart into risk management fueled expansion reversals. It wasn’t me telling you the market was going to go up but showing you the glint of light coming off the charts.
If you go for a deep granular dive into raw chart data you will see the fractal repetition of the market. If you look through a wide angle lens you will see the repeating cycles and their characteristics. If you look close you will see a foundation built on risk management. You will see the entries and exits. You will see why you can’t ignore this. The evidence is in the charts.
Can you imagine a bunch of colored lines on a chart have so much to do with shaping our understanding of how the stock market works and framing how we think about and actually practice risk management. Can you imagine a world where it’s possible to predict the exact turning points in the Dow, S&P 500, Nasdaq, ETF’s, individual stocks and debt instruments? I can. I live in that world.
It’s not a world of perfect. Far from it in fact. But, it’s a place with fewer errors. It’s a place where you know when you are wrong. It’s a place with enough valid evidence to change minds. Simply put, it works, it repeats and it’s teachable.
The methodology and tools I use projected most every broader market reversal in 2019..before they happened and to what depth. The accuracy these tools provide is astounding to even me and should rattle the skeptic in you. The fractal repeating cycle characteristics identified the bottom in bitcoin, the perfect trade in YETI, the exact track QQQ would take last summer, the exact route those JB Hunt Transport Trucks (JBHT) would take for months into the future and so much more. There is absolutely no way these projections can be made with traditional fundamental or technical analysis.
So, I invite you to read what I wrote last October and have a very close look at the charts. The evidence is in the charts and believe it or not, the future might be as well.
Broader Market Update
The recovery is unfolding as I projected on the following chart I created and posted here on March 26th.
SPDR Dow Jones Industrial Average ETF (DIA)..3/26/20 projection

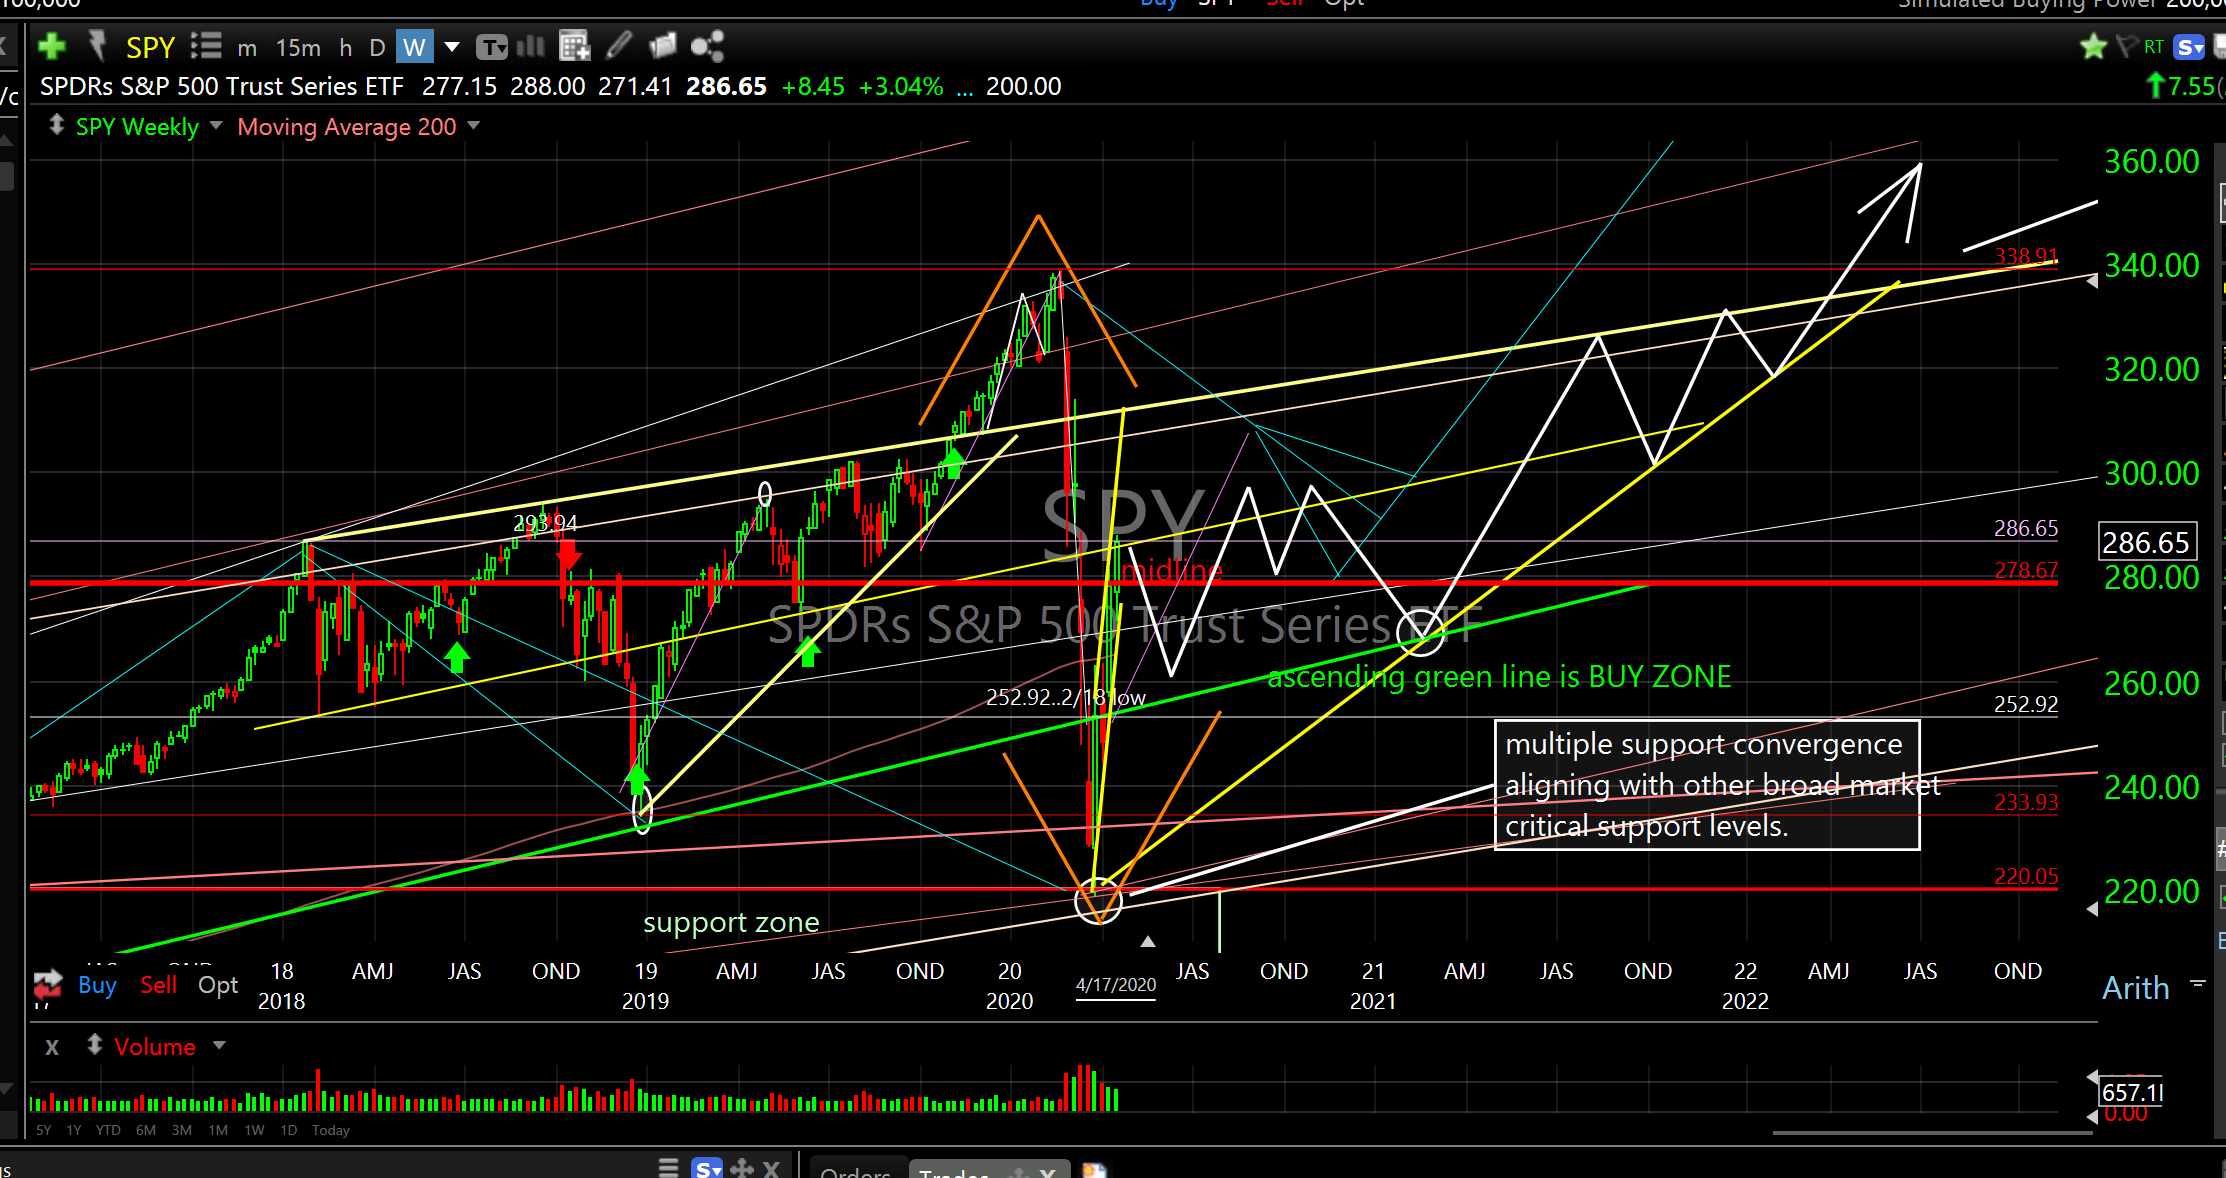
While the surge off the March 23rd bottom has been robust the trajectory is unsustainable. This is not a bad thing, it just means we will have reversals and consolidations that will bring the slope of the recovery back to a more sustainable track. There is a high probability for a second collapse over the next few weeks which would be typical before a more sustained recovery. The broader market projection I provided last week is still a high probability model. I would expect the ascending green line to continue providing good reversal entry points as it has done for many years.
SPDR’s S&P 500 Trust Series ETF (SPY) 2021 projection
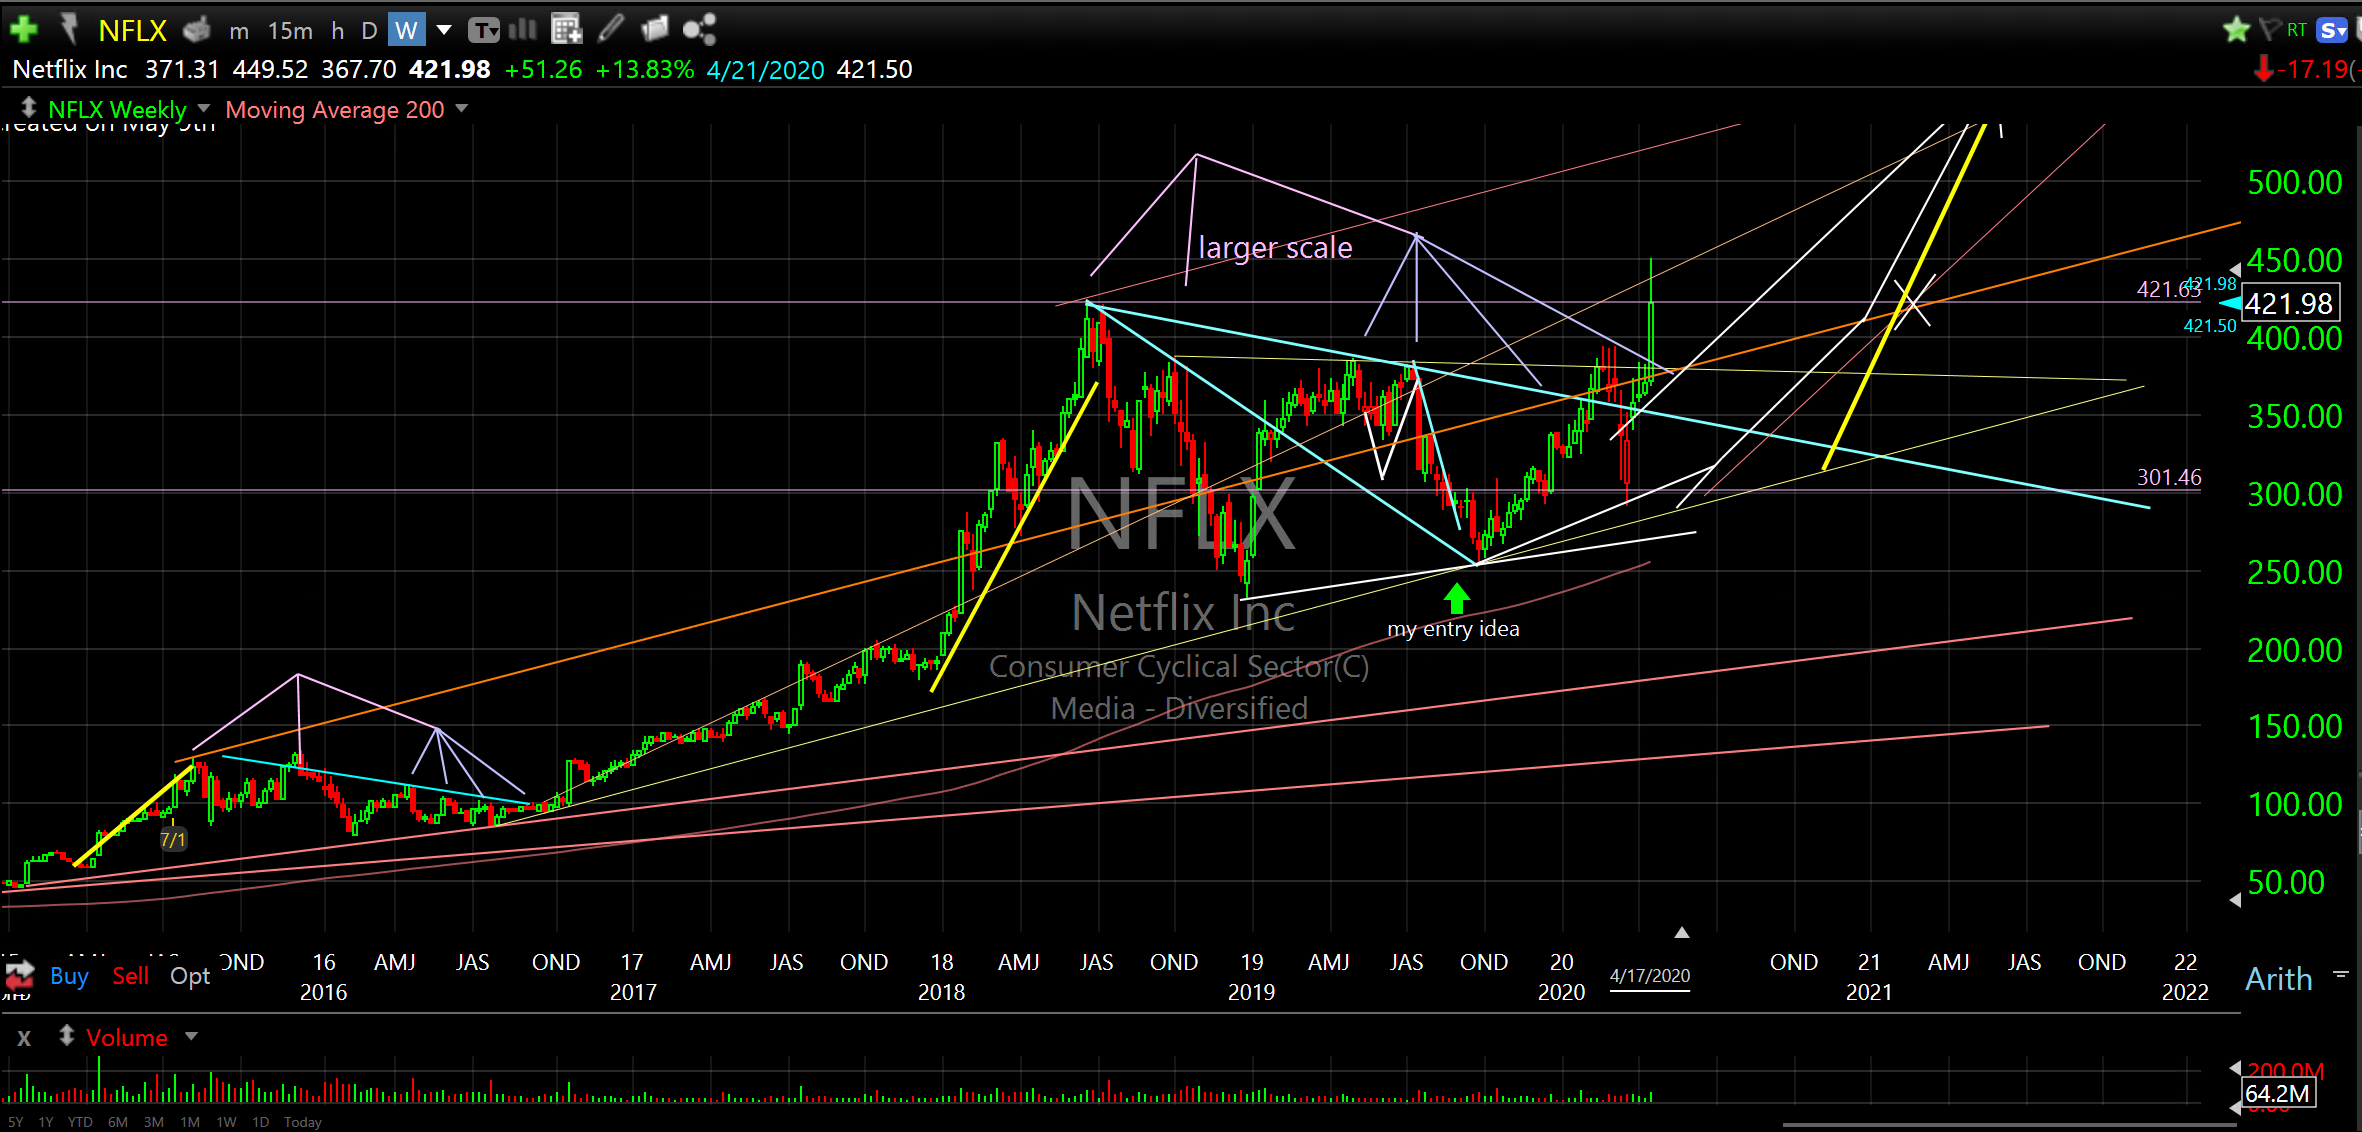
Nasdaq has been ripping higher and is only 6.6% below its all time closing high. It has also closed above the old 22 month consolidation ceiling where the higher expansion took place between November and the recent February high. Considering the components of QQQ relative to the Dow and S&P 500 this isn’t surprising. Just look at Netflix and Amazon. New highs already!
Invesco QQQTrust Ser 1 (QQQ)

Netflix Inc (NFLX)
Amazon.Com Inc (AMZN)

So, as I wrote last week, I think the bottom is in. This doesn’t mean we won’t be choppy and it doesn’t mean we won’t have any more rough days ahead. It means the worst was probably priced in on March 23rd. I wrote then that it felt like peak fear. Even I was scared and didn’t want to peek my head out of my blanket fort (key indicator of market bottoms).
So, an abbreviated broader market review today giving myself an opportunity to indulge some whimsey, reflection and valid evidence for others to review. Now off to a stationary swim in my pool hooked up to a belt and bungee cord because the community pool is still closed.
Hang in there,
Don