The pundits are proclaiming that bonds will rally from here and it’s time to raise cash by selling stocks. Very short term, they might be right. Longer term, not so much.
Broader Market Review
The 1,200 Dow point surge off my February 3rd projected reversal bottom has been impressive, to say the least. The broader market indexes made new highs and the expansion marches on. My longer term forecast remains unchanged: a robust 2020 expansion with the usual chop, a seasonally weak summer and another strong rally in the fall.
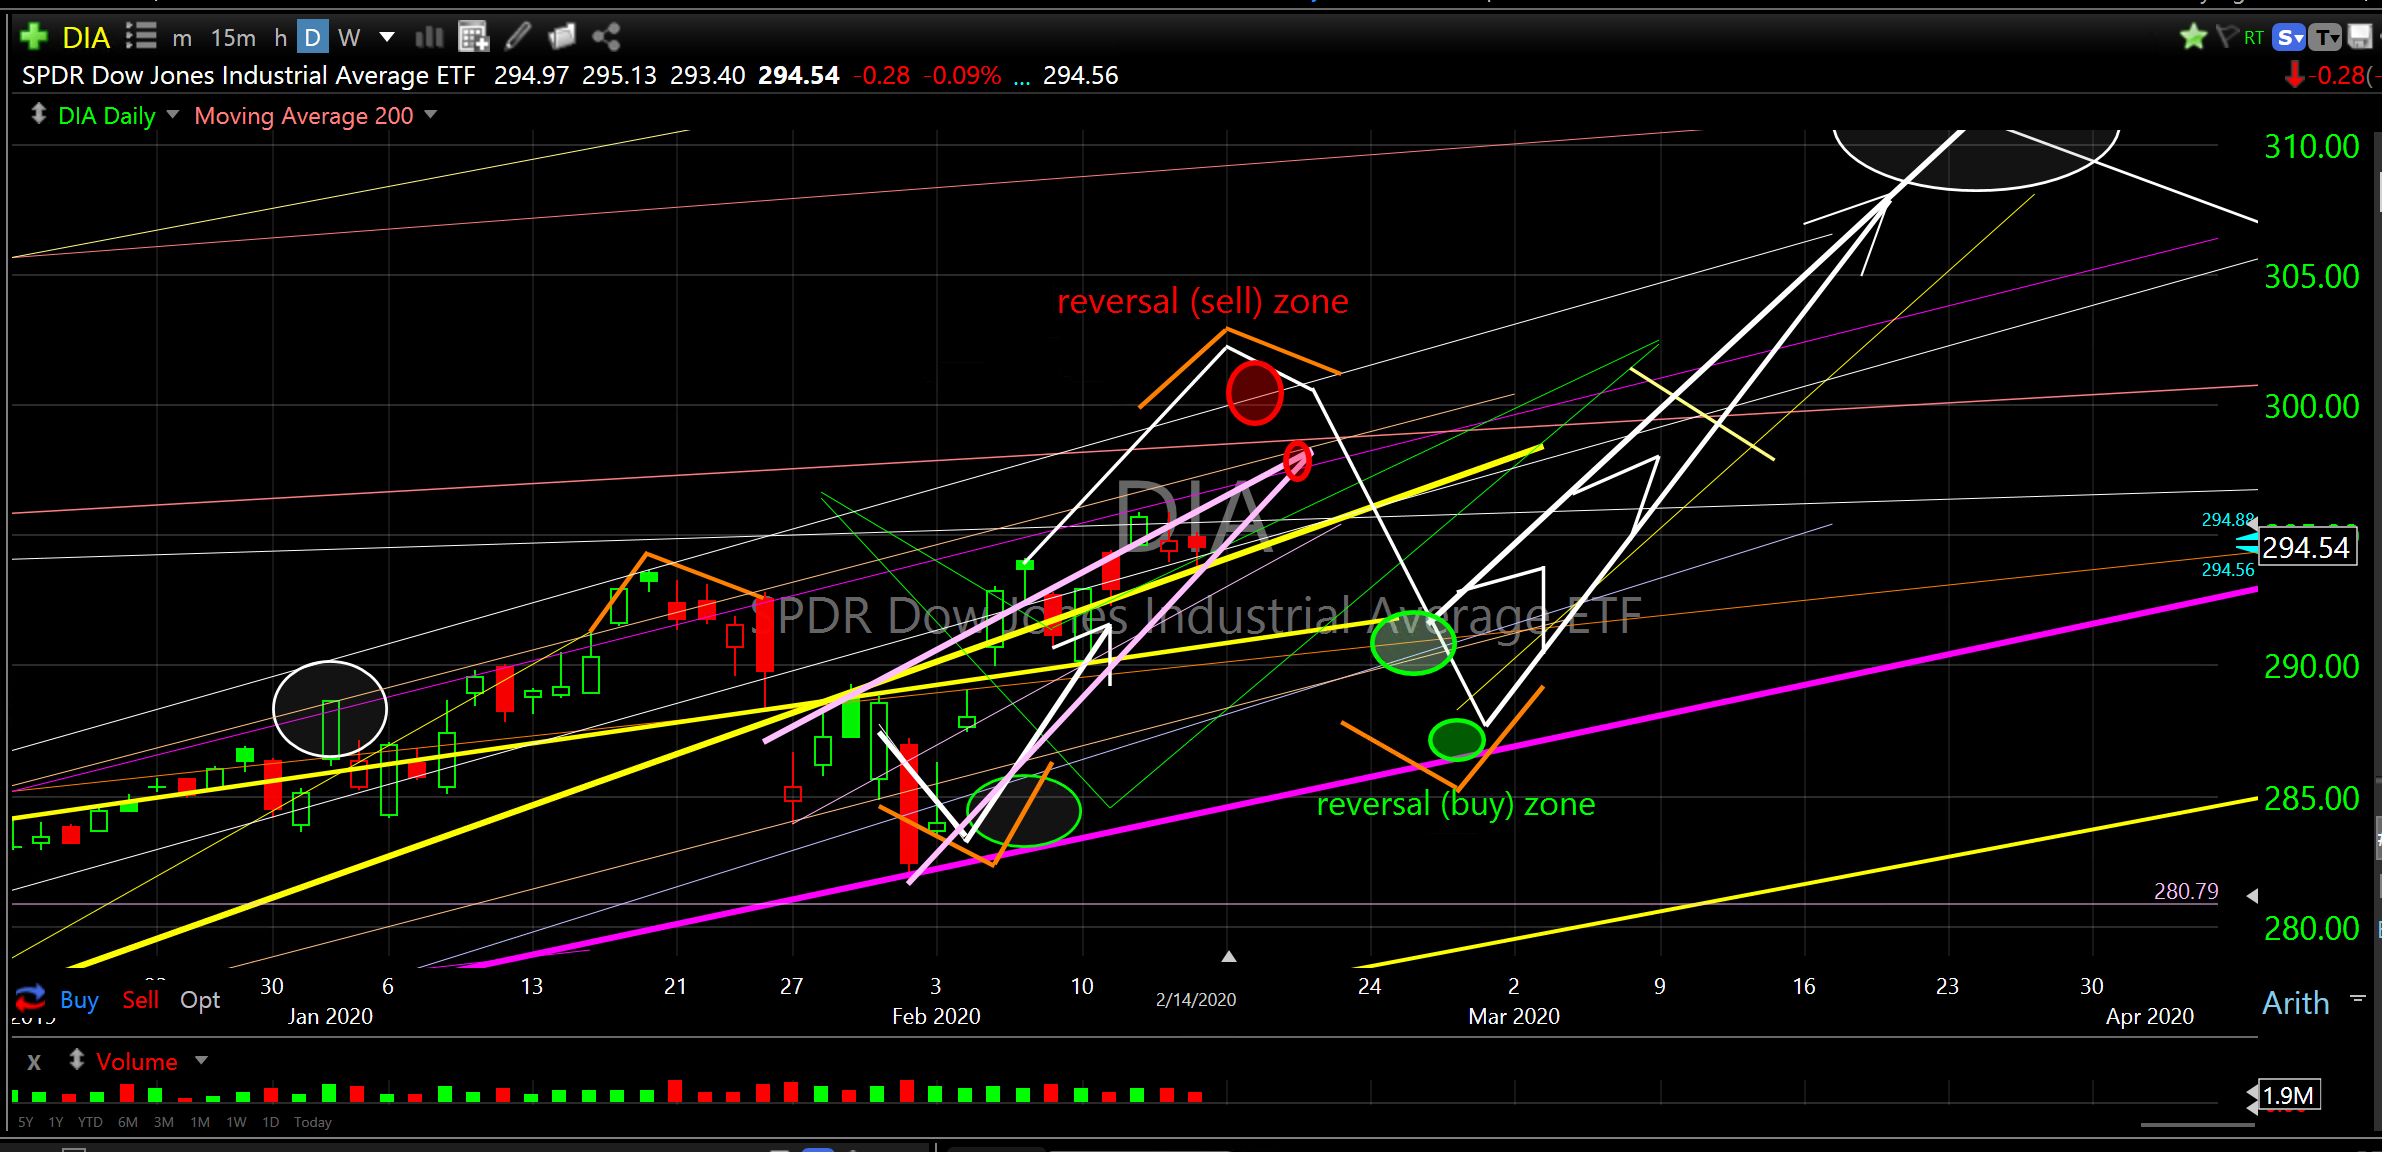
Short term, the model shows another dip soon. Before the end of the month the Dow Jones Industrial Average could begin another 1,000 point retracement (price adjustment) to the ascending pink line support, just like it did two weeks ago.
If you want to take some profits, now would be a good time. I would especially recommend this on any leveraged products you might own. In addition, you can take advantage of adding to or initiating new positions at likely lower levels.
I think this will be another steep and deep affair just like two weeks ago with another surge higher from the buy zone in early March. The projected short term reversals are the red and green circles I drew on the charts. The price forecast is drawn in white.
For those of us with a longer outlook, suffering through some of the drops is part of the game. Note I said “some”. We do want to avoid the recessionary big ones. And, that can be done in spite of what you have been taught to believe.
SPDR Dow Jones Industrial Average ETF (DIA)..short term
SPDR Dow Jones Industrial Average ETF (DIA)..longer term
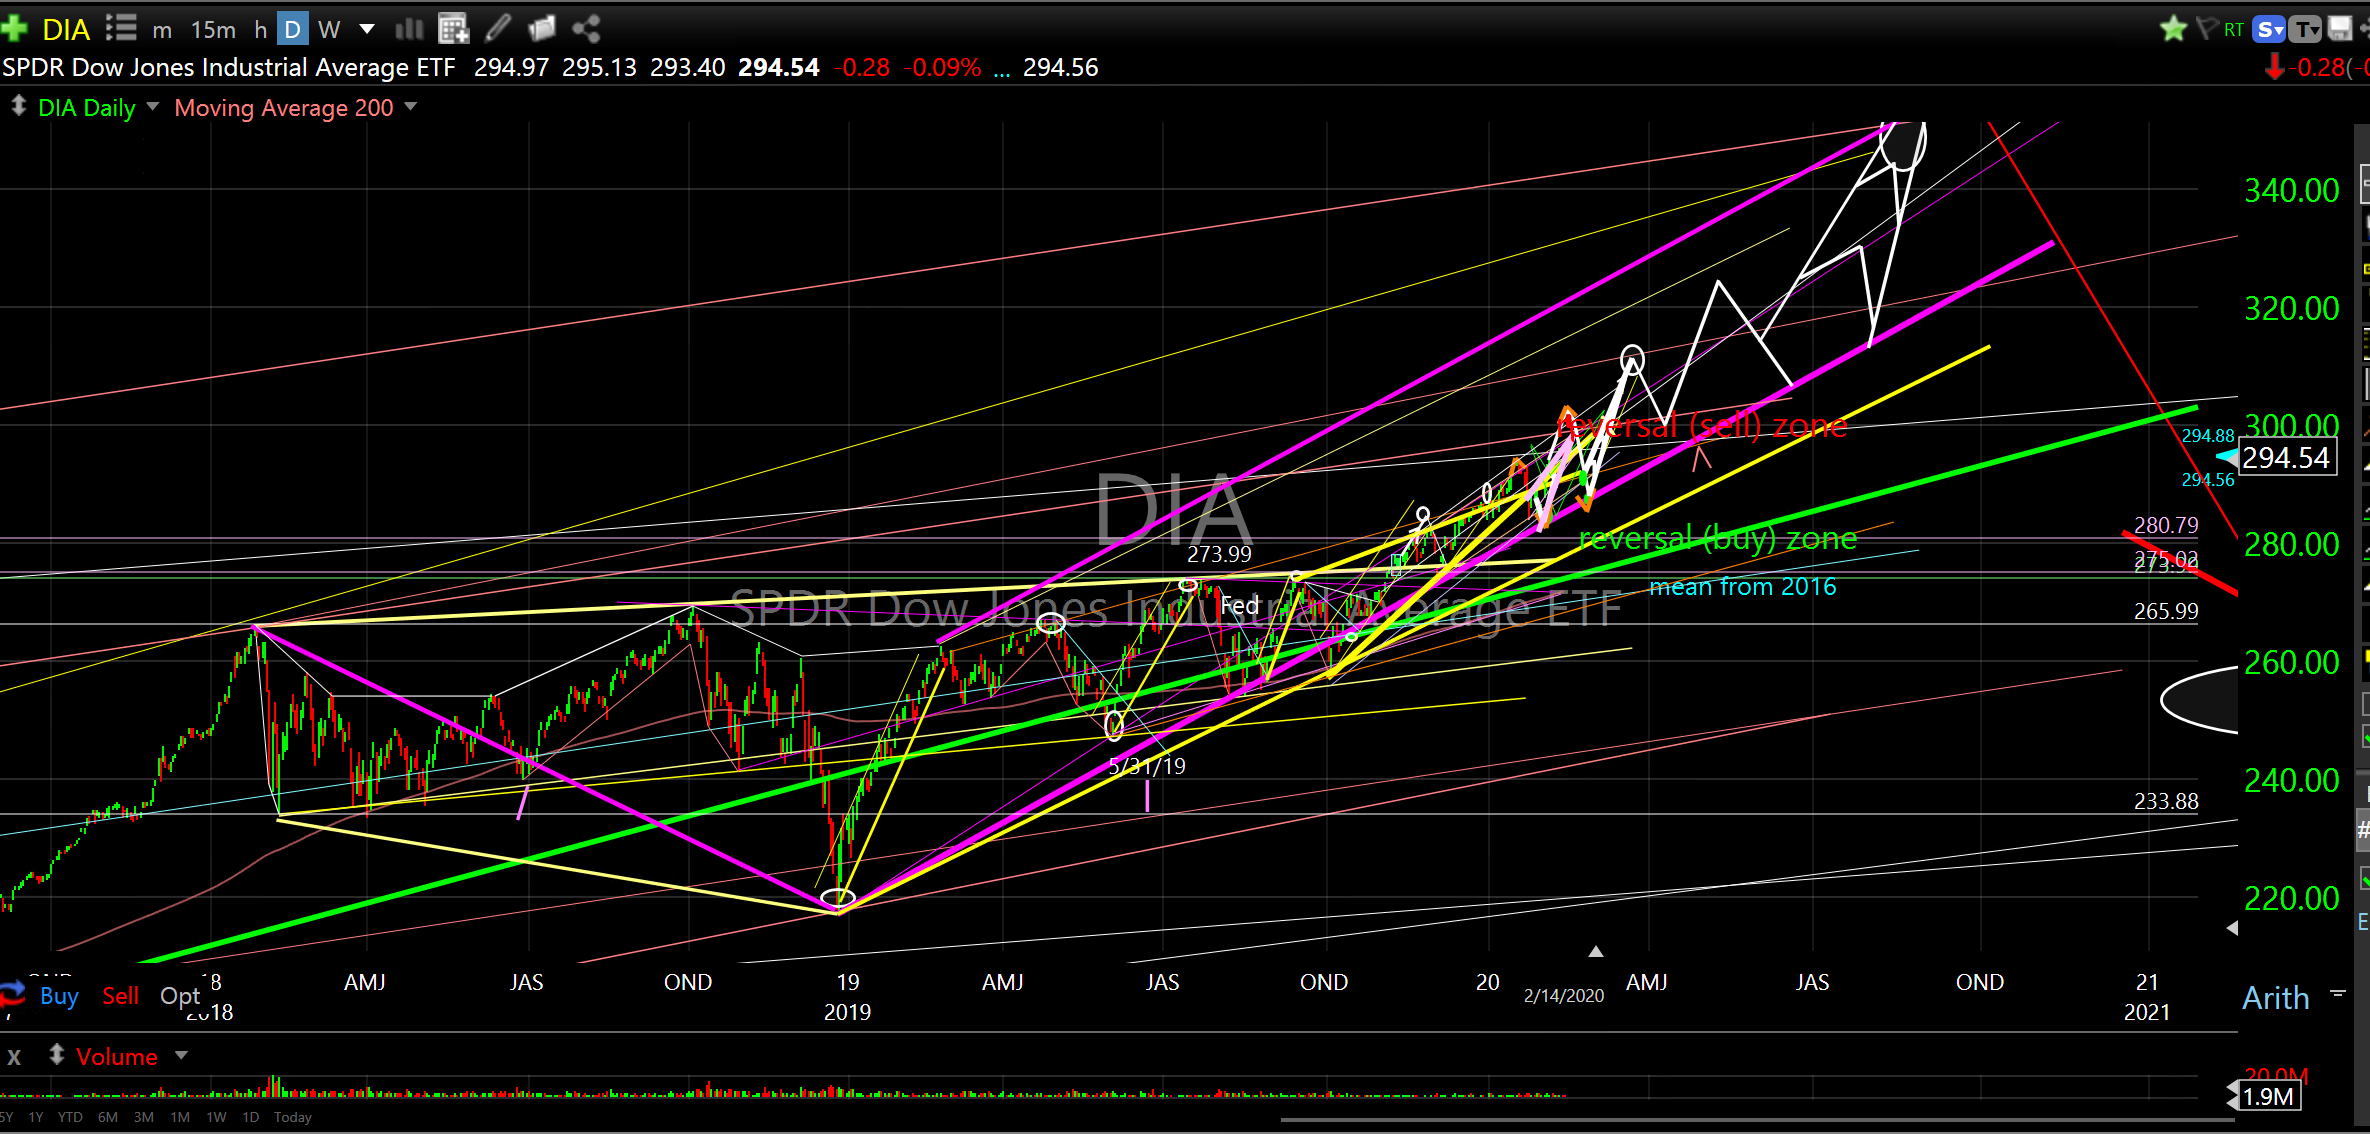
All other broader market indexes should follow suit. This dip, like the others, is expected and offers yet another opportunity to buy at lower levels. As I wrote last week “Expect multiple support reversals that will offer buying opportunities along the way up. The lower ascending pink line should provide a rising floor that can be bought on each dip for the next few months. Price may default down to the lower, ascending yellow line support (good buy zone), however, that is more likely to occur in the seasonally weak summer months when that price level will be higher.”
For those of you who are new subscribers, I would highly recommend reading the archived weekly comments for the past few months. This will give you a better foundation for understanding my outlook for 2020 and what instruments should perform best during this time period.
You can find archived closed trades (Exits) and performance with links to comments/charts on the Trade Alert page.
You can find open trade ideas (Entries) with links to comments/charts on the Trade Alert page by scrolling all the way down to the bottom. You can find my favorite ETF’s here. You can find more of my favorite individual stocks here, here and here.
I understand looking at the charts can be confusing for many. This is totally normal as the vast majority of people have never been exposed to technical analysis let alone Cycle Rotation/Positioning Analysis.
If you are new, welcome to the world of charts. Prepare to be blown away. Prepare to see the market through a high powered lens. Prepare to step Through the Looking Glass. You will not find this type of analysis from traditional research firms.
All instruments trade in measurable, repeating cycles. Broader market indexes, sectors, ETF’s, individual stocks, commodities, currencies and debt each have their own distinct cycle footprint.
Cycles have three main characteristics: expansion, collapse and consolidation. (Float/Volume rotation can be included). If we can identify where price is positioned in the cycle we can identify the reversals. If we can identify the reversals we can make a lot more money in a shorter period of time than just buying and holding. We would actually know when to hold ’em and when to fold ’em.
We identify reversals. Reversals are where expansions begin. Reversals are where collapses begin. Identifying reversals is priceless. Identifying reversals is the objective of every market participant on the planet.
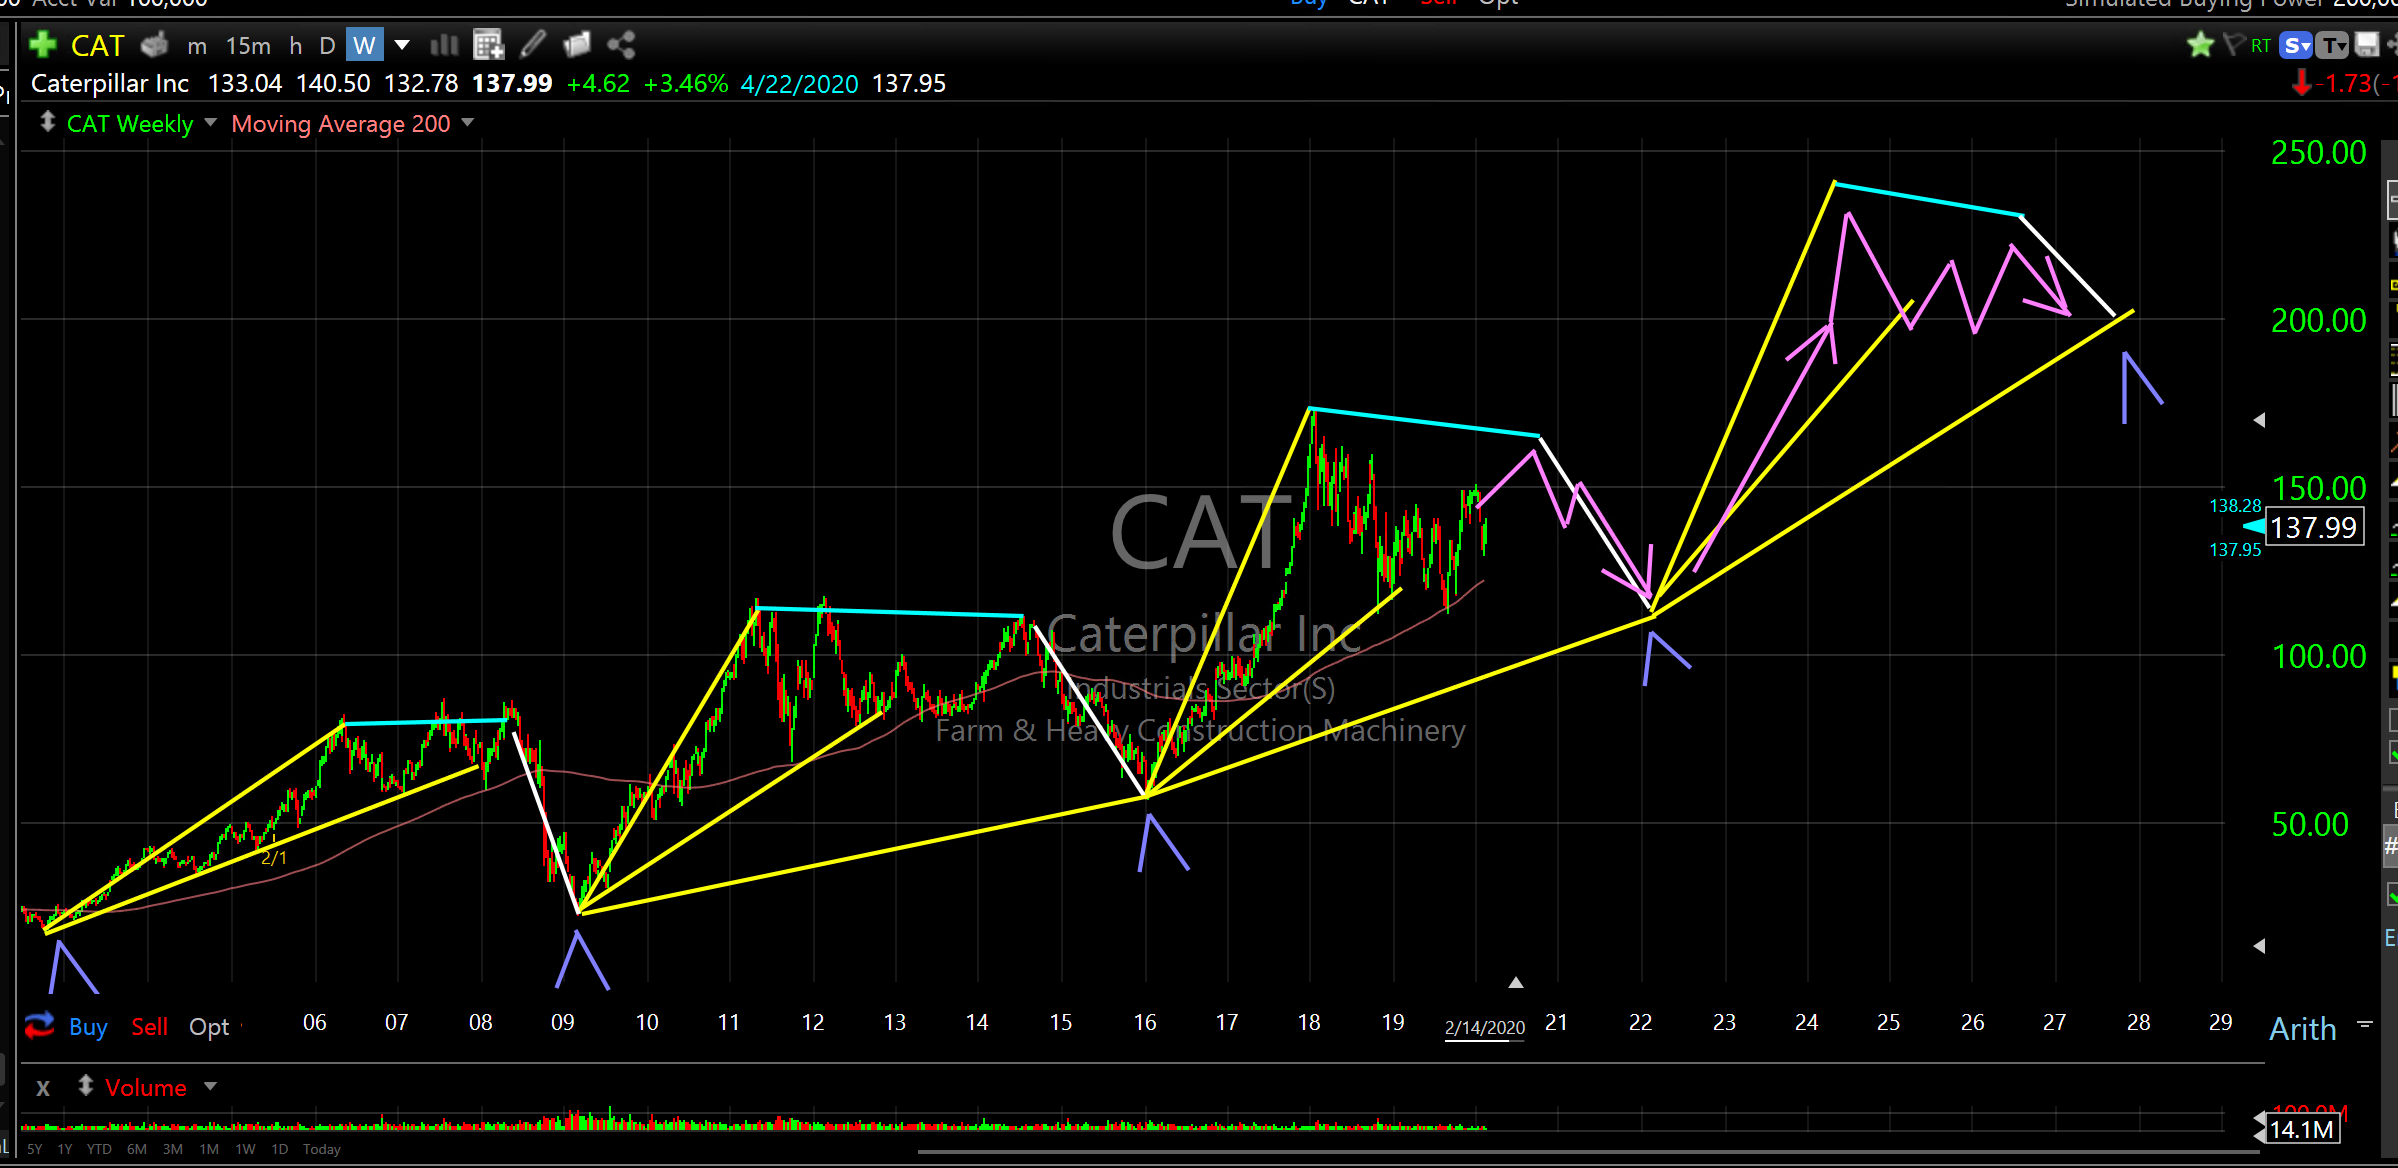
What we are really quantifying is human behavior. After all, human behavior drives price. Human behavior doesn’t change all that much over time and that’s really what we measure when doing a deep, forensic dive into price action. We are looking for the repetition. It’s always there. Over and over and over. It’s just a little different with each instrument; like music.
Just look at this chart of Caterpillar Inc (CAT). Look at the repetition. That should blow your mind. It’s a roadmap of when to buy and sell!
Caterpillar Inc (CAT)
OK, enough of that.
What Caught My Eye Last Week
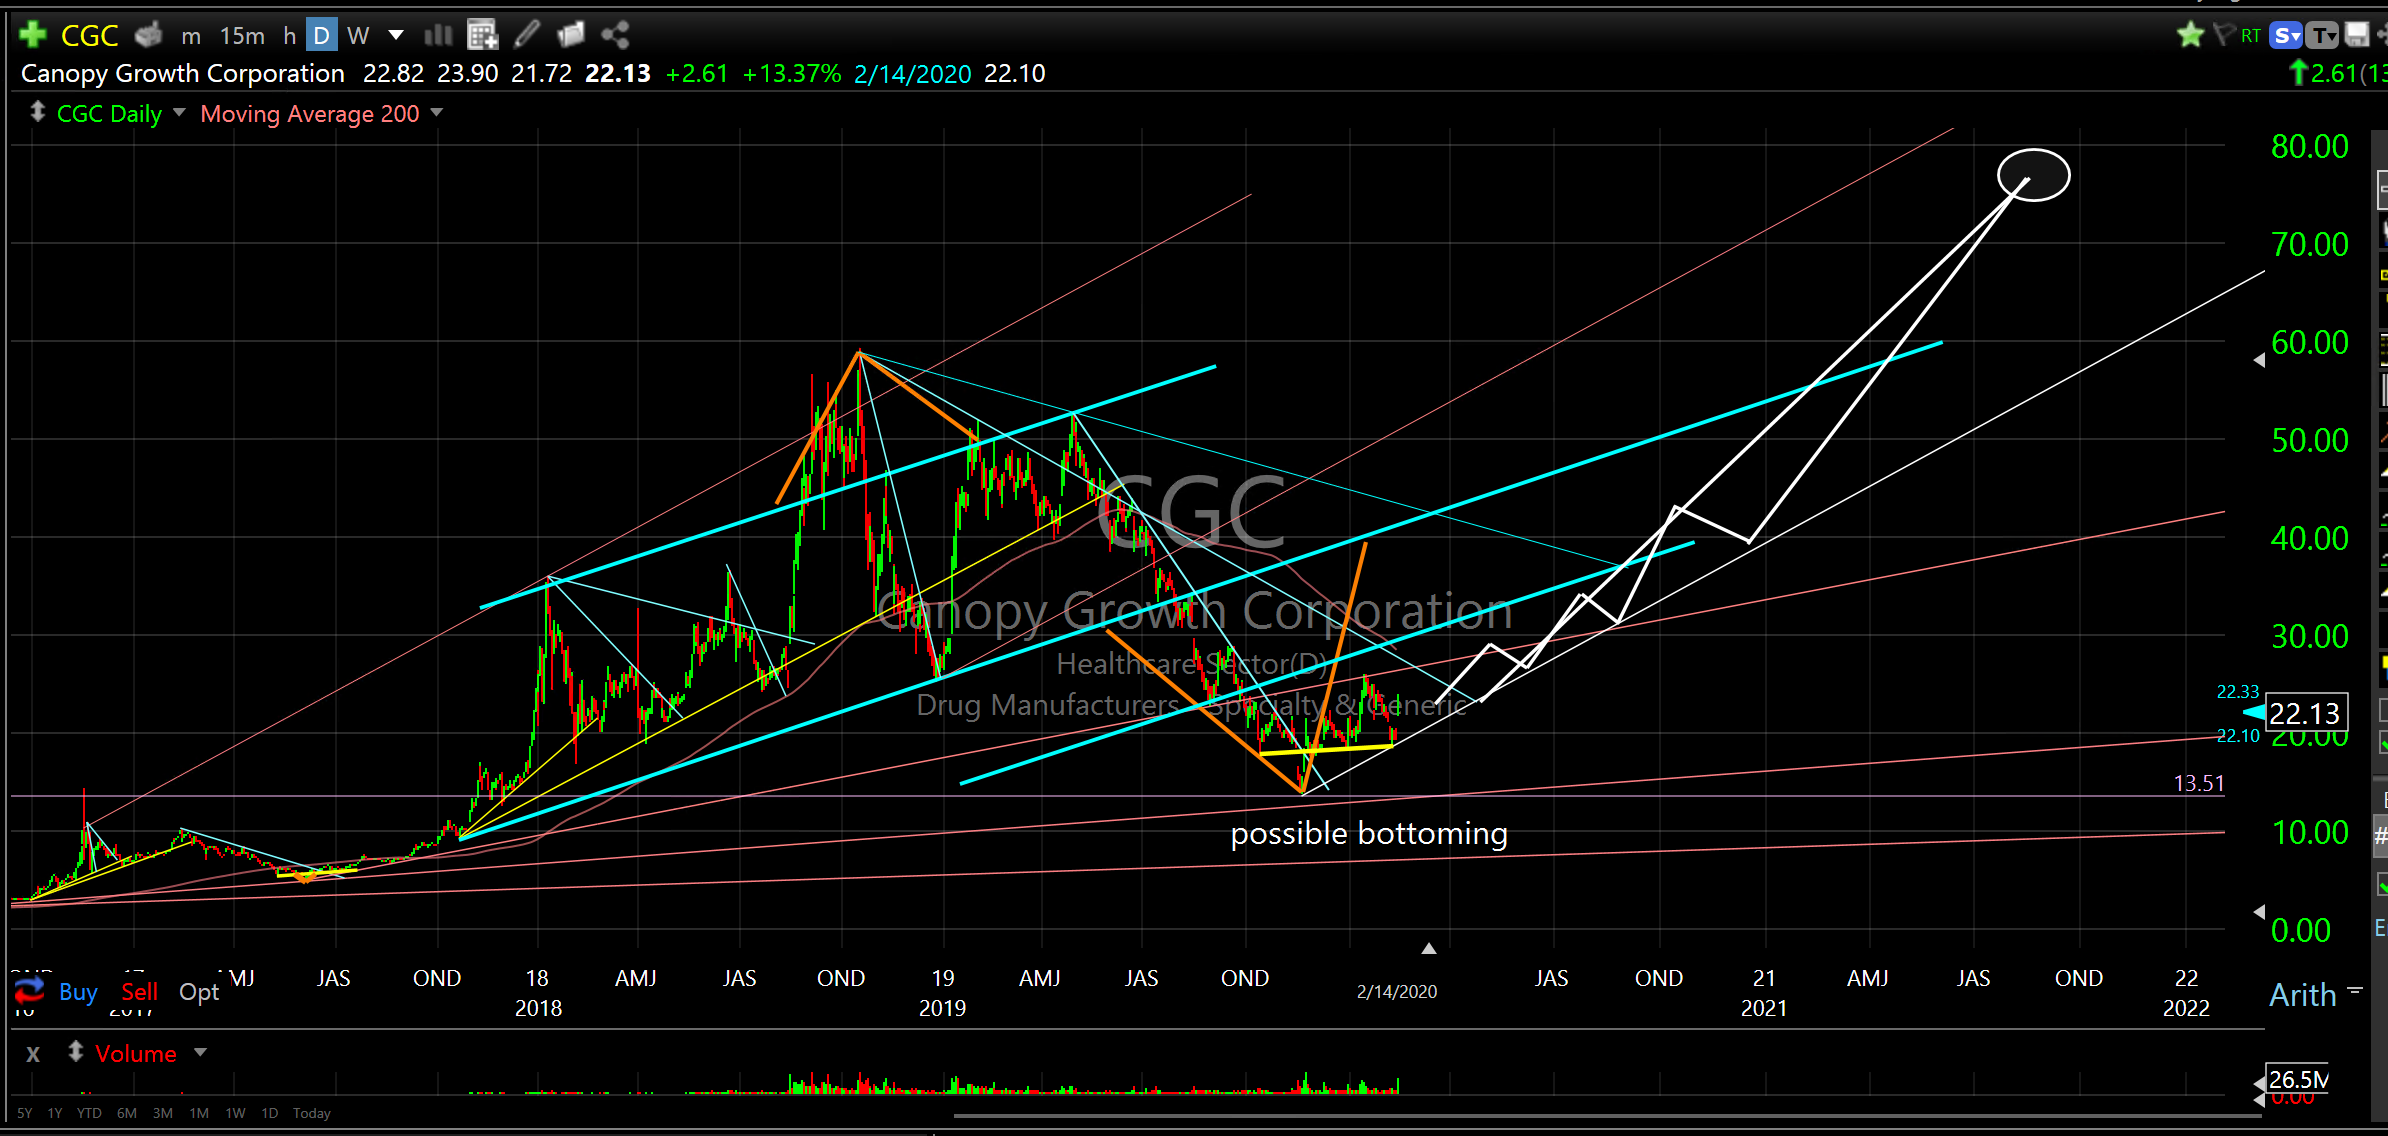
On a more speculative note, weed, bitcoin and fake meat might be ready to begin another massive expansion.
Canopy Growth Corporation (CGC) spiked up 13% on Friday after re-testing support. The bottoming over the past few months is very similar to the bottoming that occured in 2017 prior to the massive 2018 expansion. If it can cross over the next blue line resistance that would be another positive sign. Weed might be getting off the couch again.
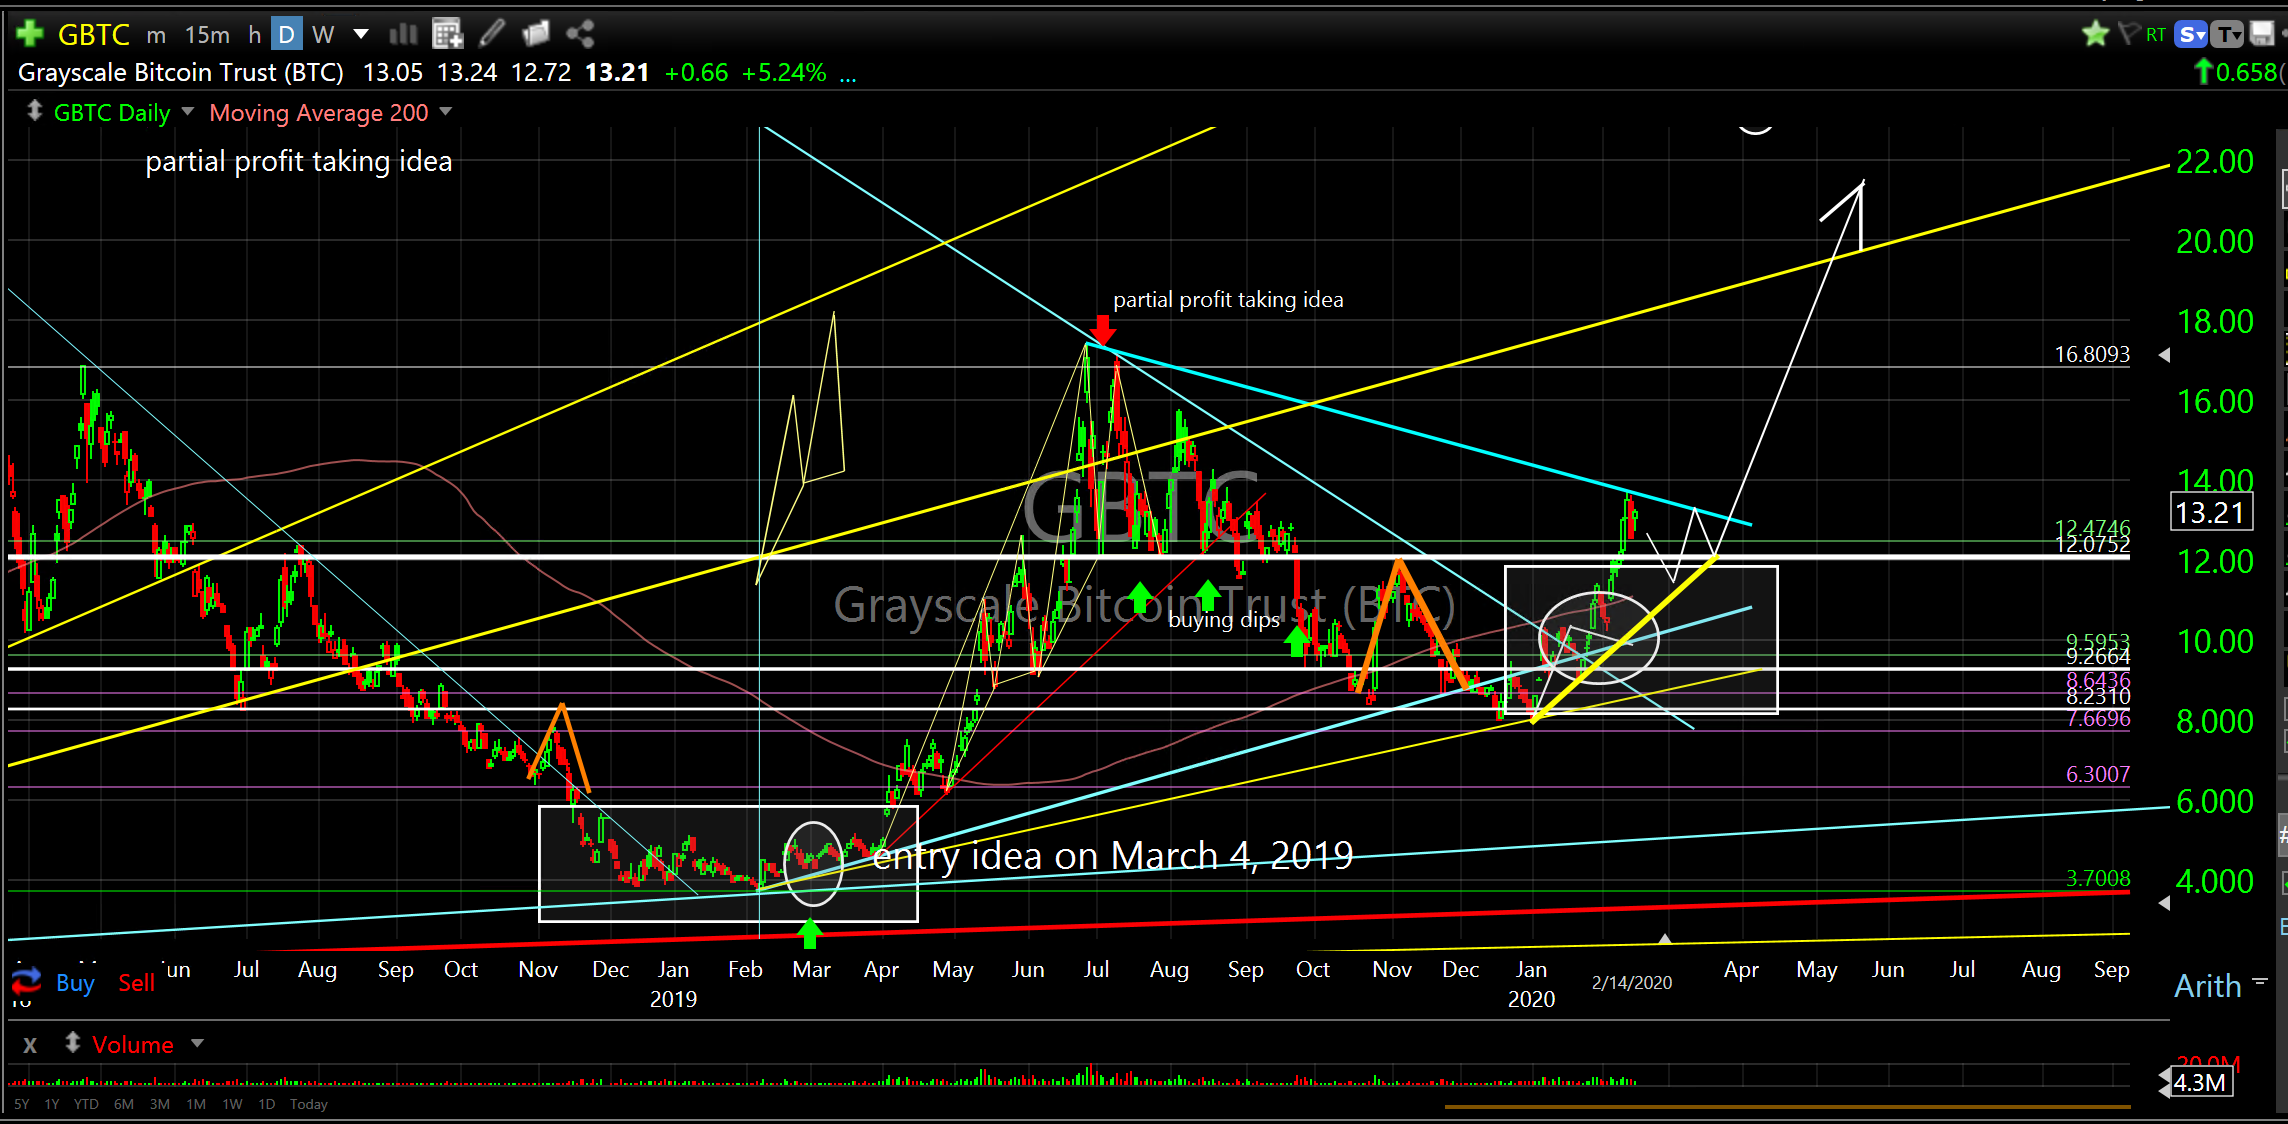
Last year we caught bitcoin at the virtual bottom of a 90% collapse and traded it up almost 200%. Yes, we were right there for the best performing asset class of 2019. Now, after retracing back to the middle of the 2019 expansion, bitcoin has double bottomed and spiked up 50% to resistance. I highlighted this two weeks ago and it has since shot straight up. It may fade back a bit here and provide another entry opportunity.
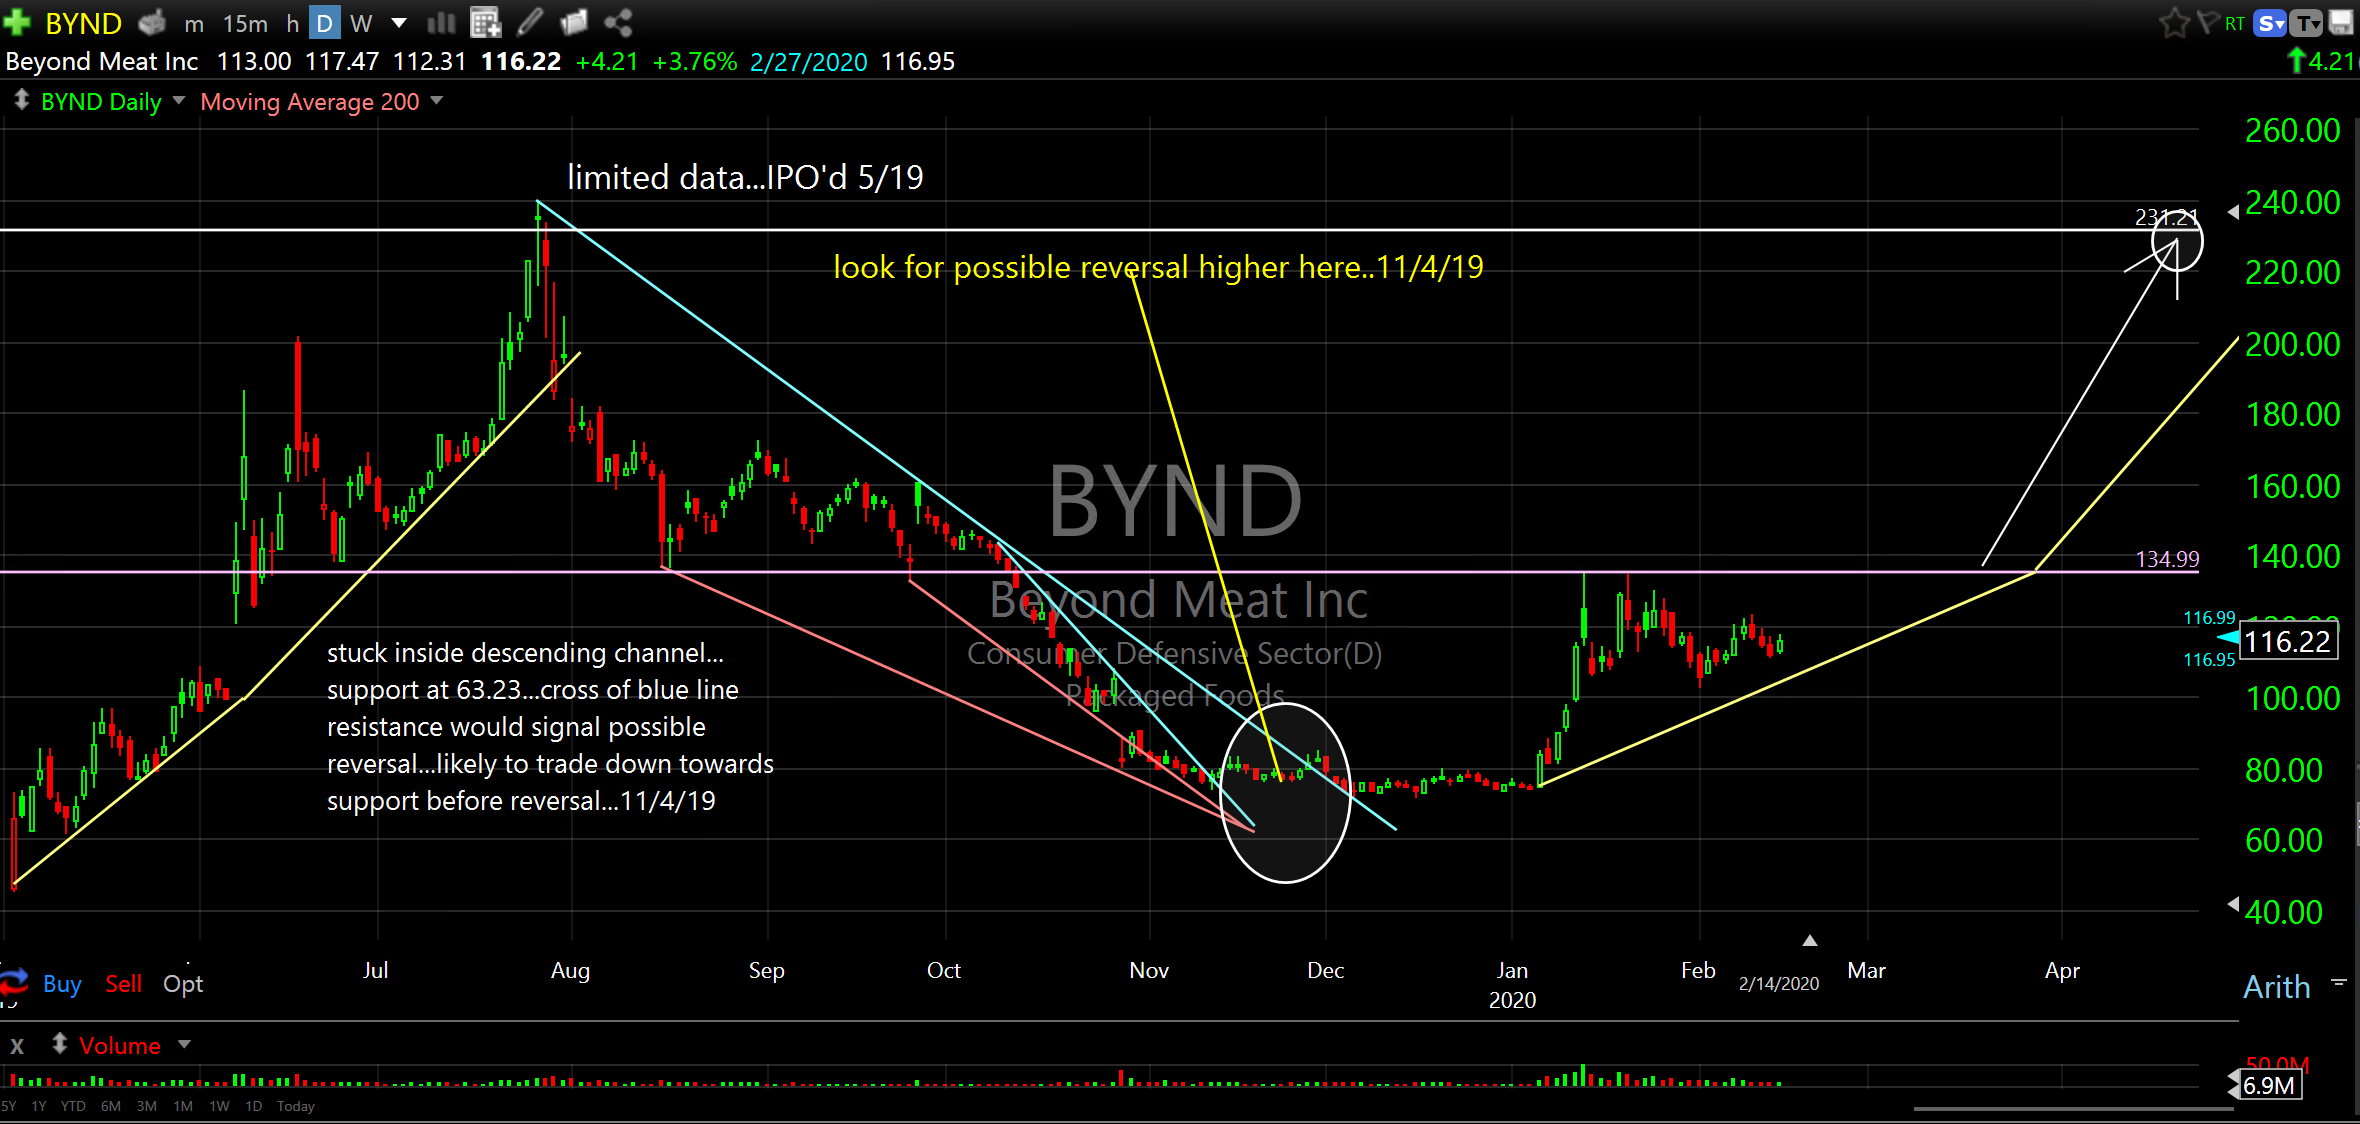
Beyond Meat Inc (BYND) has limited history as it IPO’d last May. After a massive 500% run in a matter of months it came down just as hard in a reflective matter of months and has recently began to turn back up. I charted this for someone in November and lo and behold it bottomed right about where I circled. This may be setting up for another big spike. The meat might be fake but the spike won’t be.
These are speculative. Know what your risks are. Be careful.
Canopy Growth Corporation (CGC)
Grayscale Bitcoin Trust (BTC) (GBTC)
Beyond Meat Inc (BYND)
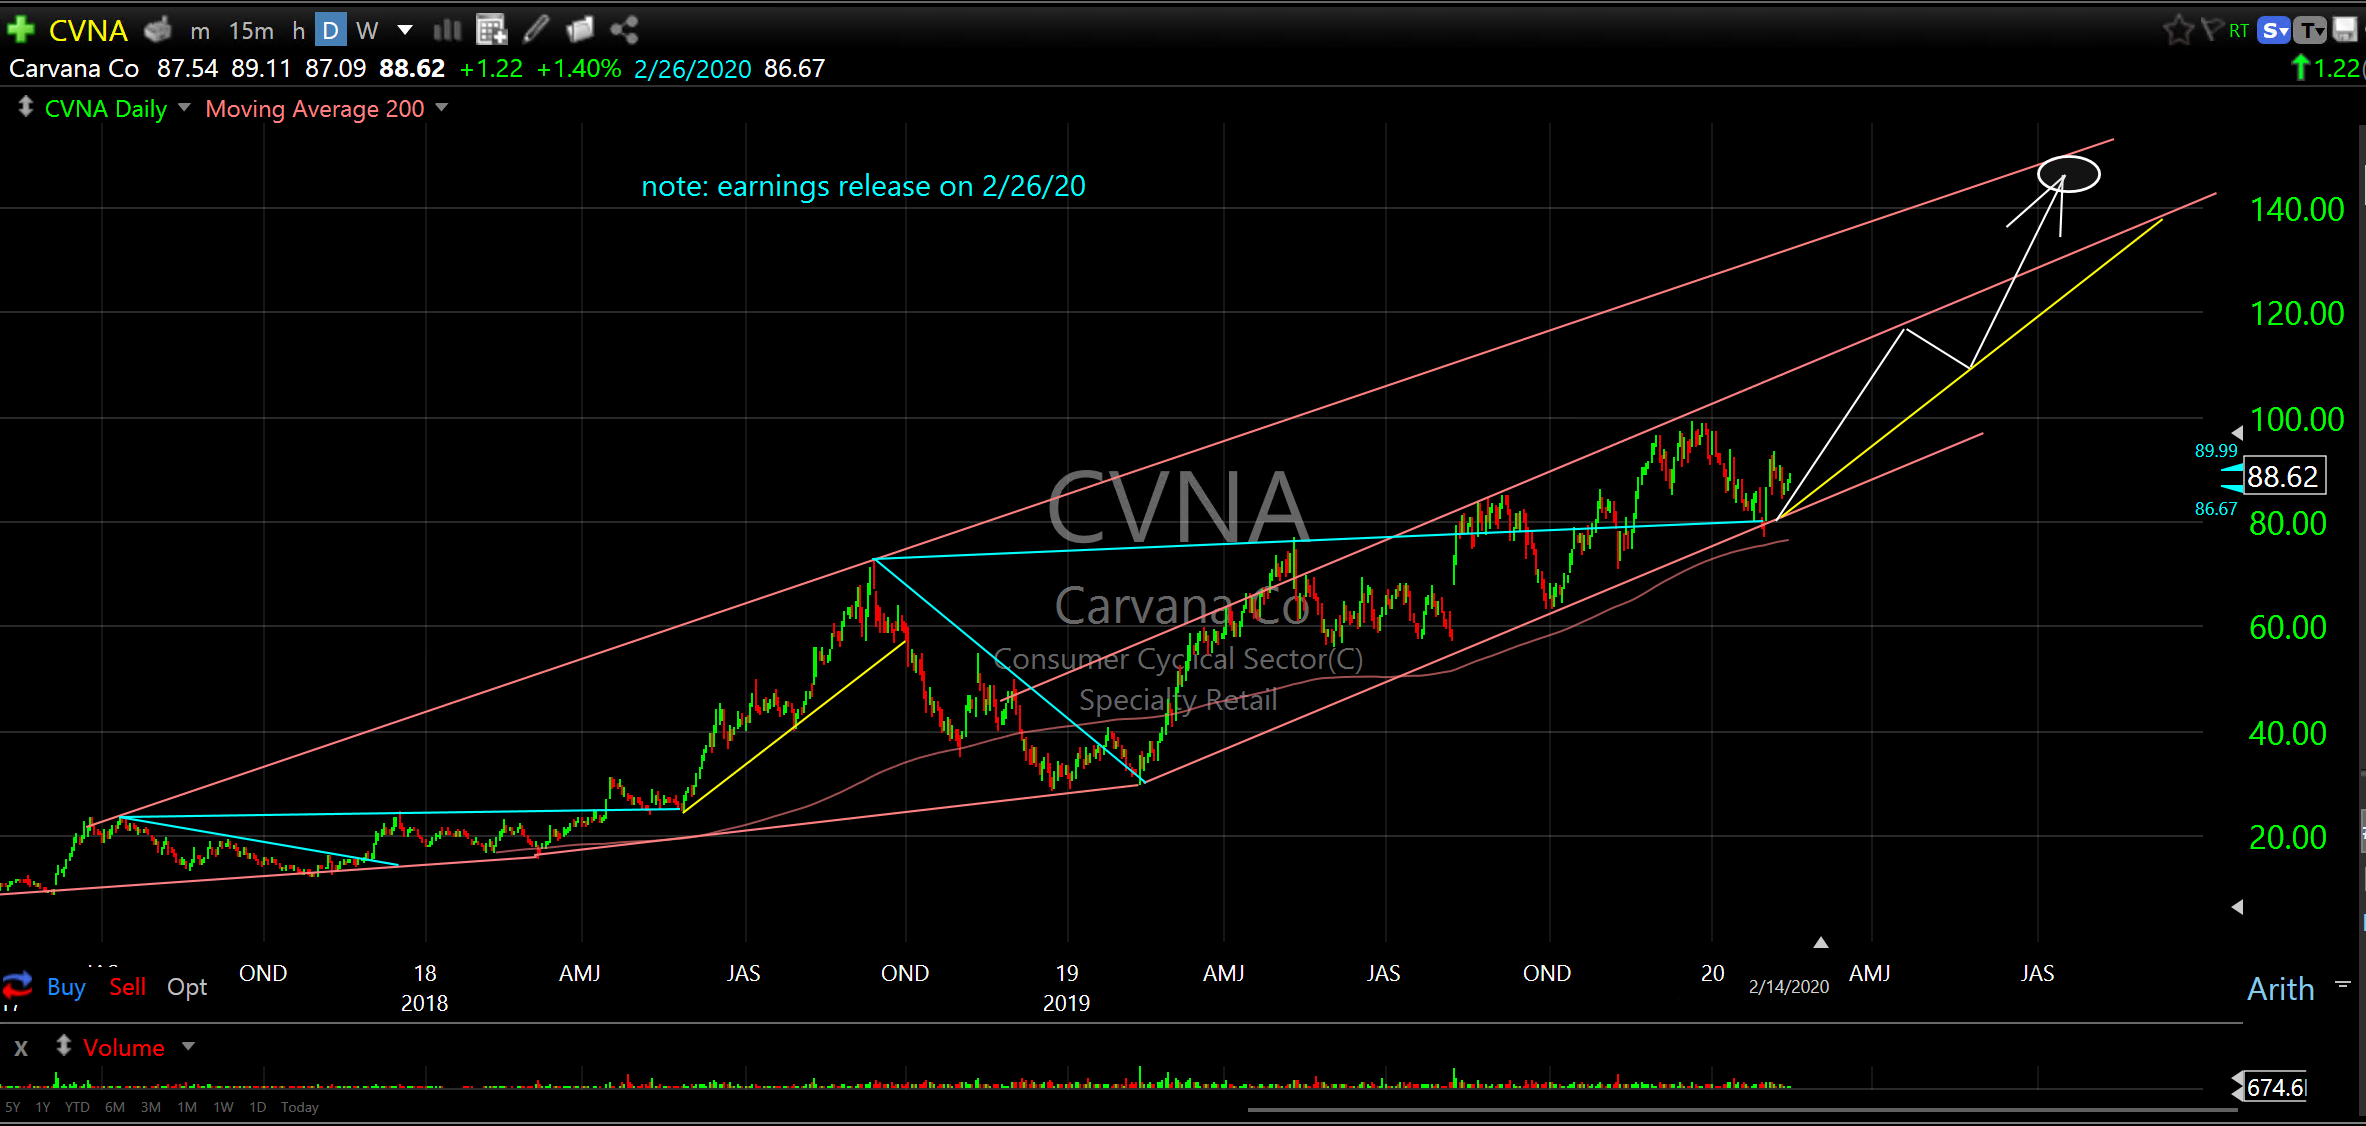
Also, Carvana Co (CVNA) is positioned really well. It has been channeling higher from the bottom in late 2018, has good support just above the 2018 peak and looks to be beginning a higher linear degree expansion where it could take a couple more legs up to $140.00. Please note that earnings are scheduled for 2/26/20.
Carvana Co (CVNA)
All is Well
The broader market expansion is tracking as projected. Separation from the 22 month ceiling which happened in early November continues to get wider. Sectors and subsectors remain in their expansion channels. The Fast Money crew on CNBC is still worried. Most everyone continues to scratch their heads at the expansion while trying to come up with reasons to explain it after the fact. This is exactly what we want to see.
We measure human behavior that is revealed in raw price data because it repeats in quantifiable characteristics. The characteristics will lead to the reversals. What could be better than identifying the reversals? Nothing, at least in StockMarketLand.
Have a good week,
Don